| Param | Original file | Final file |
|---|---|---|
| Filename | modeM0/AS1A07_068T01_9000003756_25857cztM0_level2.evt | modeM0/AS1A07_068T01_9000003756_25857cztM0_level2_quad_clean.evt |
| Size (bytes) | 925,735,680 | 83,597,760 |
| Size | 882.9 MB | 79.7 MB |
| Events in quadrant A | 4,242,031 | 540,278 |
| Events in quadrant B | 3,657,215 | 552,700 |
| Events in quadrant C | 14,910,262 | 392,994 |
| Events in quadrant D | 4,720,256 | 522,796 |
| Mode M0 | |||
|---|---|---|---|
| Quadrant | BADHDUFLAG | Total packets | Discarded packets |
| A | 0 | 17489 | 0 |
| B | 0 | 15656 | 0 |
| C | 0 | 49473 | 0 |
| D | 0 | 19240 | 0 |
| Mode M9 | |||
|---|---|---|---|
| Quadrant | BADHDUFLAG | Total packets | Discarded packets |
| A | 0 | 5 | 0 |
| B | 0 | 6 | 0 |
| C | 0 | 6 | 0 |
| D | 0 | 6 | 0 |
| Quadrant | Total seconds | Saturated seconds | Saturation percentage |
|---|---|---|---|
| A | 7498 | 271 | 3.614297% |
| B | 7498 | 113 | 1.507069% |
| C | 7498 | 4922 | 65.644172% |
| D | 7497 | 302 | 4.028278% |
Noise dominated data is calculated using 1-second bins in cleaned event files. If a bin has >2000 counts, and if more than 50% of those come from <1% of pixels, then it is considered to be noise-dominated and hence unusable.
| Quadrant | # 1 sec bins | Bins with >0 counts | Bins with >2000 counts | High rate bins dominated by noise | Noise dominated (total time) | Noise dominated (detector-on time) | Marked lightcurve |
|---|---|---|---|---|---|---|---|
| A | 7813 | 7499 | 167 | 167 | 2.14% | 2.23% | 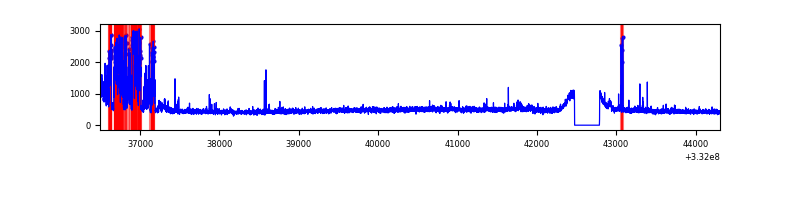 |
| B | 7813 | 7499 | 0 | 0 | 0.00% | 0.00% | 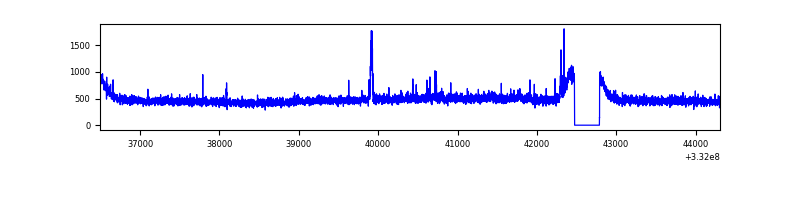 |
| C | 7813 | 7499 | 4083 | 4083 | 52.26% | 54.45% | 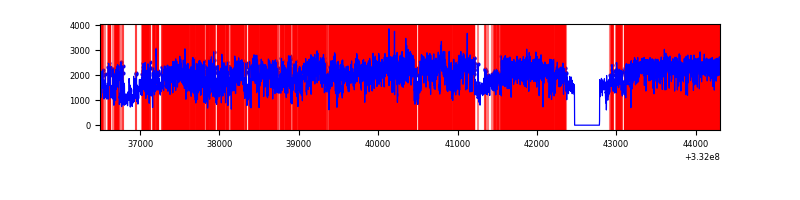 |
| D | 7812 | 7498 | 218 | 218 | 2.79% | 2.91% | 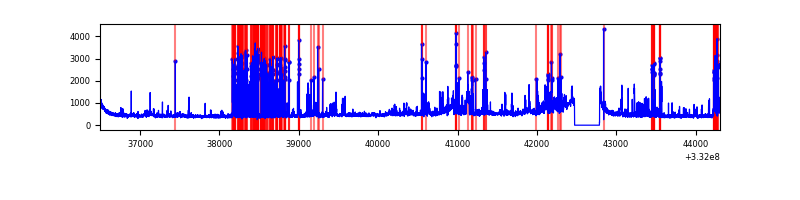 |
Top three noisy pixels from each quadrant. If the there are fewer than three noisy pixels in the level2.evt file, extra rows are filled as -1
| Pixel properties | Quadrant properties | ||||||
|---|---|---|---|---|---|---|---|
| Quadrant | DetID | PixID | Counts | Sigma | Mean | Median | Sigma |
| A | 0 | 13 | 741287 | 4024.57 | 906 | 886 | 184.0 |
| A | 13 | 254 | 9842 | 48.68 | 906 | 886 | 184.0 |
| A | 3 | 137 | 8915 | 43.64 | 906 | 886 | 184.0 |
| B | 0 | 245 | 30871 | 169.86 | 908 | 883 | 176.5 |
| B | 0 | 219 | 26168 | 143.22 | 908 | 883 | 176.5 |
| B | 12 | 111 | 22303 | 121.33 | 908 | 883 | 176.5 |
| C | 7 | 87 | 12004526 | 72265.11 | 707 | 710 | 166.1 |
| C | 14 | 238 | 107106 | 640.52 | 707 | 710 | 166.1 |
| C | 7 | 226 | 27670 | 162.3 | 707 | 710 | 166.1 |
| D | 1 | 52 | 1293834 | 6194.16 | 865 | 841 | 208.7 |
| D | 12 | 233 | 68777 | 325.45 | 865 | 841 | 208.7 |
| D | 7 | 80 | 49959 | 235.3 | 865 | 841 | 208.7 |
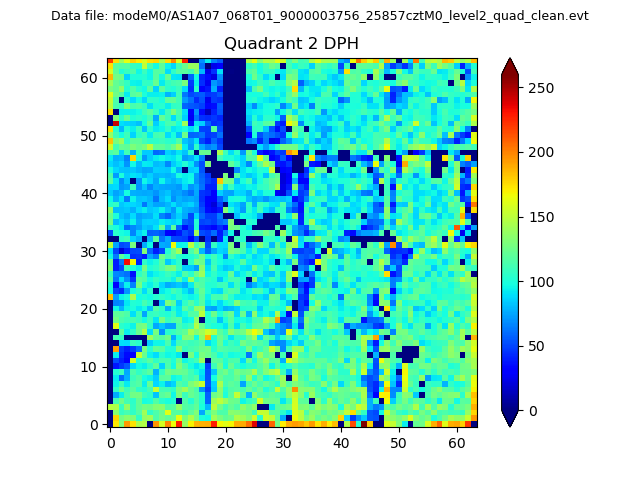
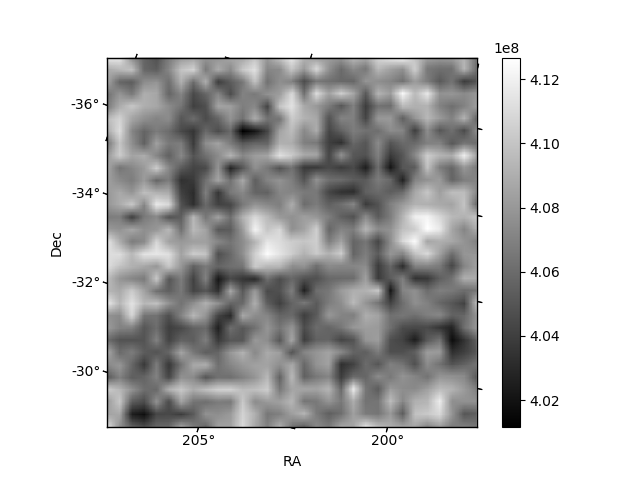
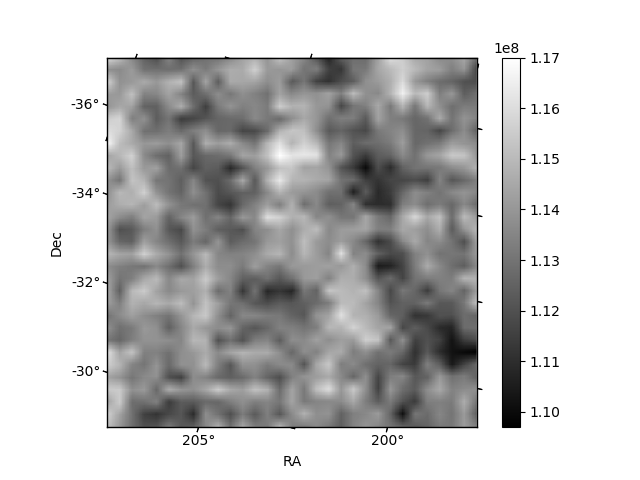
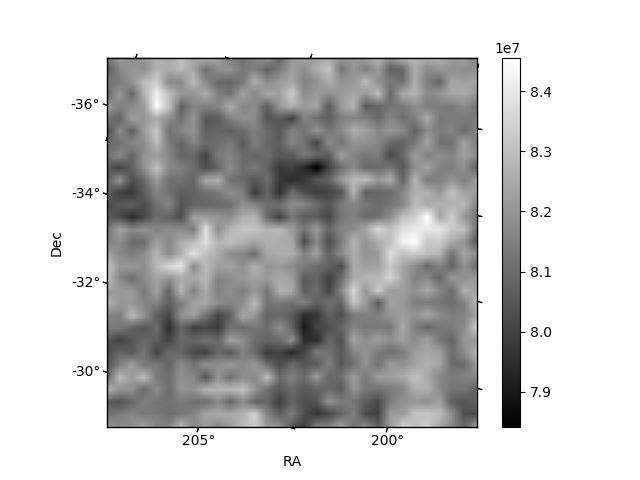
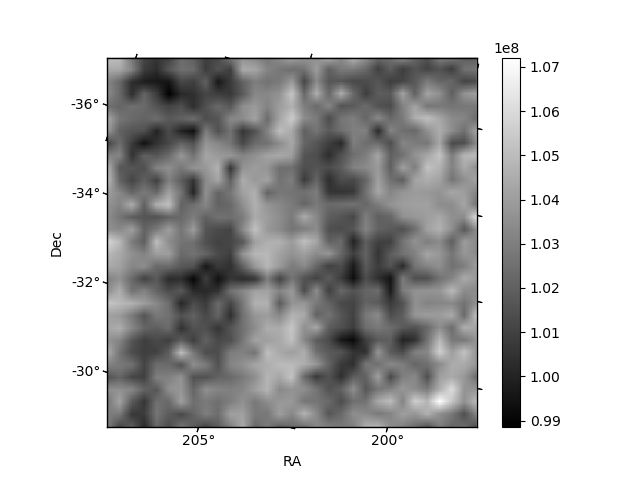
Histogram calculated using DETX and DETY for each event in the final _common_clean file
| Quadrant A | 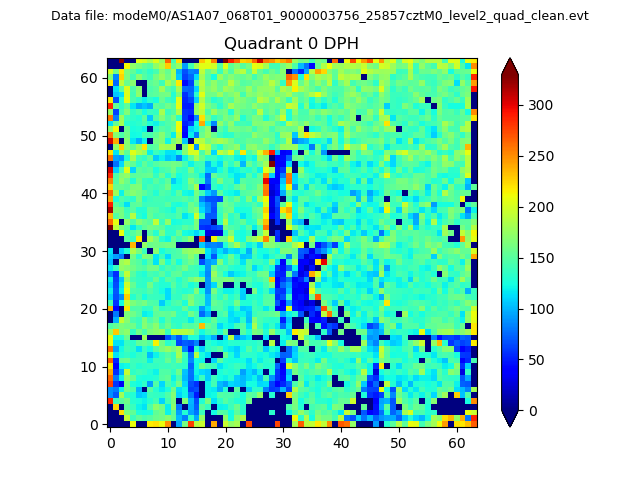 |
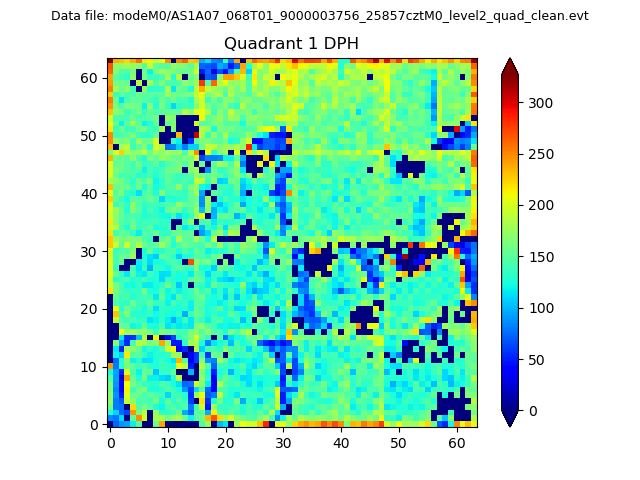 |
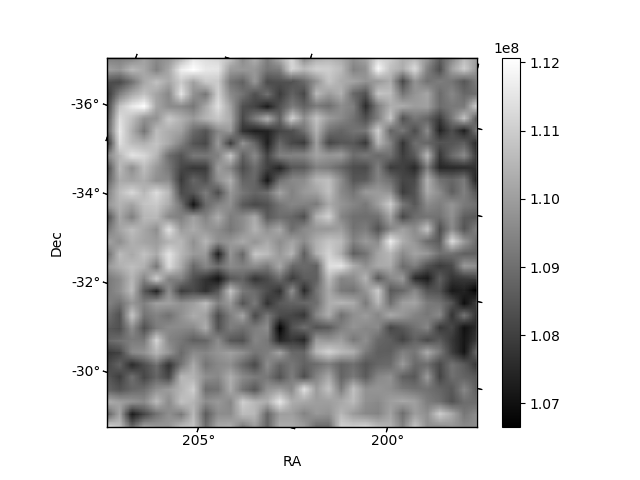
Quadrant B |
|---|---|---|---|
| Quadrant D | 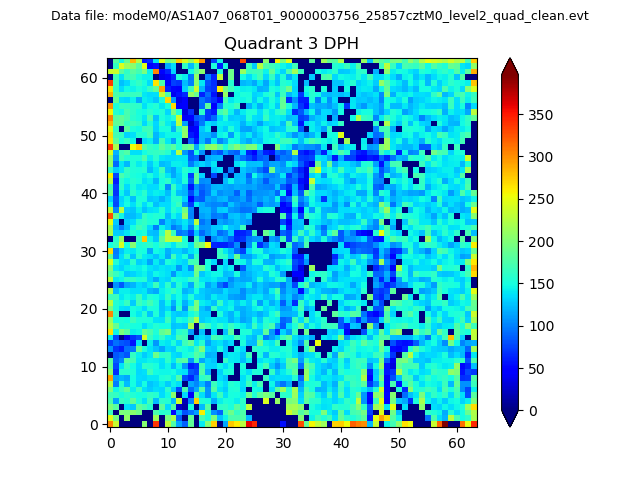 |
 |
Quadrant C |
| Plot type | Count rate plots | Images |
|---|---|---|
| Comparison with Poisson distribution Blue bars denote a histogram of data divided into 1 sec bins. Red curve is a Poisson curve with rate = median count rate of data. |
 |
 |
| Quadrant-wise count rates Data is divided into 100 sec bins |
 |
|
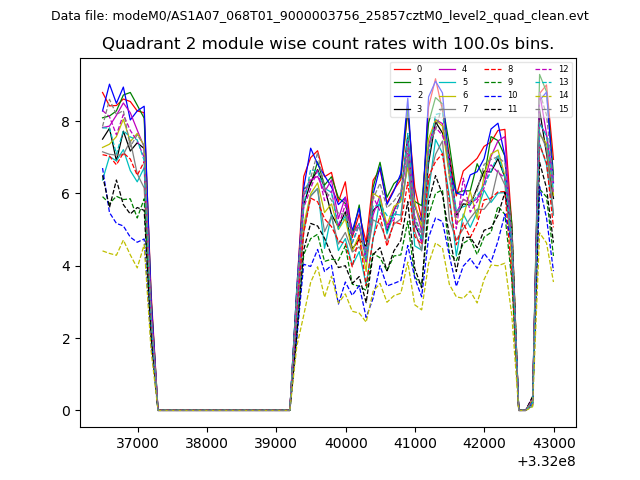
| Module-wise count rates for Quadrant A Data is divided into 100 sec bins |
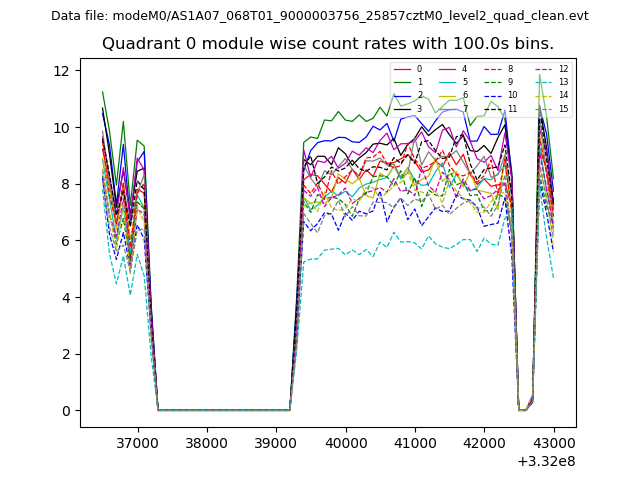 |
 |
| Module-wise count rates for Quadrant B Data is divided into 100 sec bins |
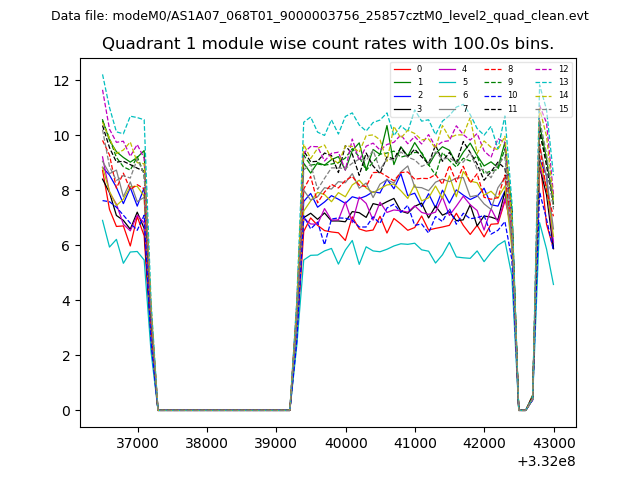 |
 |
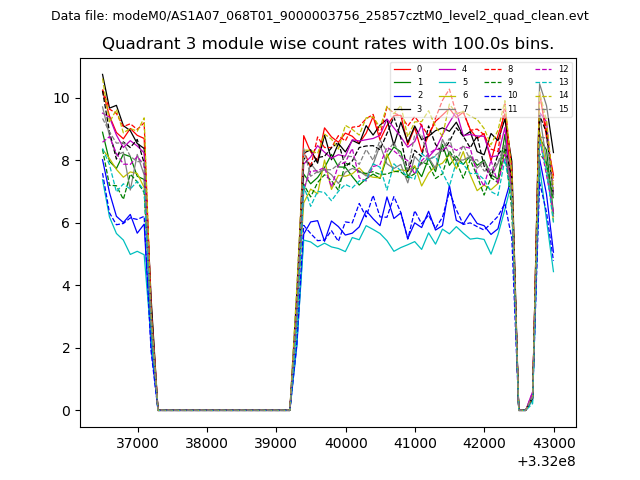
| Module-wise count rates for Quadrant C Data is divided into 100 sec bins |
 |
 |
| Module-wise count rates for Quadrant D Data is divided into 100 sec bins |
 |
 |
| Parameter | Plot |
|---|---|
| CZT HV Monitor | 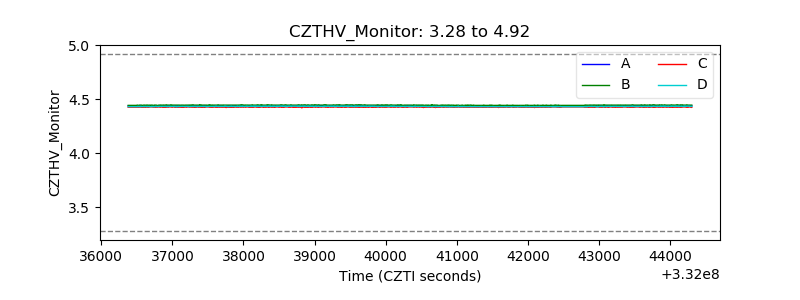 |
| D_VDD | 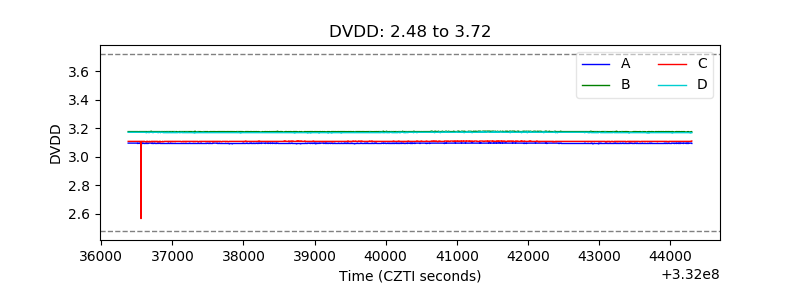 |
| Temperature 1 | 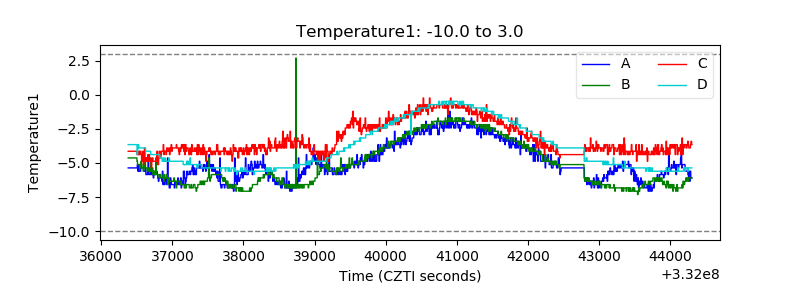 |
| Veto HV Monitor | 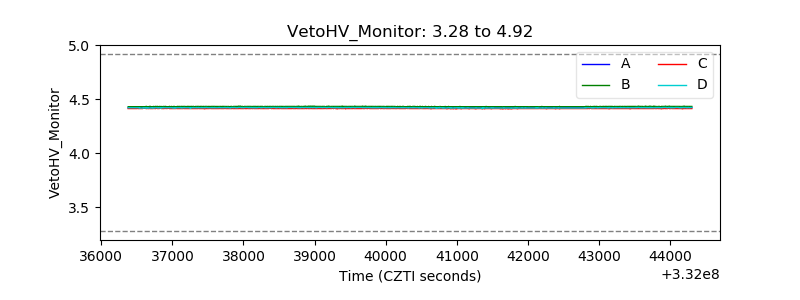 |
| Veto LLD | 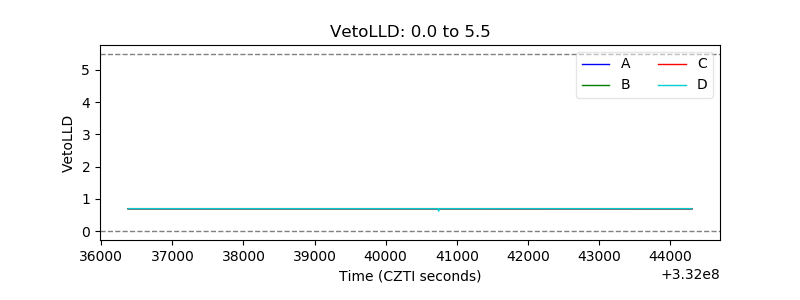 |
| Alpha Counter |  |
| _CPM_Rate |  |
| CZT Counter | 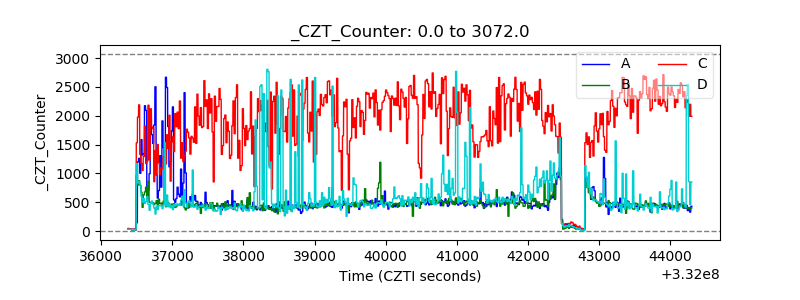 |
| +2.5 Volts monitor |  |
| +5 Volts monitor |  |
| _ROLL_ROT | 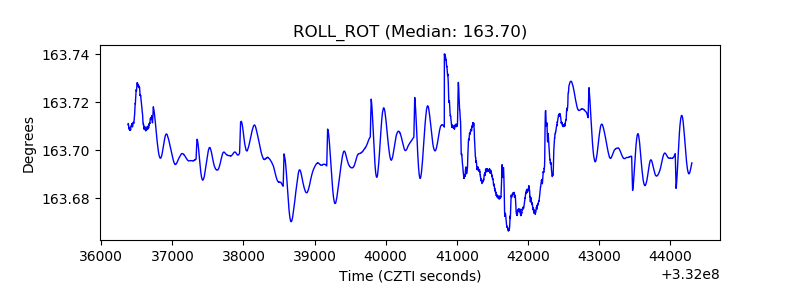 |
| _Roll_DEC | 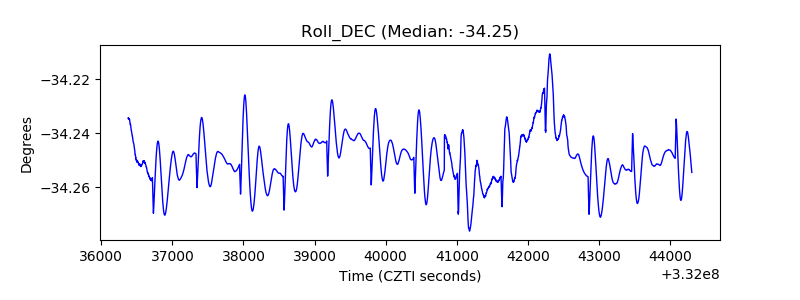 |
| _Roll_RA | 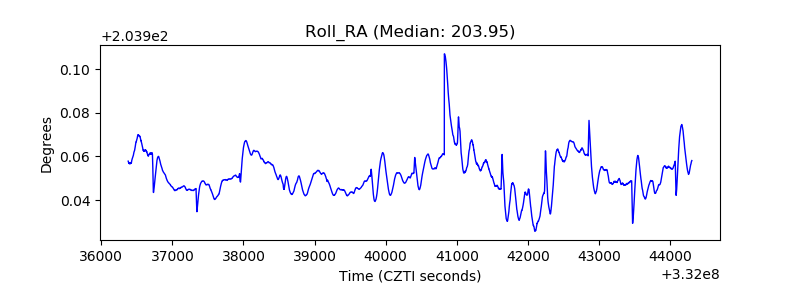 |
| Veto Counter | 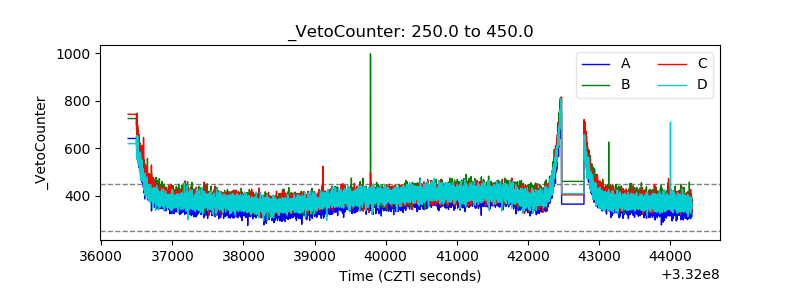 |