| Param | Original file | Final file |
|---|---|---|
| Filename | modeM0/AS1A07_068T01_9000003756_25860cztM0_level2.evt | modeM0/AS1A07_068T01_9000003756_25860cztM0_level2_quad_clean.evt |
| Size (bytes) | 2,658,490,560 | 267,569,280 |
| Size | 2.5 GB | 255.2 MB |
| Events in quadrant A | 12,330,806 | 1,805,899 |
| Events in quadrant B | 10,880,979 | 1,827,502 |
| Events in quadrant C | 40,776,499 | 1,202,383 |
| Events in quadrant D | 14,990,380 | 1,695,011 |
| Mode M0 | |||
|---|---|---|---|
| Quadrant | BADHDUFLAG | Total packets | Discarded packets |
| A | 0 | 50949 | 0 |
| B | 0 | 46621 | 0 |
| C | 0 | 136518 | 0 |
| D | 0 | 59908 | 0 |
| Mode M9 | |||
|---|---|---|---|
| Quadrant | BADHDUFLAG | Total packets | Discarded packets |
| A | 0 | 19 | 0 |
| B | 0 | 19 | 0 |
| C | 0 | 19 | 0 |
| D | 0 | 19 | 0 |
| Quadrant | Total seconds | Saturated seconds | Saturation percentage |
|---|---|---|---|
| A | 22802 | 307 | 1.346373% |
| B | 22803 | 183 | 0.802526% |
| C | 22804 | 13499 | 59.195755% |
| D | 22804 | 1067 | 4.679004% |
Noise dominated data is calculated using 1-second bins in cleaned event files. If a bin has >2000 counts, and if more than 50% of those come from <1% of pixels, then it is considered to be noise-dominated and hence unusable.
| Quadrant | # 1 sec bins | Bins with >0 counts | Bins with >2000 counts | High rate bins dominated by noise | Noise dominated (total time) | Noise dominated (detector-on time) | Marked lightcurve |
|---|---|---|---|---|---|---|---|
| A | 45125 | 22806 | 137 | 137 | 0.30% | 0.60% | 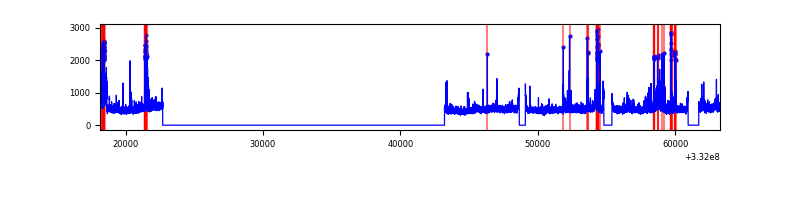 |
| B | 45125 | 22807 | 3 | 3 | 0.01% | 0.01% | 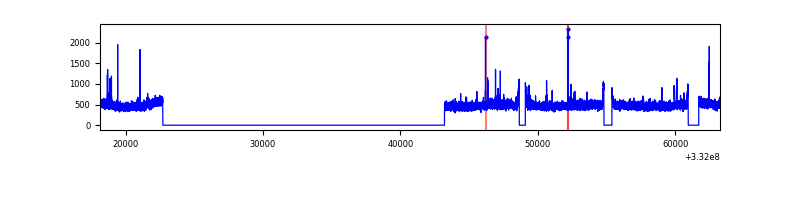 |
| C | 45126 | 22808 | 11983 | 11983 | 26.55% | 52.54% | 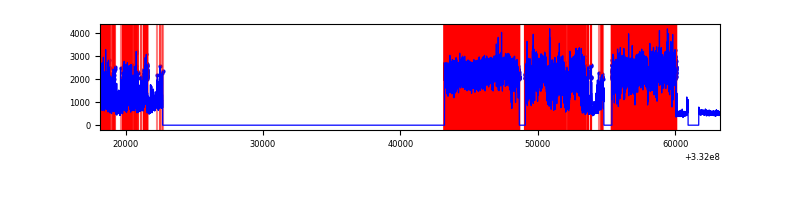 |
| D | 45126 | 22808 | 954 | 954 | 2.11% | 4.18% | 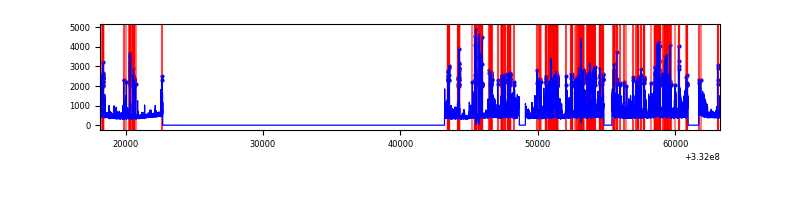 |
Top three noisy pixels from each quadrant. If the there are fewer than three noisy pixels in the level2.evt file, extra rows are filled as -1
| Pixel properties | Quadrant properties | ||||||
|---|---|---|---|---|---|---|---|
| Quadrant | DetID | PixID | Counts | Sigma | Mean | Median | Sigma |
| A | 0 | 13 | 1682023 | 3045.53 | 2760 | 2703 | 551.4 |
| A | 13 | 254 | 30158 | 49.79 | 2760 | 2703 | 551.4 |
| A | 3 | 137 | 26180 | 42.58 | 2760 | 2703 | 551.4 |
| B | 12 | 111 | 65702 | 120.2 | 2741 | 2667 | 524.4 |
| B | 11 | 111 | 59393 | 108.17 | 2741 | 2667 | 524.4 |
| B | 14 | 111 | 53858 | 97.61 | 2741 | 2667 | 524.4 |
| C | 7 | 87 | 32427076 | 69756.68 | 2004 | 2015 | 464.8 |
| C | 14 | 238 | 310693 | 664.07 | 2004 | 2015 | 464.8 |
| C | 3 | 233 | 156369 | 332.06 | 2004 | 2015 | 464.8 |
| D | 1 | 52 | 3850370 | 6149.25 | 2626 | 2562 | 625.7 |
| D | 7 | 80 | 424234 | 673.88 | 2626 | 2562 | 625.7 |
| D | 12 | 233 | 321594 | 509.85 | 2626 | 2562 | 625.7 |
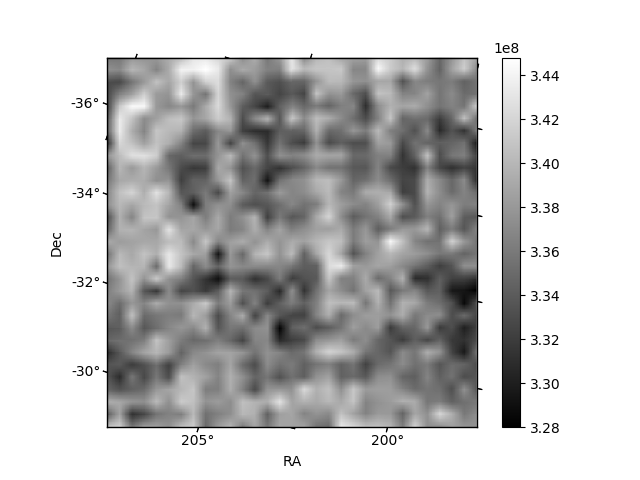
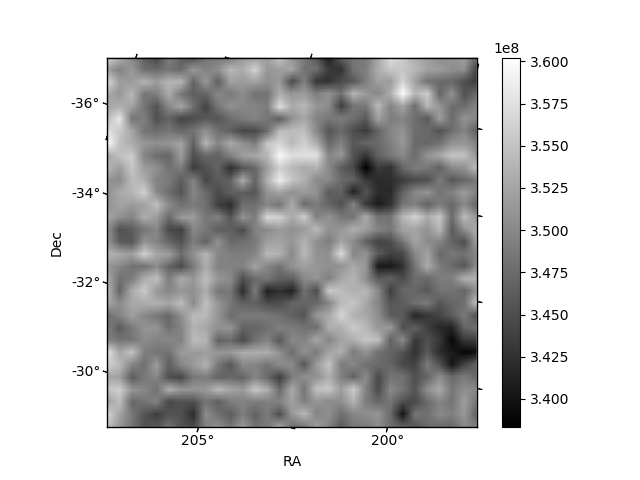
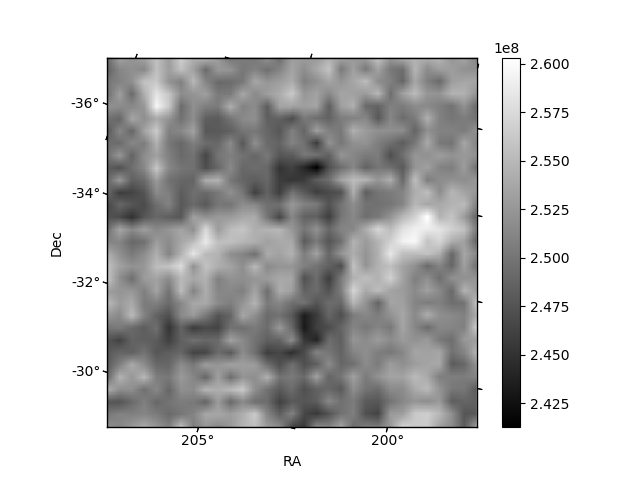
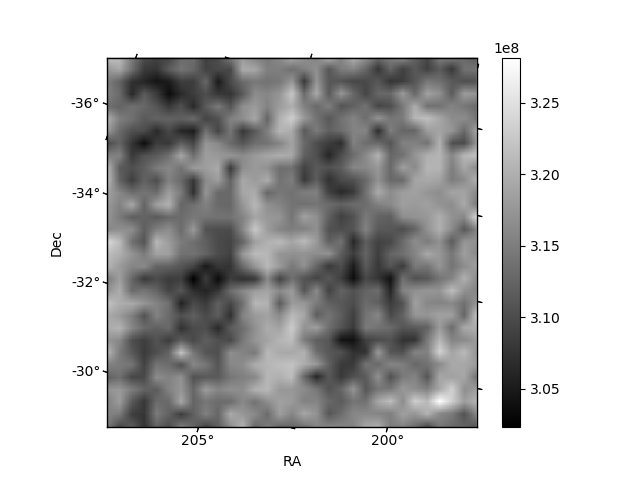
Histogram calculated using DETX and DETY for each event in the final _common_clean file
| Quadrant A | 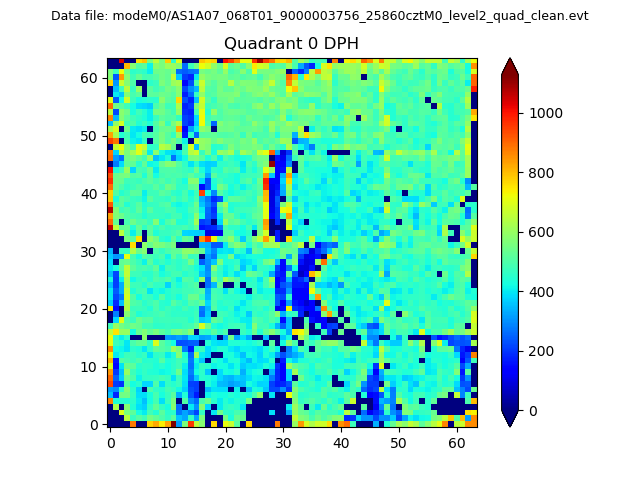 |
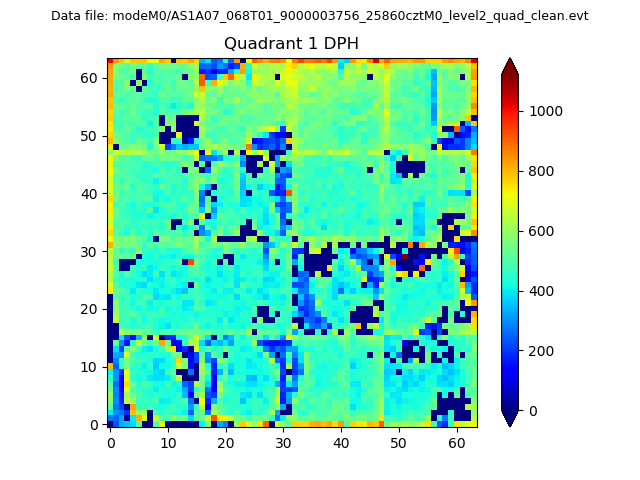 |
Quadrant B |
|---|---|---|---|
| Quadrant D | 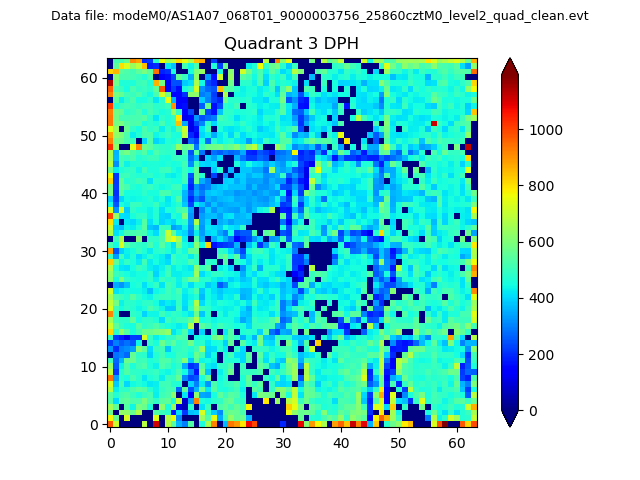 |
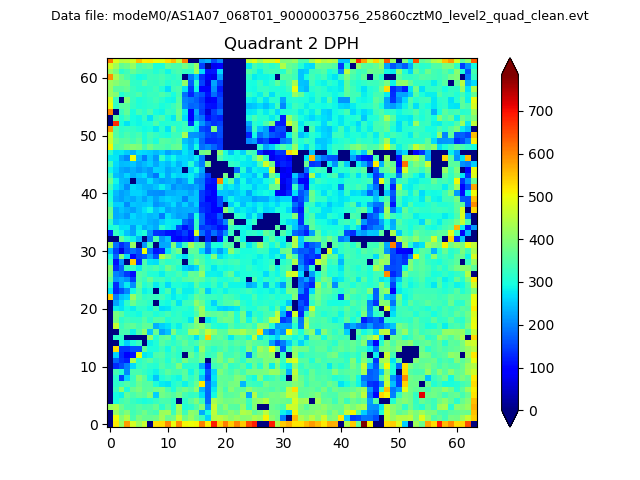 |
Quadrant C |
| Plot type | Count rate plots | Images |
|---|---|---|
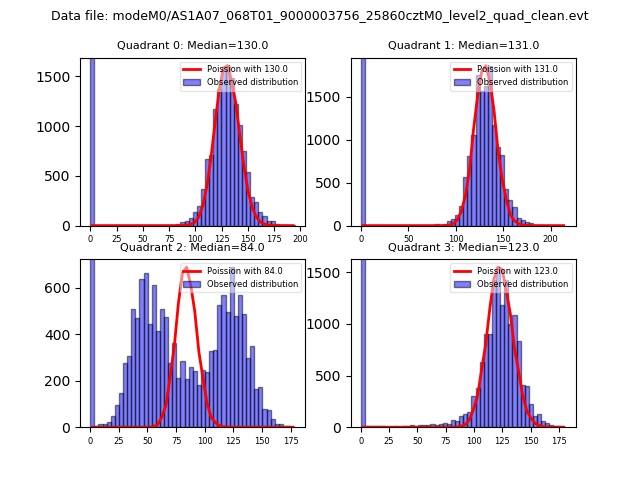
| Comparison with Poisson distribution Blue bars denote a histogram of data divided into 1 sec bins. Red curve is a Poisson curve with rate = median count rate of data. |
 |
 |
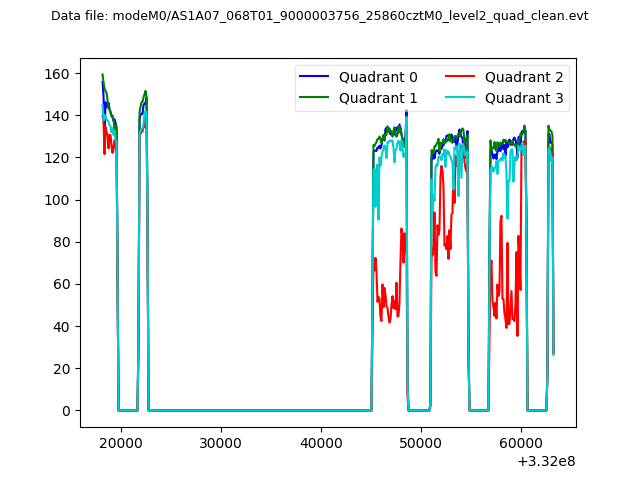
| Quadrant-wise count rates Data is divided into 100 sec bins |
 |
|
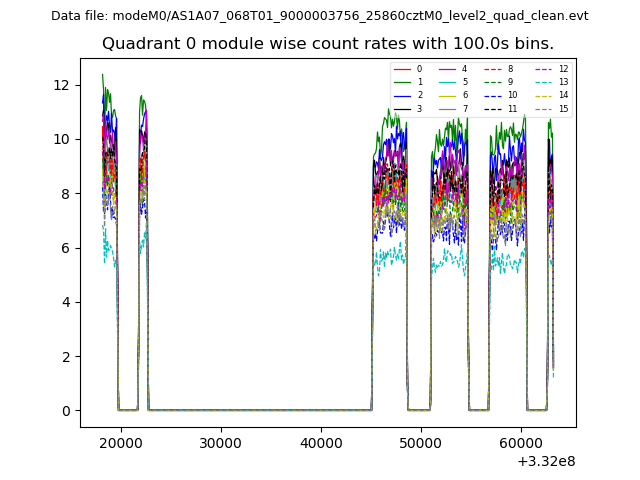
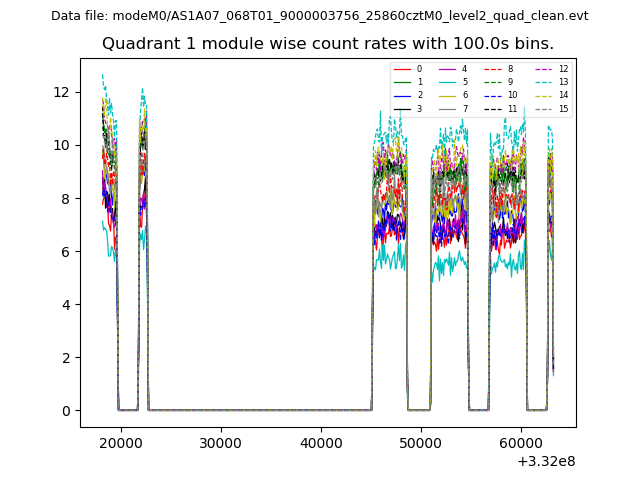
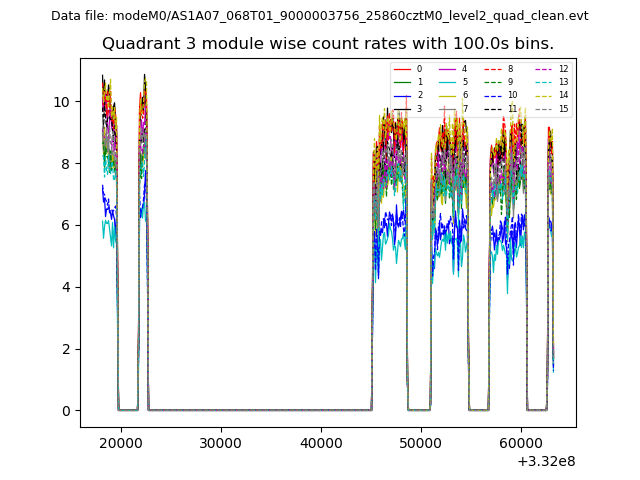
| Module-wise count rates for Quadrant A Data is divided into 100 sec bins |
 |
 |
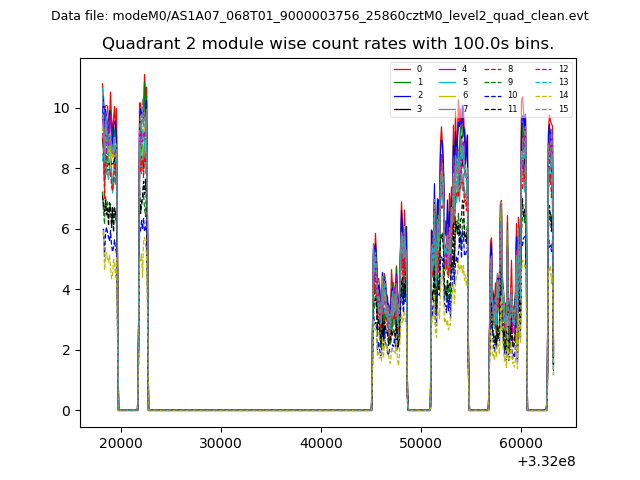
| Module-wise count rates for Quadrant B Data is divided into 100 sec bins |
 |
 |
| Module-wise count rates for Quadrant C Data is divided into 100 sec bins |
 |
 |
| Module-wise count rates for Quadrant D Data is divided into 100 sec bins |
 |
 |
| Parameter | Plot |
|---|---|
| CZT HV Monitor | 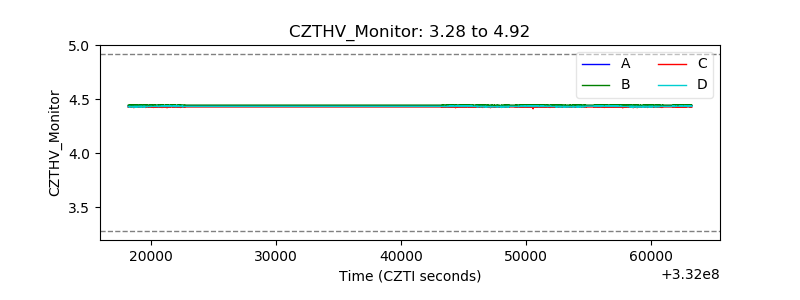 |
| D_VDD | 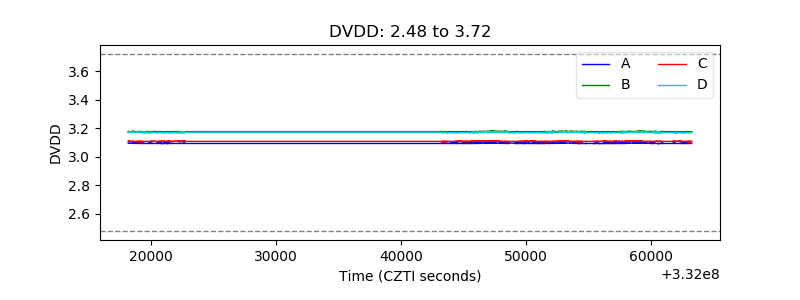 |
| Temperature 1 | 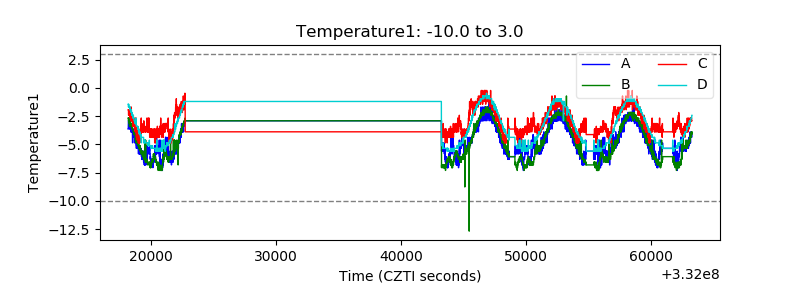 |
| Veto HV Monitor | 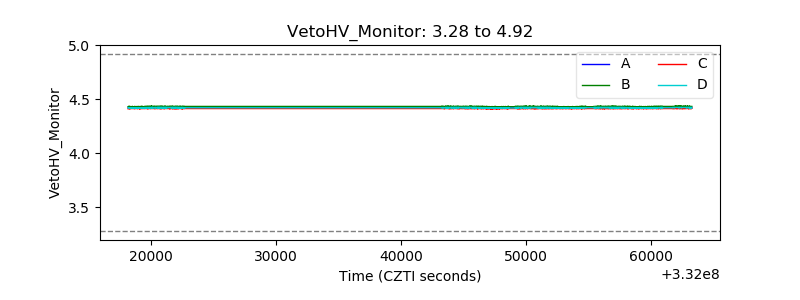 |
| Veto LLD | 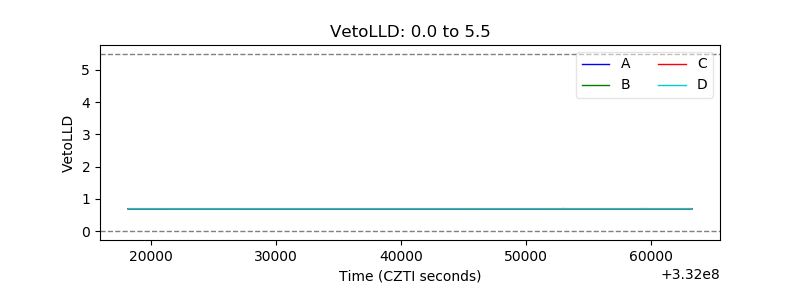 |
| Alpha Counter | 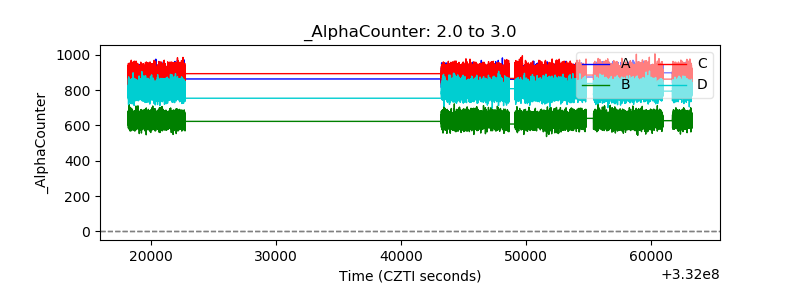 |
| _CPM_Rate | 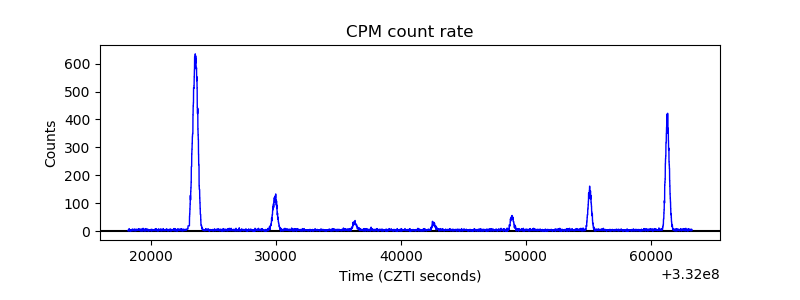 |
| CZT Counter | 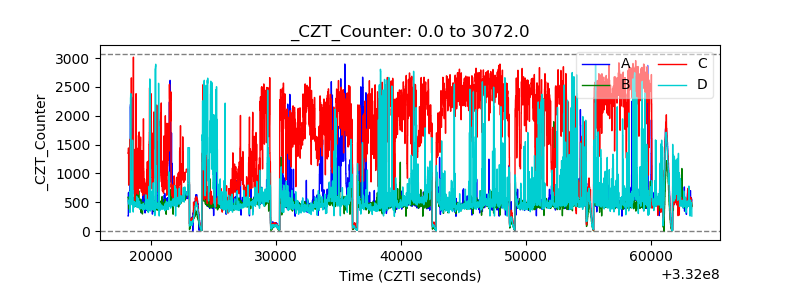 |
| +2.5 Volts monitor | 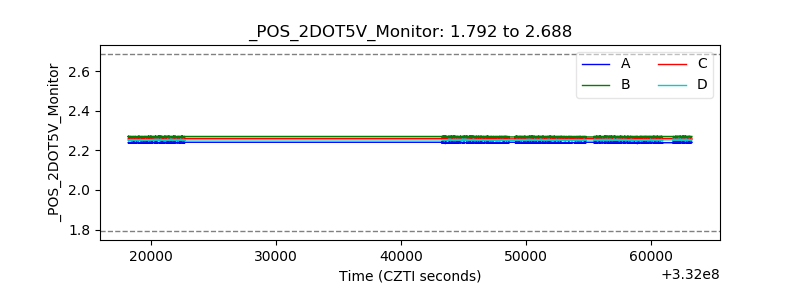 |
| +5 Volts monitor |  |
| _ROLL_ROT | 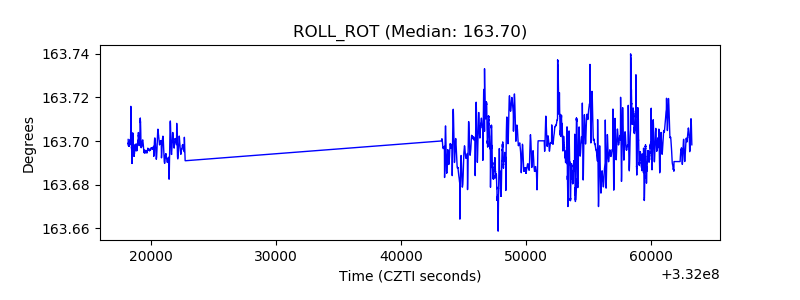 |
| _Roll_DEC | 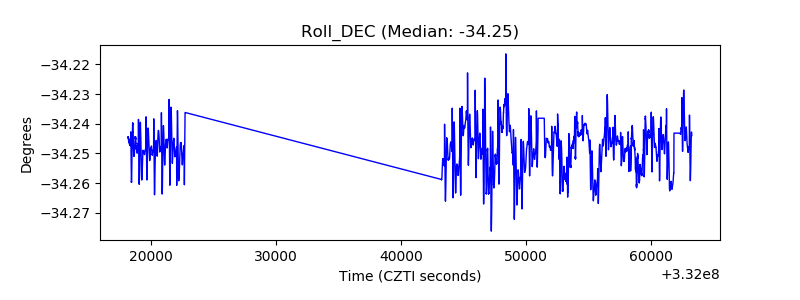 |
| _Roll_RA | 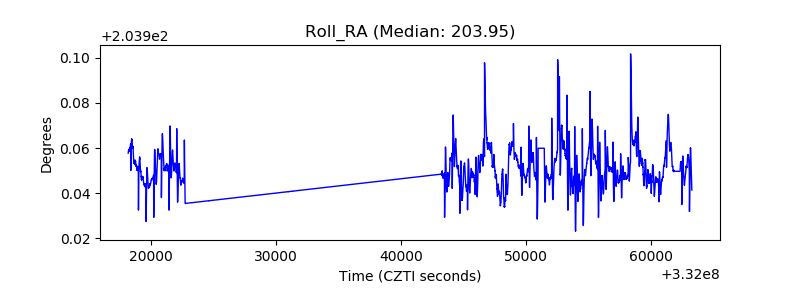 |
| Veto Counter | 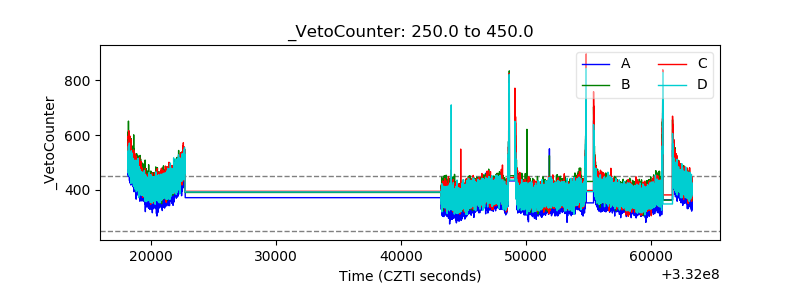 |