| Param | Original file | Final file |
|---|---|---|
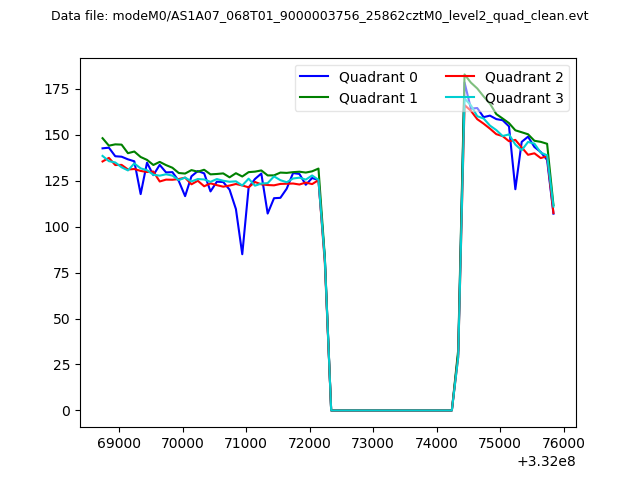
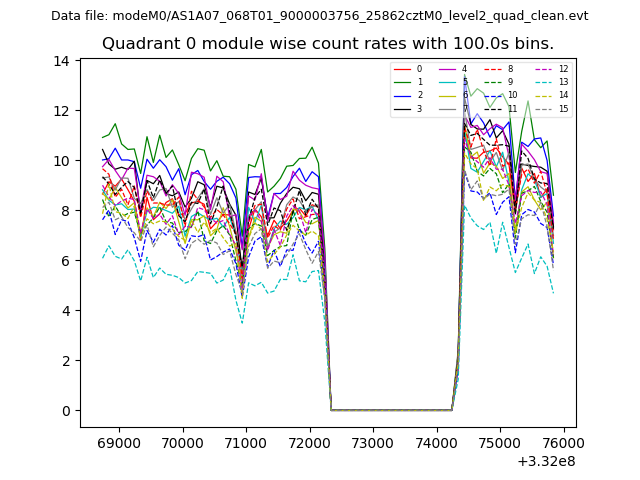
| Filename | modeM0/AS1A07_068T01_9000003756_25862cztM0_level2.evt | modeM0/AS1A07_068T01_9000003756_25862cztM0_level2_quad_clean.evt |
| Size (bytes) | 518,682,240 | 104,489,280 |
| Size | 494.7 MB | 99.6 MB |
| Events in quadrant A | 5,863,674 | 674,025 |
| Events in quadrant B | 3,152,119 | 711,609 |
| Events in quadrant C | 3,038,181 | 671,105 |
| Events in quadrant D | 3,239,184 | 680,040 |
| Mode M0 | |||
|---|---|---|---|
| Quadrant | BADHDUFLAG | Total packets | Discarded packets |
| A | 0 | 21721 | 0 |
| B | 0 | 13223 | 0 |
| C | 0 | 13007 | 0 |
| D | 0 | 13889 | 0 |
| Mode M9 | |||
|---|---|---|---|
| Quadrant | BADHDUFLAG | Total packets | Discarded packets |
| A | 0 | 11 | 0 |
| B | 0 | 11 | 0 |
| C | 0 | 11 | 0 |
| D | 0 | 11 | 0 |
| Quadrant | Total seconds | Saturated seconds | Saturation percentage |
|---|---|---|---|
| A | 6127 | 579 | 9.449976% |
| B | 6127 | 78 | 1.273054% |
| C | 6127 | 99 | 1.615799% |
| D | 6127 | 61 | 0.995593% |
Noise dominated data is calculated using 1-second bins in cleaned event files. If a bin has >2000 counts, and if more than 50% of those come from <1% of pixels, then it is considered to be noise-dominated and hence unusable.
| Quadrant | # 1 sec bins | Bins with >0 counts | Bins with >2000 counts | High rate bins dominated by noise | Noise dominated (total time) | Noise dominated (detector-on time) | Marked lightcurve |
|---|---|---|---|---|---|---|---|
| A | 7182 | 6128 | 449 | 449 | 6.25% | 7.33% | 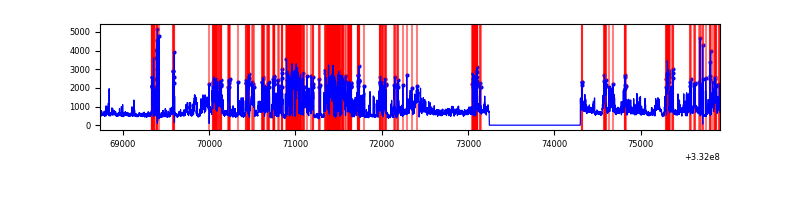 |
| B | 7182 | 6128 | 13 | 13 | 0.18% | 0.21% | 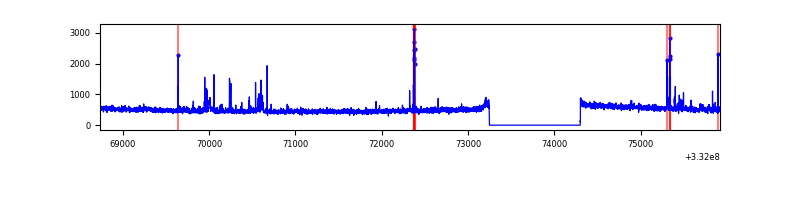 |
| C | 7182 | 6128 | 0 | 0 | 0.00% | 0.00% | 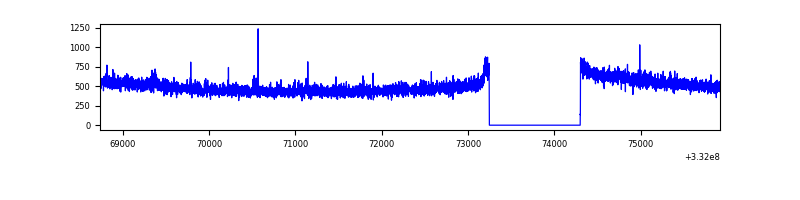 |
| D | 7182 | 6128 | 2 | 2 | 0.03% | 0.03% | 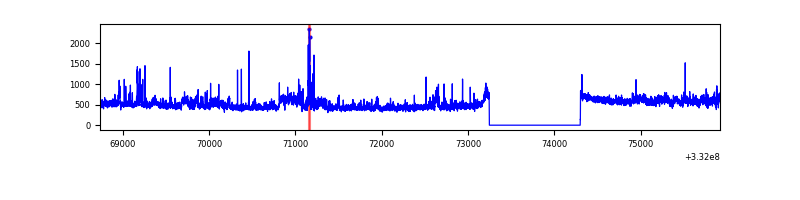 |
Top three noisy pixels from each quadrant. If the there are fewer than three noisy pixels in the level2.evt file, extra rows are filled as -1
| Pixel properties | Quadrant properties | ||||||
|---|---|---|---|---|---|---|---|
| Quadrant | DetID | PixID | Counts | Sigma | Mean | Median | Sigma |
| A | 0 | 13 | 2920171 | 19176.51 | 763 | 747 | 152.2 |
| A | 13 | 254 | 7622 | 45.16 | 763 | 747 | 152.2 |
| A | 3 | 137 | 6846 | 40.06 | 763 | 747 | 152.2 |
| B | 10 | 245 | 112639 | 762.91 | 766 | 748 | 146.7 |
| B | 12 | 111 | 17643 | 115.2 | 766 | 748 | 146.7 |
| B | 0 | 219 | 16526 | 107.58 | 766 | 748 | 146.7 |
| C | 14 | 238 | 121685 | 709.54 | 737 | 742 | 170.5 |
| C | 3 | 233 | 40923 | 235.73 | 737 | 742 | 170.5 |
| C | 13 | 61 | 4992 | 24.93 | 737 | 742 | 170.5 |
| D | 1 | 52 | 280046 | 1547.59 | 758 | 739 | 180.5 |
| D | 12 | 233 | 41865 | 227.87 | 758 | 739 | 180.5 |
| D | 7 | 80 | 34801 | 188.73 | 758 | 739 | 180.5 |
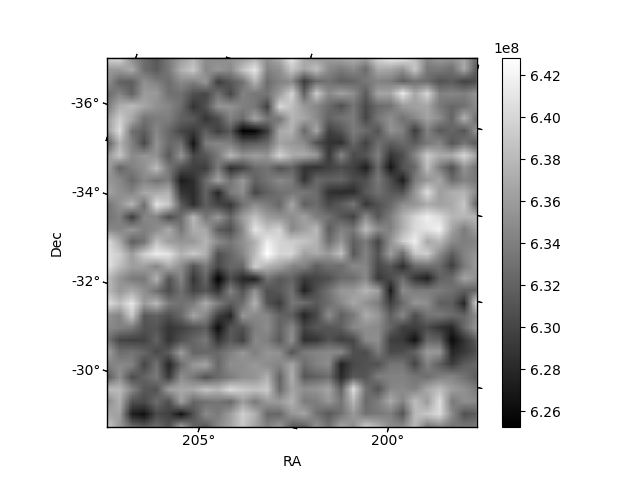
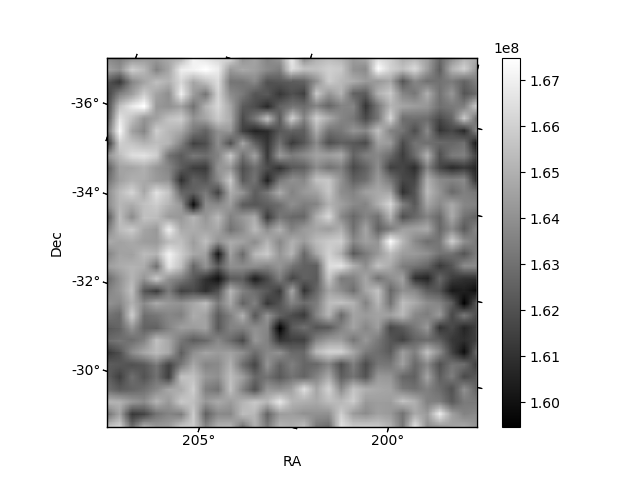
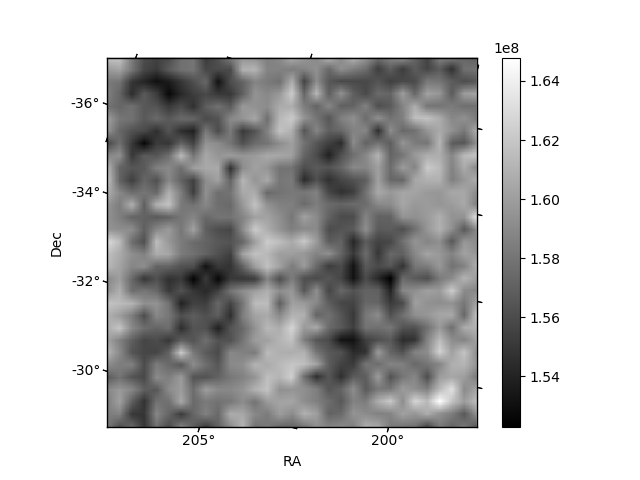
Histogram calculated using DETX and DETY for each event in the final _common_clean file
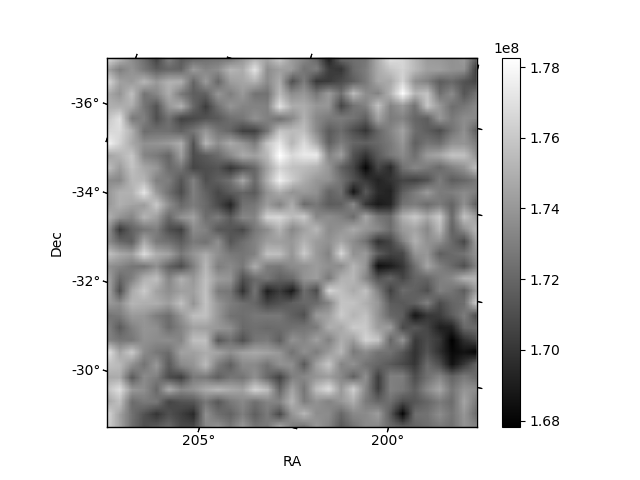
| Quadrant A | 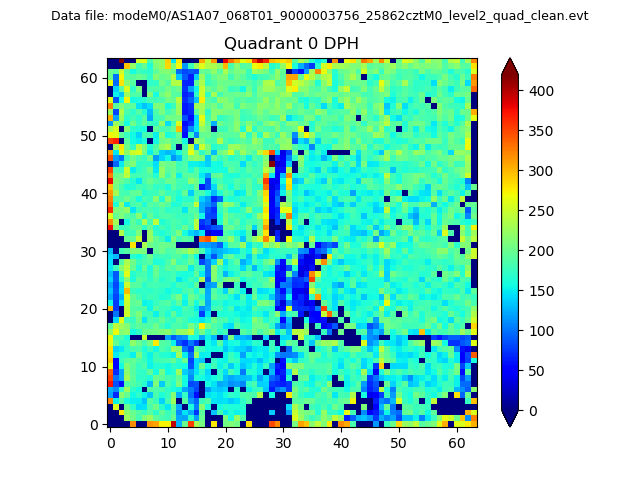 |
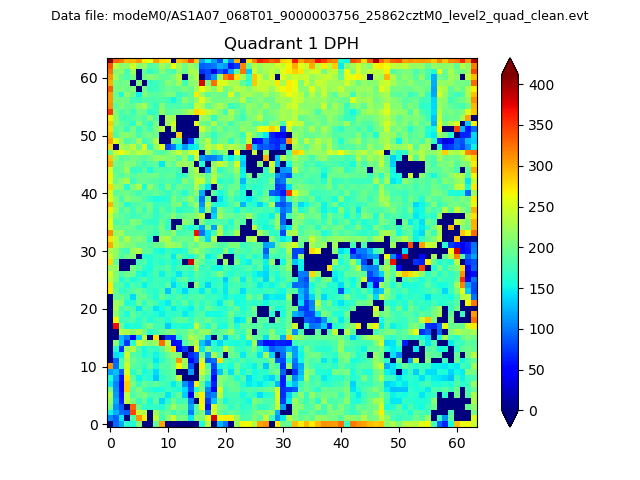 |
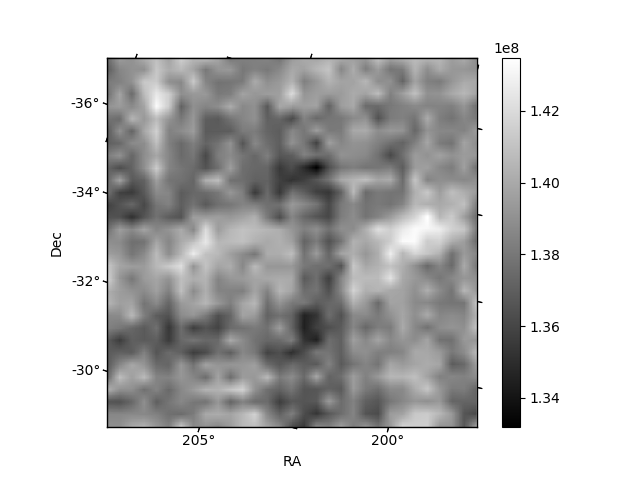
Quadrant B |
|---|---|---|---|
| Quadrant D | 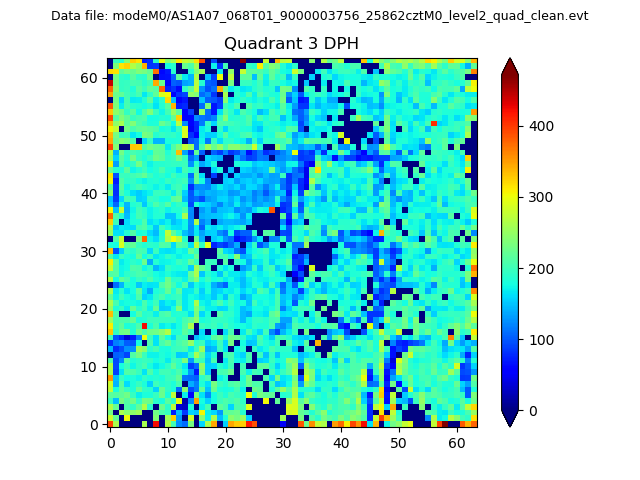 |
 |
Quadrant C |
| Plot type | Count rate plots | Images |
|---|---|---|
| Comparison with Poisson distribution Blue bars denote a histogram of data divided into 1 sec bins. Red curve is a Poisson curve with rate = median count rate of data. |
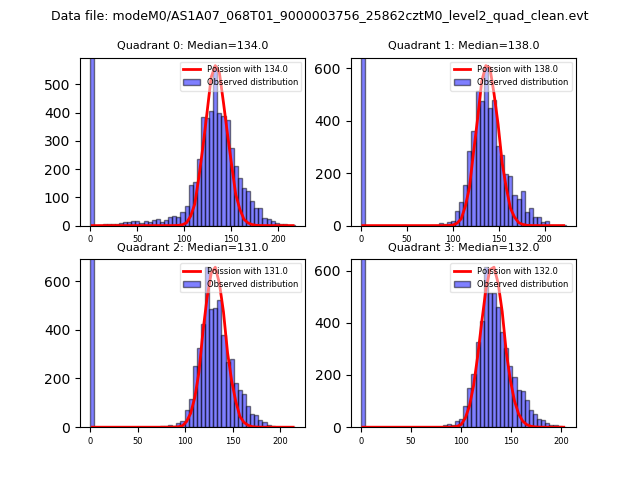 |
 |
| Quadrant-wise count rates Data is divided into 100 sec bins |
 |
|
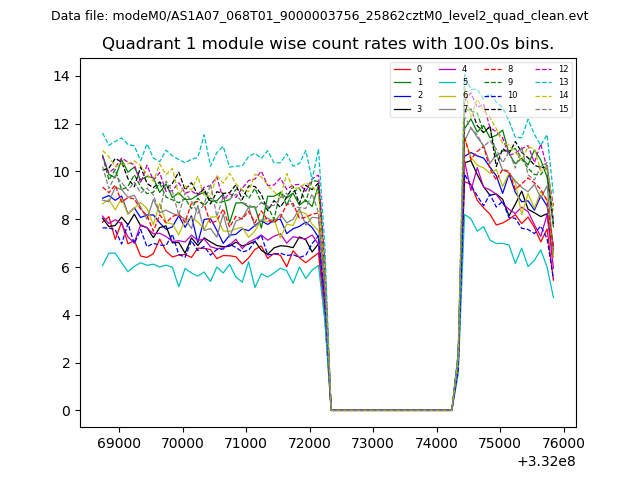
| Module-wise count rates for Quadrant A Data is divided into 100 sec bins |
 |
 |
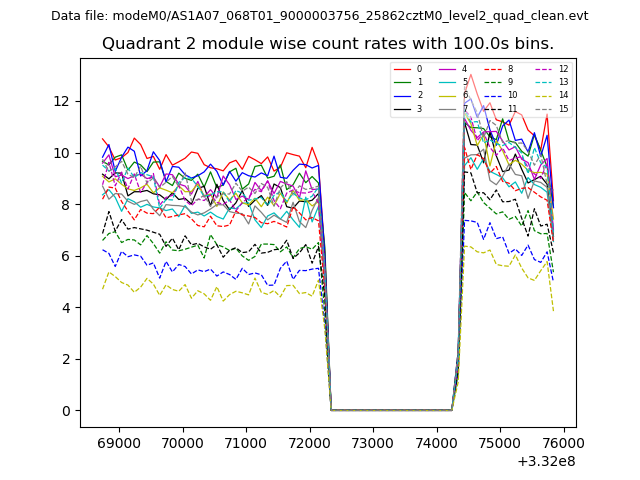
| Module-wise count rates for Quadrant B Data is divided into 100 sec bins |
 |
 |
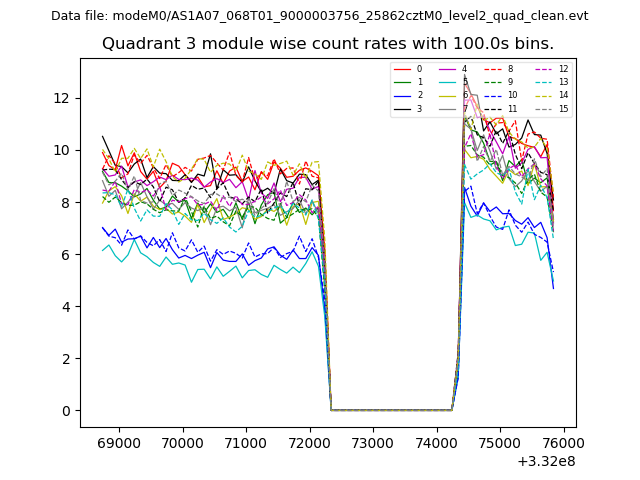
| Module-wise count rates for Quadrant C Data is divided into 100 sec bins |
 |
 |
| Module-wise count rates for Quadrant D Data is divided into 100 sec bins |
 |
 |
| Parameter | Plot |
|---|---|
| CZT HV Monitor | 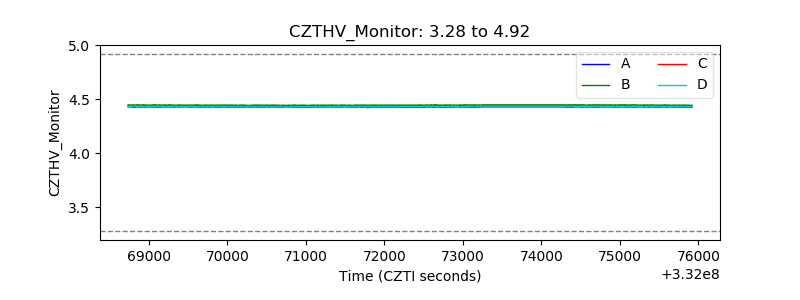 |
| D_VDD | 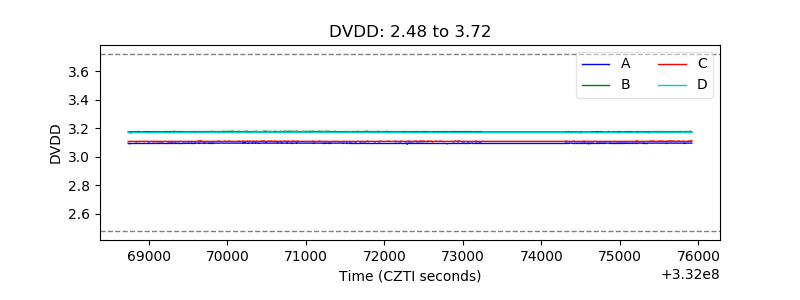 |
| Temperature 1 | 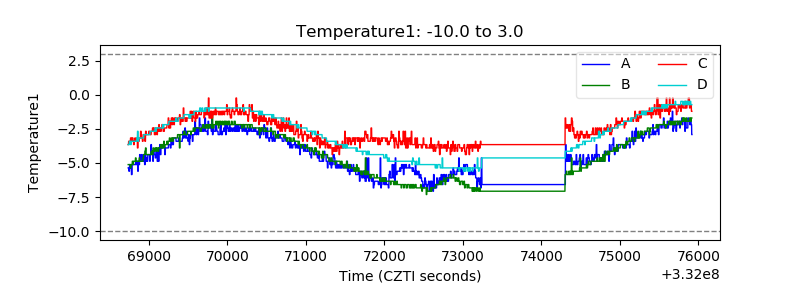 |
| Veto HV Monitor | 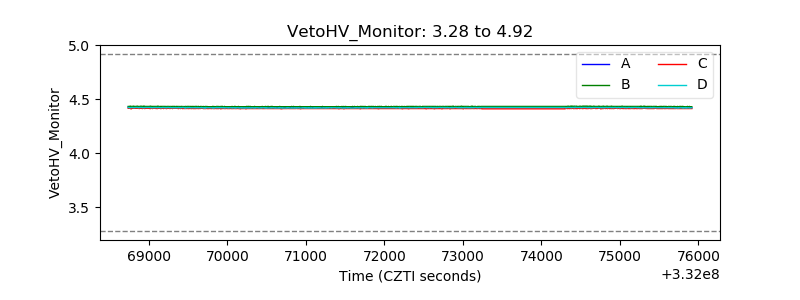 |
| Veto LLD | 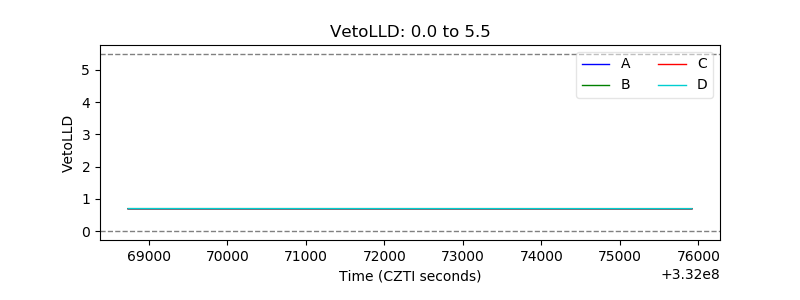 |
| Alpha Counter | 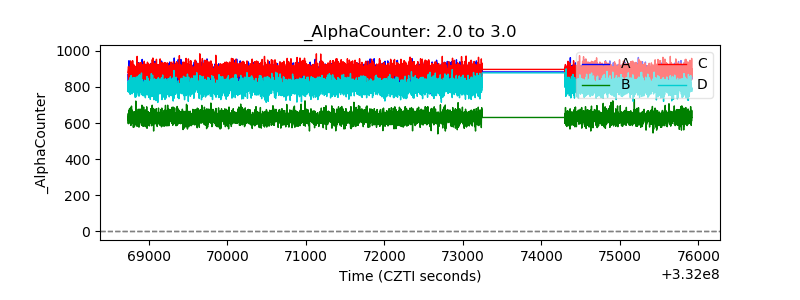 |
| _CPM_Rate |  |
| CZT Counter | 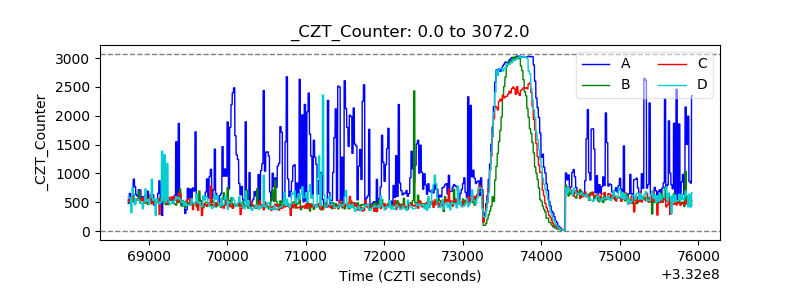 |
| +2.5 Volts monitor | 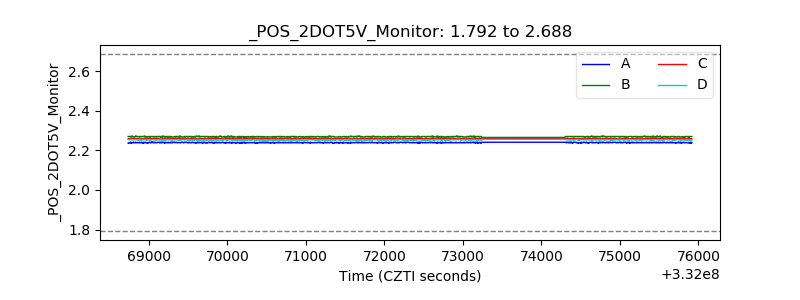 |
| +5 Volts monitor |  |
| _ROLL_ROT | 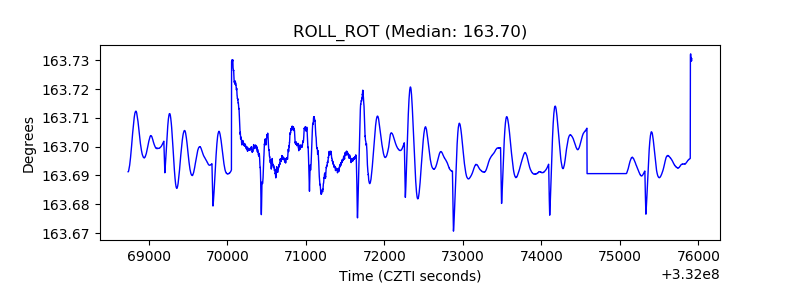 |
| _Roll_DEC | 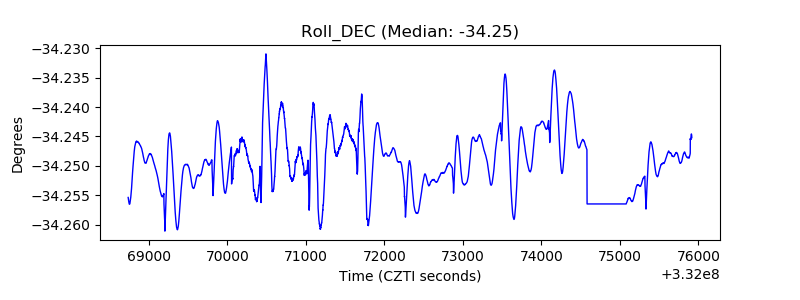 |
| _Roll_RA | 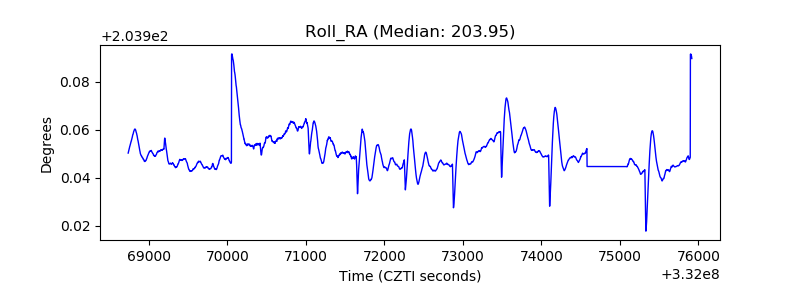 |
| Veto Counter | 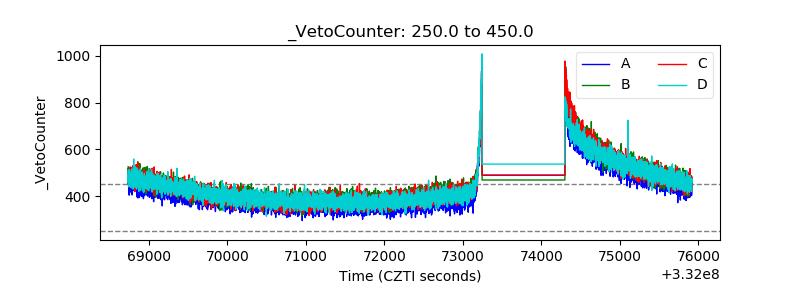 |