| Param | Original file | Final file |
|---|---|---|
| Filename | modeM0/AS1A07_068T01_9000003756_25864cztM0_level2.evt | modeM0/AS1A07_068T01_9000003756_25864cztM0_level2_quad_clean.evt |
| Size (bytes) | 570,456,000 | 99,187,200 |
| Size | 544.0 MB | 94.6 MB |
| Events in quadrant A | 6,350,545 | 642,490 |
| Events in quadrant B | 3,251,404 | 677,854 |
| Events in quadrant C | 2,910,134 | 642,627 |
| Events in quadrant D | 4,373,612 | 637,169 |
| Mode M0 | |||
|---|---|---|---|
| Quadrant | BADHDUFLAG | Total packets | Discarded packets |
| A | 0 | 22950 | 0 |
| B | 0 | 13338 | 0 |
| C | 0 | 12362 | 0 |
| D | 0 | 16963 | 0 |
| Mode M9 | |||
|---|---|---|---|
| Quadrant | BADHDUFLAG | Total packets | Discarded packets |
| A | 0 | 11 | 0 |
| B | 0 | 11 | 0 |
| C | 0 | 11 | 0 |
| D | 0 | 11 | 0 |
| Quadrant | Total seconds | Saturated seconds | Saturation percentage |
|---|---|---|---|
| A | 5769 | 793 | 13.745883% |
| B | 5769 | 128 | 2.218755% |
| C | 5769 | 83 | 1.438724% |
| D | 5769 | 416 | 7.210955% |
Noise dominated data is calculated using 1-second bins in cleaned event files. If a bin has >2000 counts, and if more than 50% of those come from <1% of pixels, then it is considered to be noise-dominated and hence unusable.
| Quadrant | # 1 sec bins | Bins with >0 counts | Bins with >2000 counts | High rate bins dominated by noise | Noise dominated (total time) | Noise dominated (detector-on time) | Marked lightcurve |
|---|---|---|---|---|---|---|---|
| A | 6939 | 5770 | 503 | 503 | 7.25% | 8.72% | 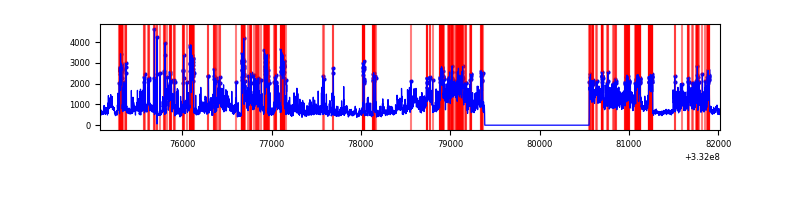 |
| B | 6939 | 5770 | 60 | 60 | 0.86% | 1.04% | 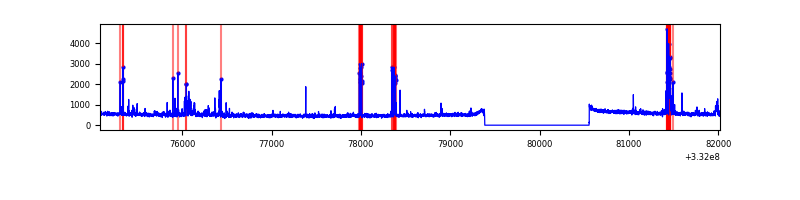 |
| C | 6939 | 5770 | 0 | 0 | 0.00% | 0.00% | 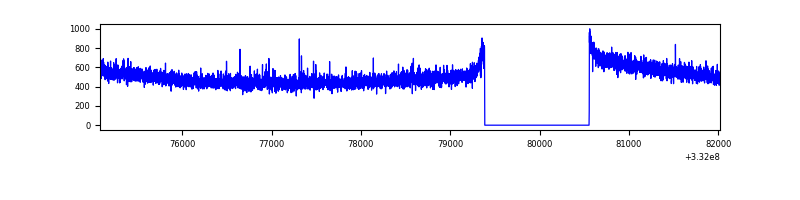 |
| D | 6939 | 5770 | 338 | 338 | 4.87% | 5.86% | 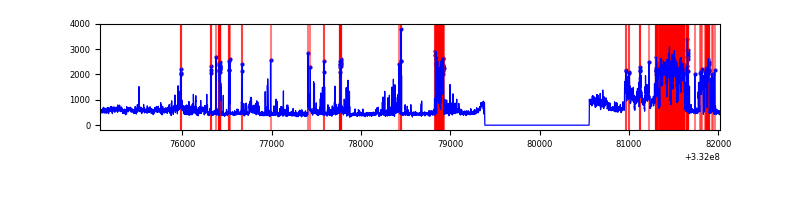 |
Top three noisy pixels from each quadrant. If the there are fewer than three noisy pixels in the level2.evt file, extra rows are filled as -1
| Pixel properties | Quadrant properties | ||||||
|---|---|---|---|---|---|---|---|
| Quadrant | DetID | PixID | Counts | Sigma | Mean | Median | Sigma |
| A | 0 | 13 | 3543316 | 24403.68 | 728 | 716 | 145.2 |
| A | 13 | 254 | 8838 | 55.95 | 728 | 716 | 145.2 |
| A | 0 | 226 | 6333 | 38.69 | 728 | 716 | 145.2 |
| B | 10 | 245 | 246724 | 1756.9 | 736 | 719 | 140.0 |
| B | 10 | 247 | 58160 | 410.23 | 736 | 719 | 140.0 |
| B | 0 | 219 | 37740 | 264.39 | 736 | 719 | 140.0 |
| C | 14 | 238 | 115025 | 692.31 | 708 | 713 | 165.1 |
| C | 3 | 233 | 27314 | 161.1 | 708 | 713 | 165.1 |
| C | 13 | 61 | 4957 | 25.7 | 708 | 713 | 165.1 |
| D | 1 | 52 | 1528889 | 8991.74 | 721 | 705 | 170.0 |
| D | 12 | 233 | 47572 | 275.76 | 721 | 705 | 170.0 |
| D | 7 | 80 | 30970 | 178.08 | 721 | 705 | 170.0 |
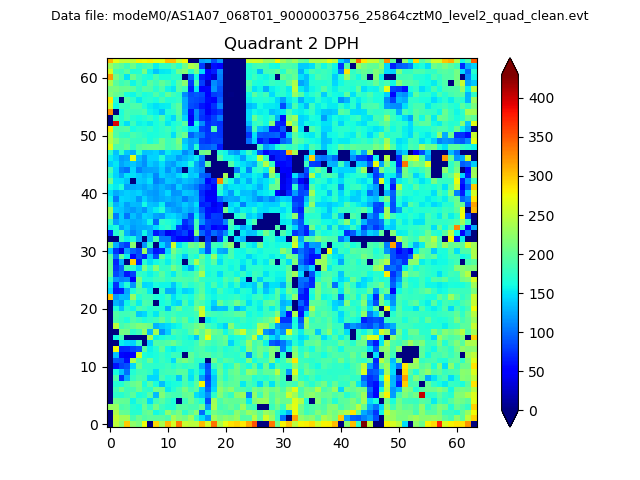
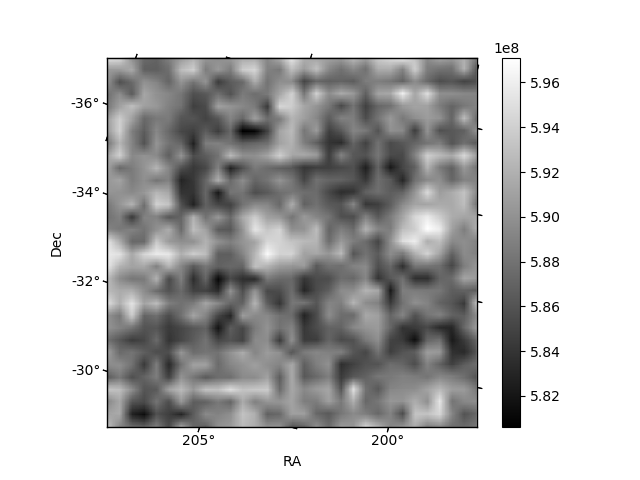
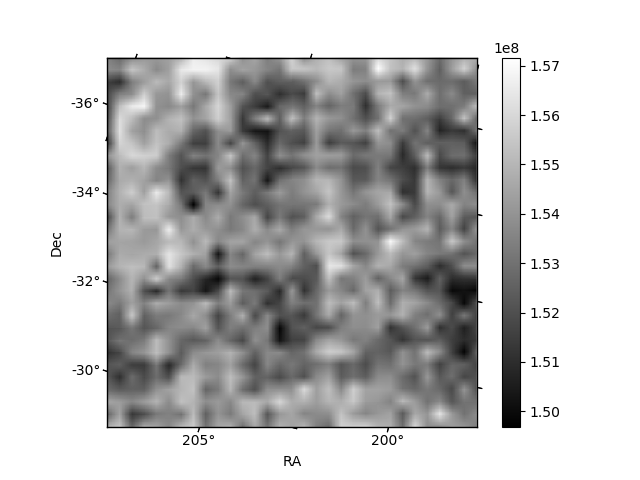
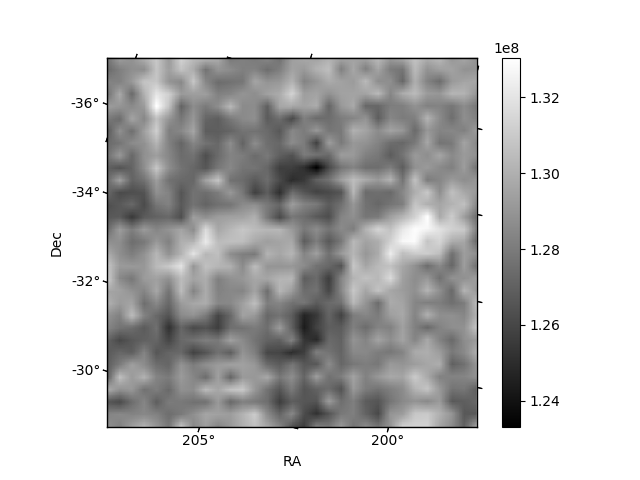
Histogram calculated using DETX and DETY for each event in the final _common_clean file
| Quadrant A | 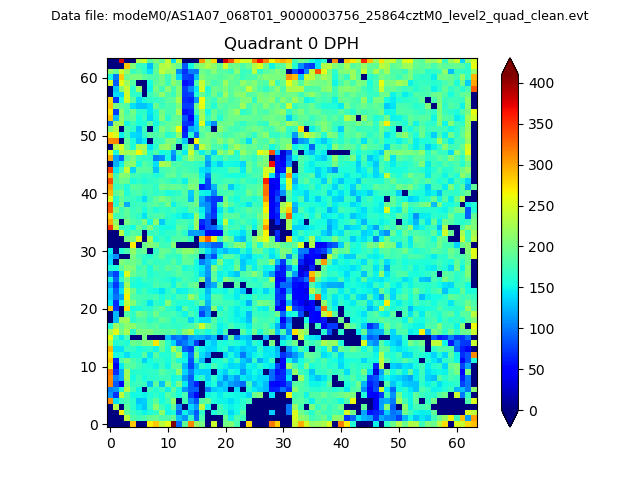 |
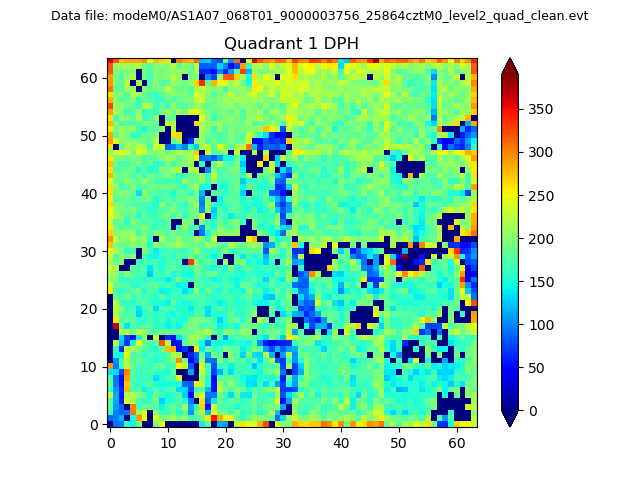 |
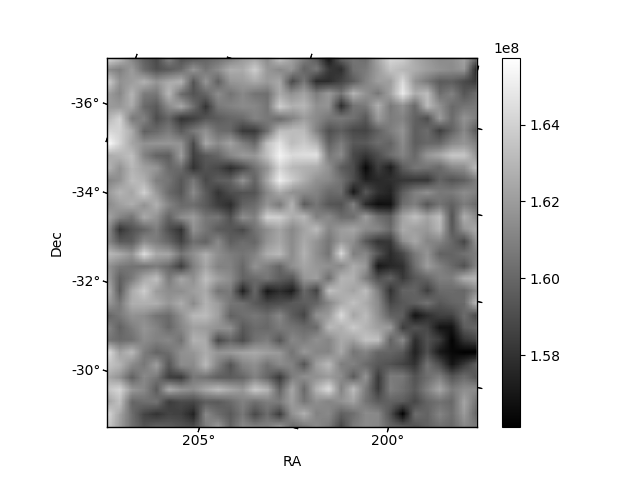
Quadrant B |
|---|---|---|---|
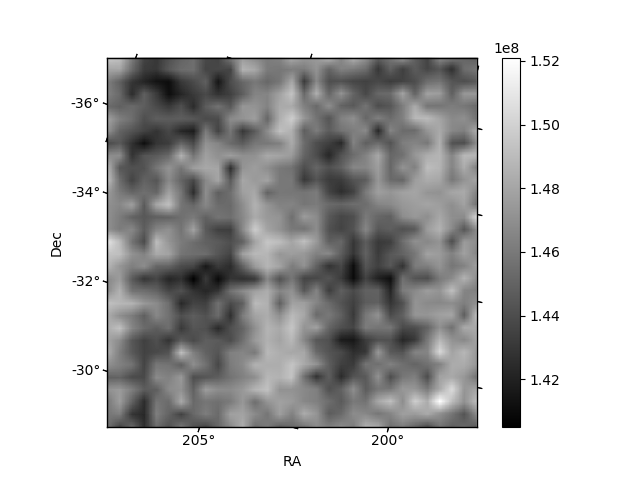
| Quadrant D | 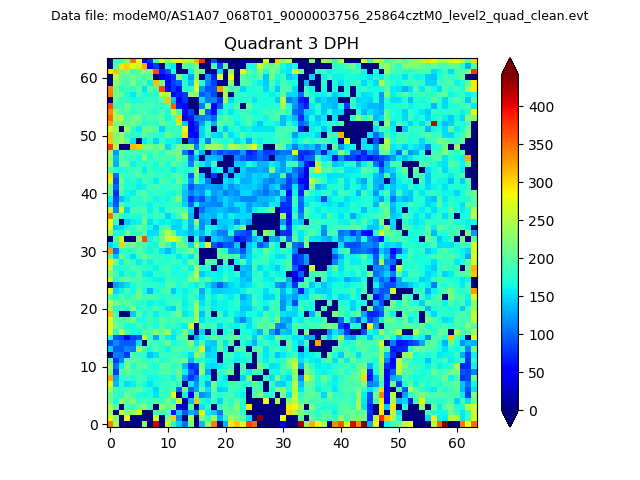 |
 |
Quadrant C |
| Plot type | Count rate plots | Images |
|---|---|---|
| Comparison with Poisson distribution Blue bars denote a histogram of data divided into 1 sec bins. Red curve is a Poisson curve with rate = median count rate of data. |
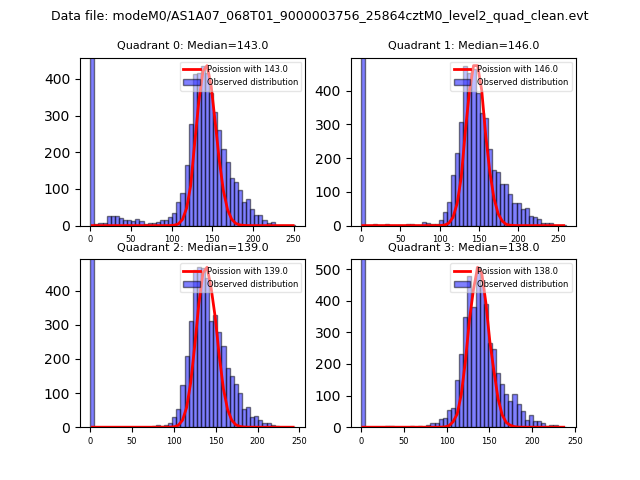 |
 |
| Quadrant-wise count rates Data is divided into 100 sec bins |
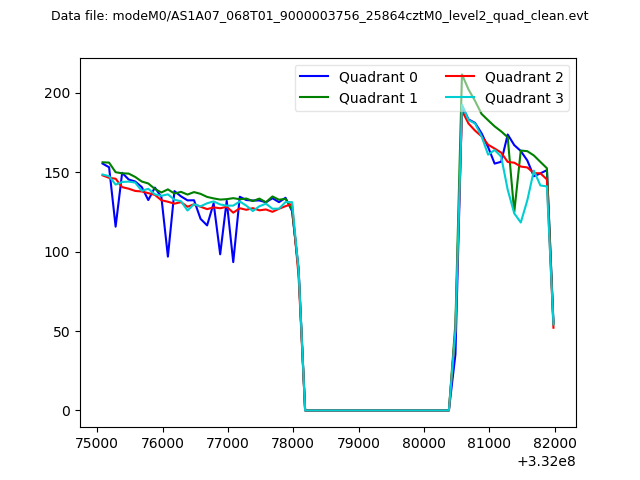 |
|
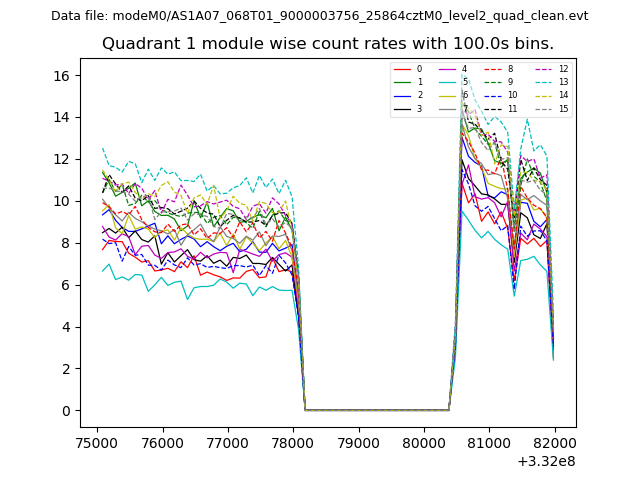
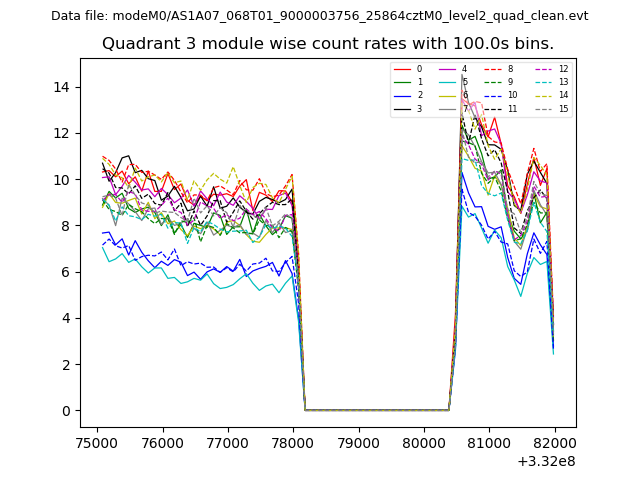
| Module-wise count rates for Quadrant A Data is divided into 100 sec bins |
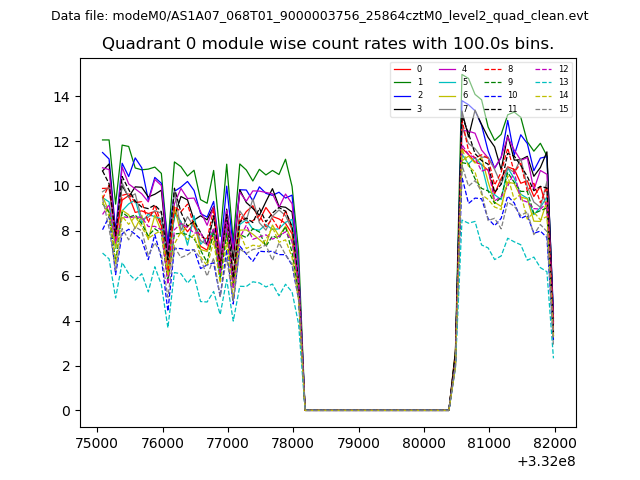 |
 |
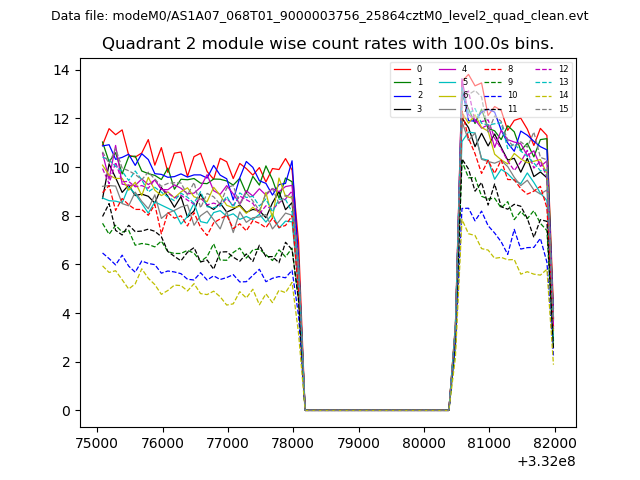
| Module-wise count rates for Quadrant B Data is divided into 100 sec bins |
 |
 |
| Module-wise count rates for Quadrant C Data is divided into 100 sec bins |
 |
 |
| Module-wise count rates for Quadrant D Data is divided into 100 sec bins |
 |
 |
| Parameter | Plot |
|---|---|
| CZT HV Monitor | 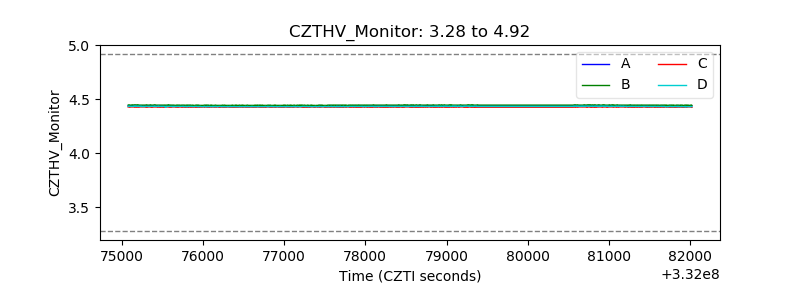 |
| D_VDD | 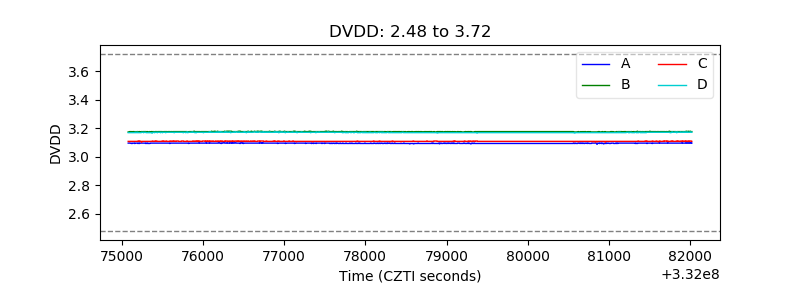 |
| Temperature 1 | 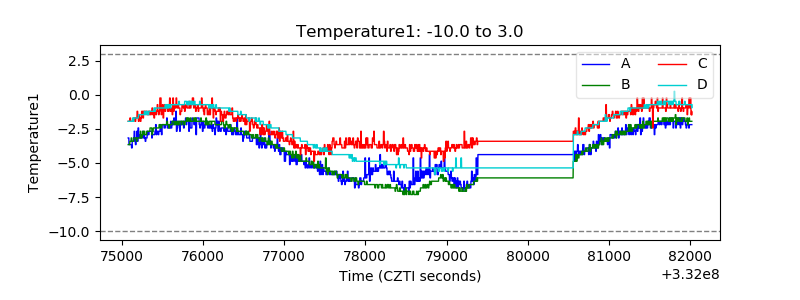 |
| Veto HV Monitor |  |
| Veto LLD |  |
| Alpha Counter | 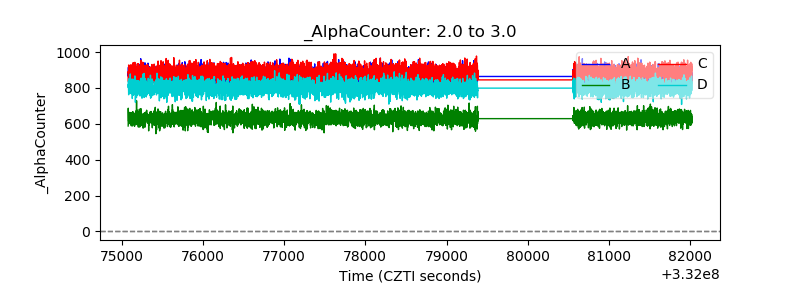 |
| _CPM_Rate | 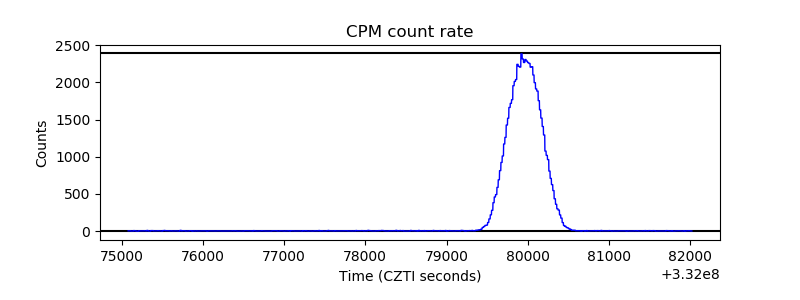 |
| CZT Counter | 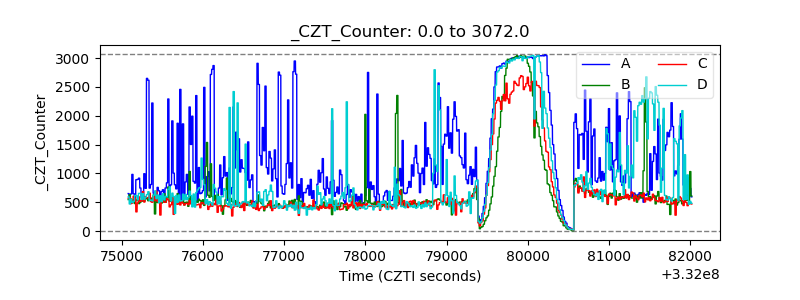 |
| +2.5 Volts monitor |  |
| +5 Volts monitor |  |
| _ROLL_ROT | 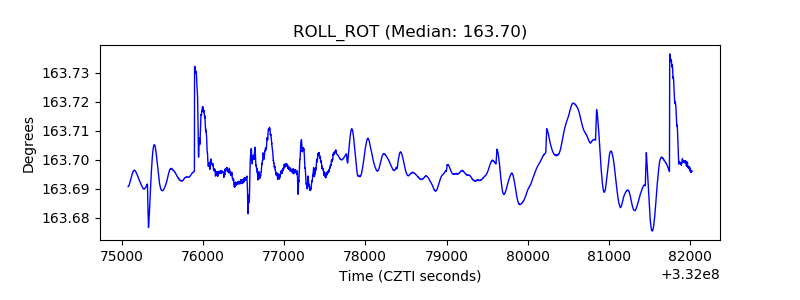 |
| _Roll_DEC | 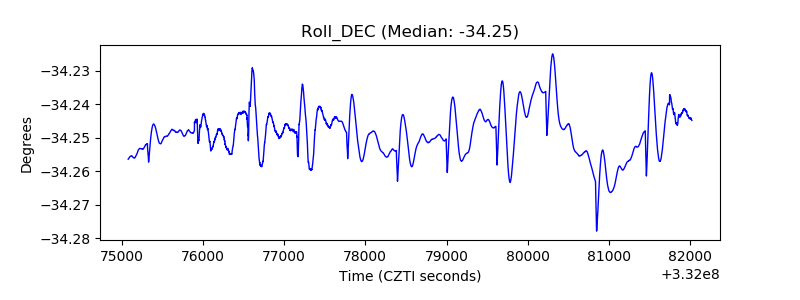 |
| _Roll_RA | 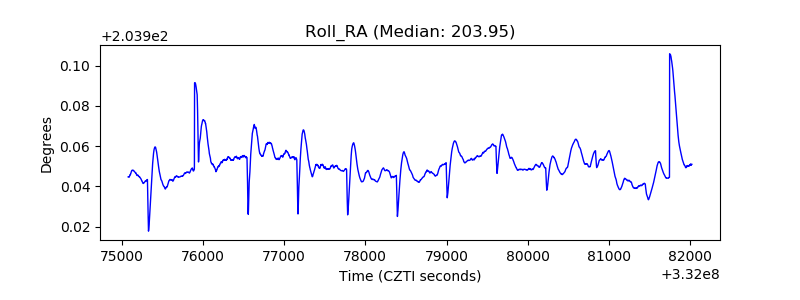 |
| Veto Counter | 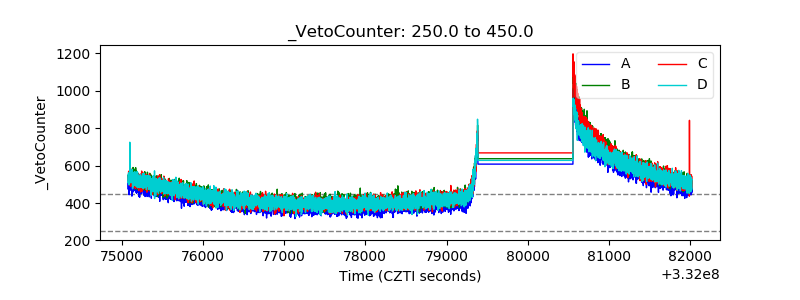 |