| Param | Original file | Final file |
|---|---|---|
| Filename | modeM0/AS1A07_068T01_9000003756_25865cztM0_level2.evt | modeM0/AS1A07_068T01_9000003756_25865cztM0_level2_quad_clean.evt |
| Size (bytes) | 652,305,600 | 109,987,200 |
| Size | 622.1 MB | 104.9 MB |
| Events in quadrant A | 6,871,770 | 710,084 |
| Events in quadrant B | 3,580,773 | 765,193 |
| Events in quadrant C | 3,401,289 | 714,858 |
| Events in quadrant D | 5,472,294 | 697,806 |
| Mode M0 | |||
|---|---|---|---|
| Quadrant | BADHDUFLAG | Total packets | Discarded packets |
| A | 0 | 24691 | 0 |
| B | 0 | 14736 | 0 |
| C | 0 | 14198 | 0 |
| D | 0 | 20480 | 0 |
| Mode M9 | |||
|---|---|---|---|
| Quadrant | BADHDUFLAG | Total packets | Discarded packets |
| A | 0 | 13 | 0 |
| B | 0 | 13 | 0 |
| C | 0 | 13 | 0 |
| D | 0 | 13 | 0 |
| Quadrant | Total seconds | Saturated seconds | Saturation percentage |
|---|---|---|---|
| A | 6345 | 1094 | 17.241923% |
| B | 6345 | 138 | 2.174941% |
| C | 6345 | 137 | 2.159180% |
| D | 6345 | 618 | 9.739953% |
Noise dominated data is calculated using 1-second bins in cleaned event files. If a bin has >2000 counts, and if more than 50% of those come from <1% of pixels, then it is considered to be noise-dominated and hence unusable.
| Quadrant | # 1 sec bins | Bins with >0 counts | Bins with >2000 counts | High rate bins dominated by noise | Noise dominated (total time) | Noise dominated (detector-on time) | Marked lightcurve |
|---|---|---|---|---|---|---|---|
| A | 7580 | 6346 | 703 | 703 | 9.27% | 11.08% | 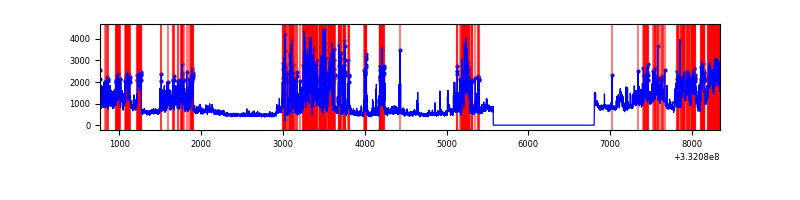 |
| B | 7580 | 6346 | 32 | 32 | 0.42% | 0.50% | 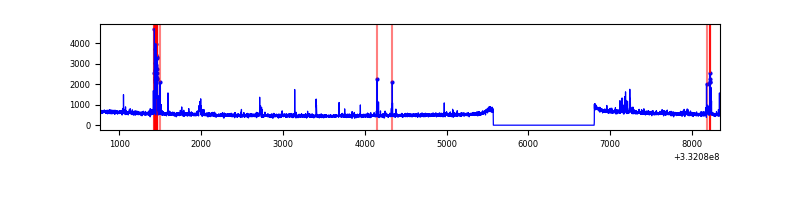 |
| C | 7580 | 6346 | 4 | 4 | 0.05% | 0.06% | 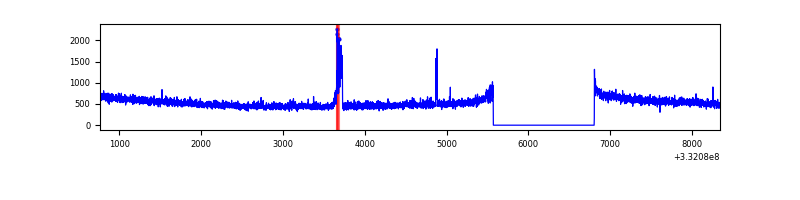 |
| D | 7580 | 6346 | 553 | 553 | 7.30% | 8.71% | 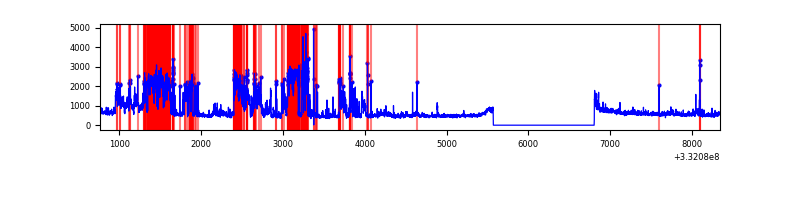 |
Top three noisy pixels from each quadrant. If the there are fewer than three noisy pixels in the level2.evt file, extra rows are filled as -1
| Pixel properties | Quadrant properties | ||||||
|---|---|---|---|---|---|---|---|
| Quadrant | DetID | PixID | Counts | Sigma | Mean | Median | Sigma |
| A | 0 | 13 | 3673110 | 22363.71 | 829 | 816 | 164.2 |
| A | 13 | 254 | 9172 | 50.89 | 829 | 816 | 164.2 |
| A | 0 | 226 | 7127 | 38.43 | 829 | 816 | 164.2 |
| B | 10 | 245 | 174993 | 1100.65 | 845 | 826 | 158.2 |
| B | 0 | 219 | 52903 | 329.1 | 845 | 826 | 158.2 |
| B | 10 | 247 | 23700 | 144.55 | 845 | 826 | 158.2 |
| C | 14 | 238 | 132186 | 707.27 | 806 | 811 | 185.7 |
| C | 7 | 238 | 69605 | 370.36 | 806 | 811 | 185.7 |
| C | 3 | 233 | 52348 | 277.45 | 806 | 811 | 185.7 |
| D | 1 | 52 | 2276306 | 11615.97 | 821 | 802 | 195.9 |
| D | 2 | 234 | 25516 | 126.16 | 821 | 802 | 195.9 |
| D | 12 | 233 | 25398 | 125.55 | 821 | 802 | 195.9 |
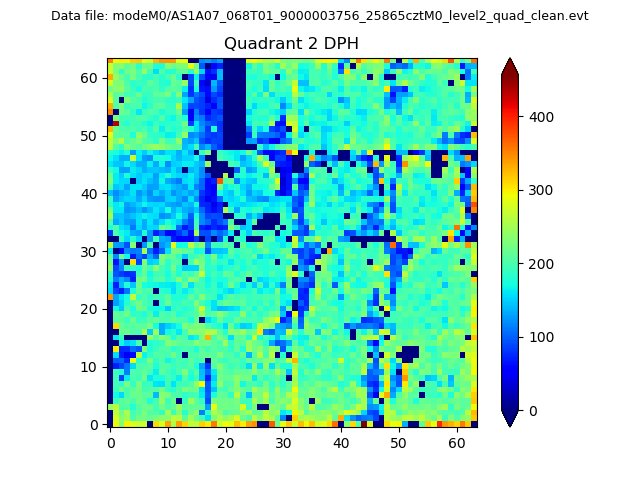
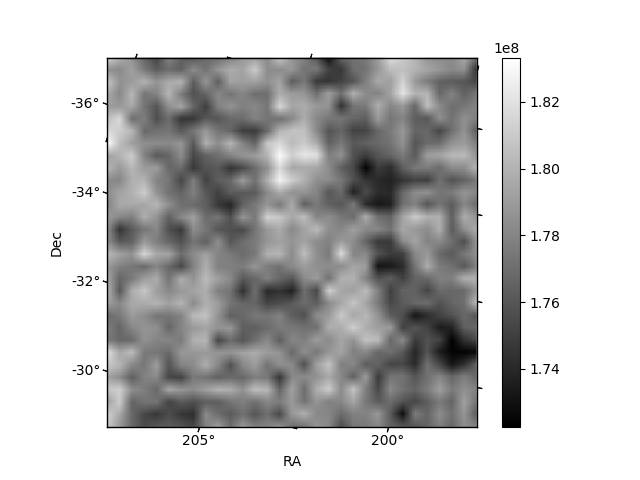
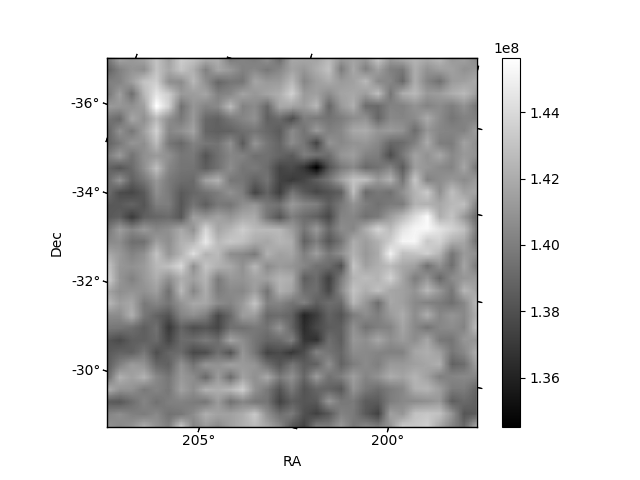
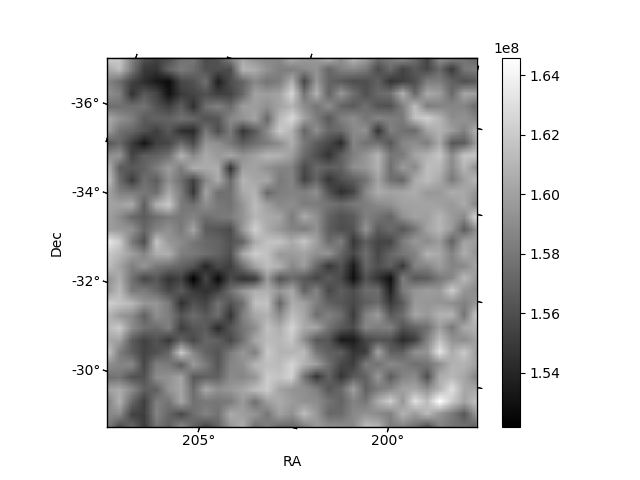
Histogram calculated using DETX and DETY for each event in the final _common_clean file
| Quadrant A | 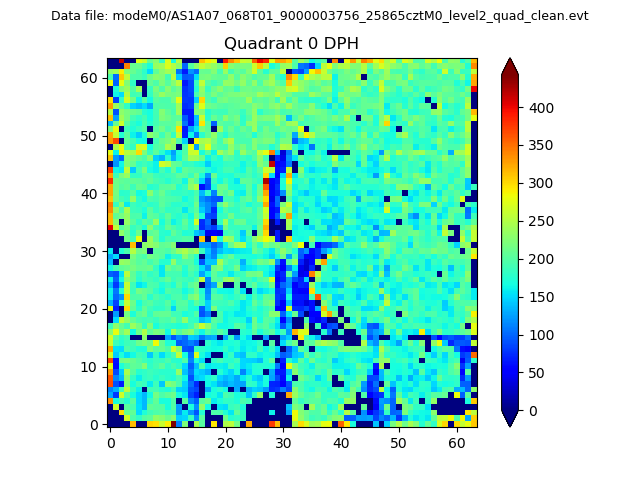 |
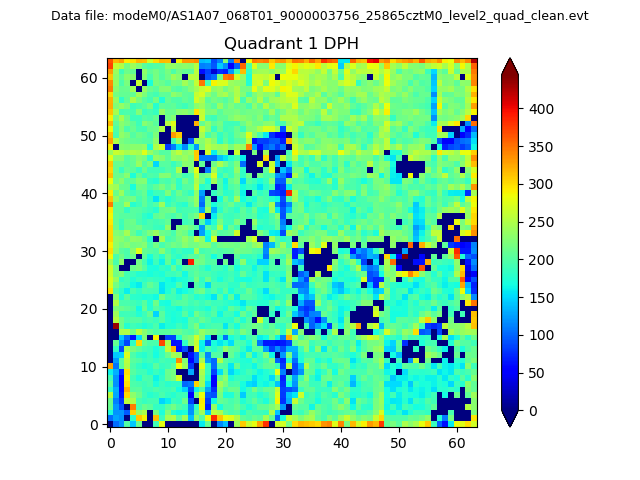 |
Quadrant B |
|---|---|---|---|
| Quadrant D | 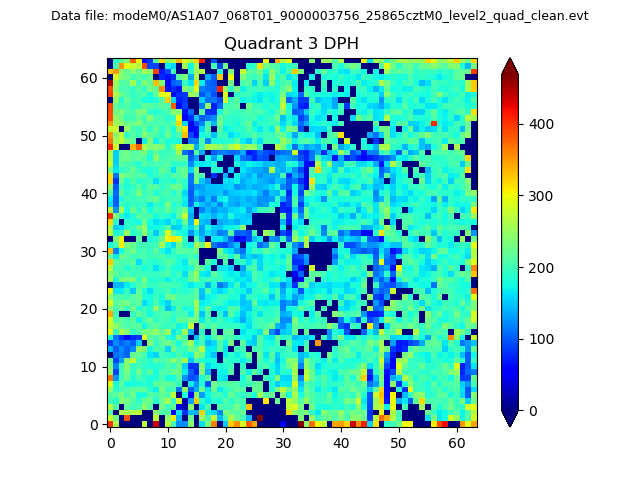 |
 |
Quadrant C |
| Plot type | Count rate plots | Images |
|---|---|---|
| Comparison with Poisson distribution Blue bars denote a histogram of data divided into 1 sec bins. Red curve is a Poisson curve with rate = median count rate of data. |
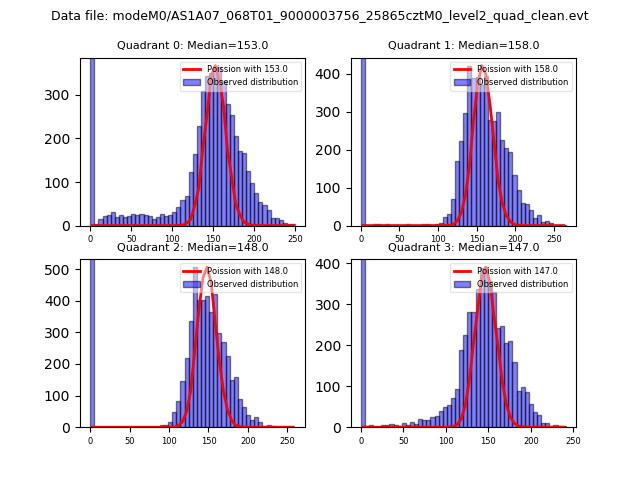 |
 |
| Quadrant-wise count rates Data is divided into 100 sec bins |
 |
|
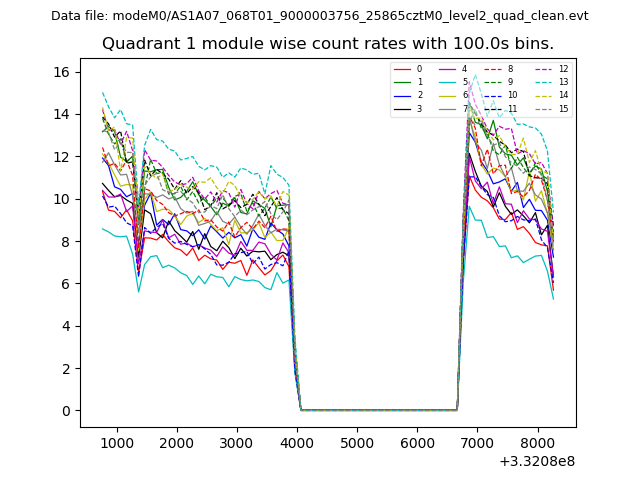
| Module-wise count rates for Quadrant A Data is divided into 100 sec bins |
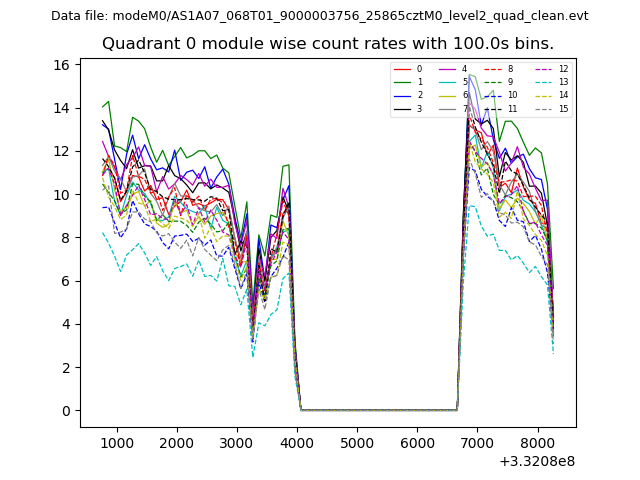 |
 |
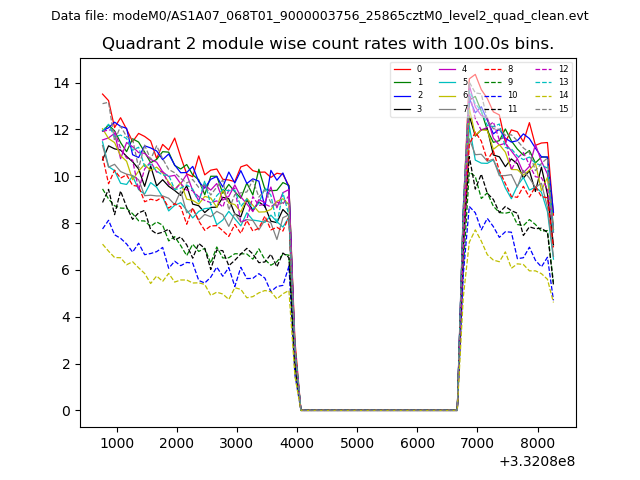
| Module-wise count rates for Quadrant B Data is divided into 100 sec bins |
 |
 |
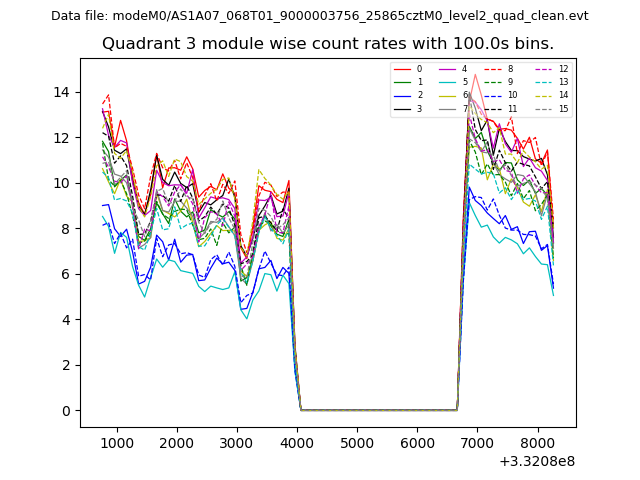
| Module-wise count rates for Quadrant C Data is divided into 100 sec bins |
 |
 |
| Module-wise count rates for Quadrant D Data is divided into 100 sec bins |
 |
 |
| Parameter | Plot |
|---|---|
| CZT HV Monitor | 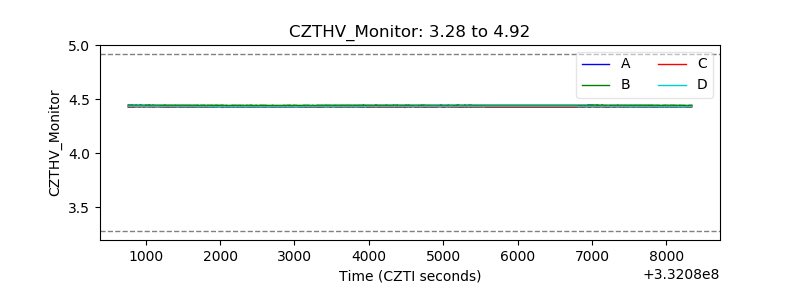 |
| D_VDD | 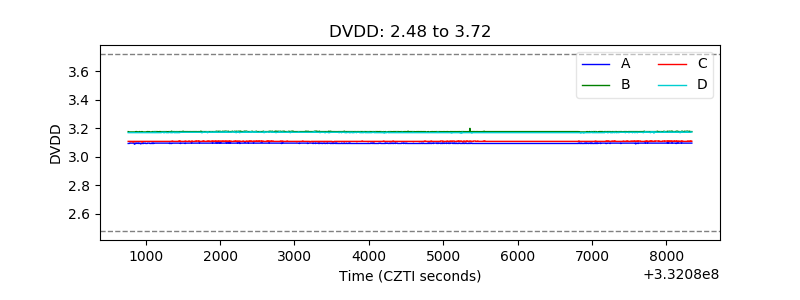 |
| Temperature 1 | 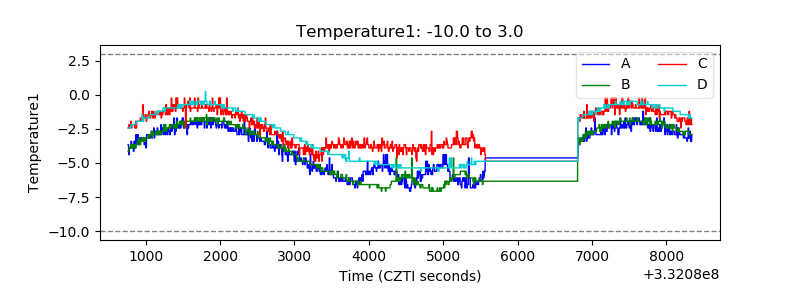 |
| Veto HV Monitor |  |
| Veto LLD | 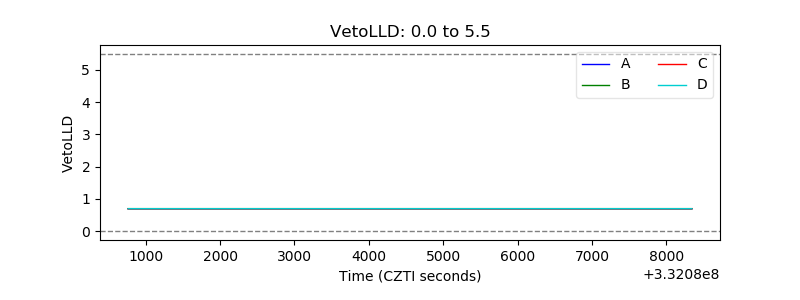 |
| Alpha Counter | 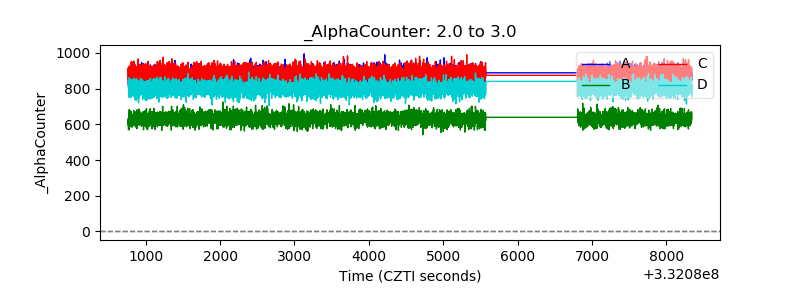 |
| _CPM_Rate | 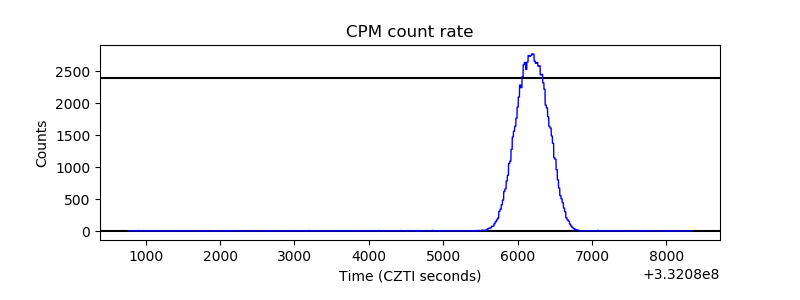 |
| CZT Counter | 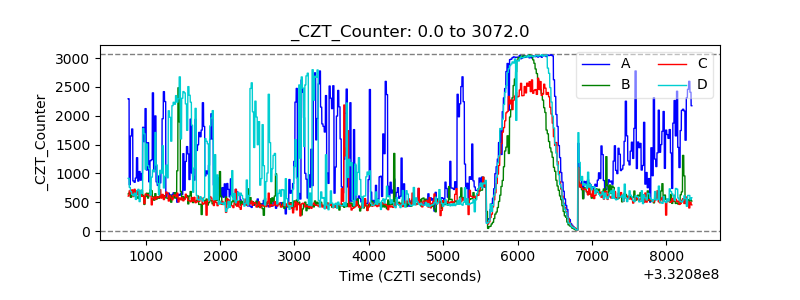 |
| +2.5 Volts monitor |  |
| +5 Volts monitor |  |
| _ROLL_ROT | 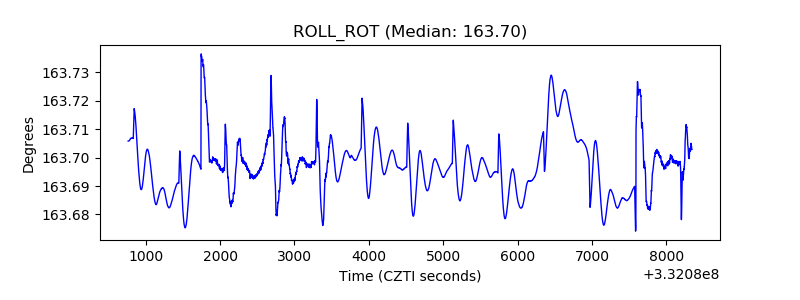 |
| _Roll_DEC | 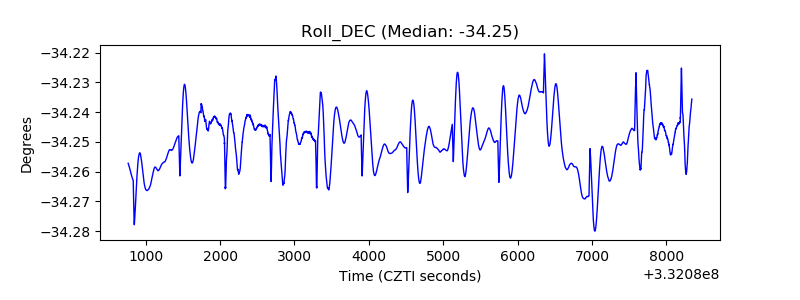 |
| _Roll_RA | 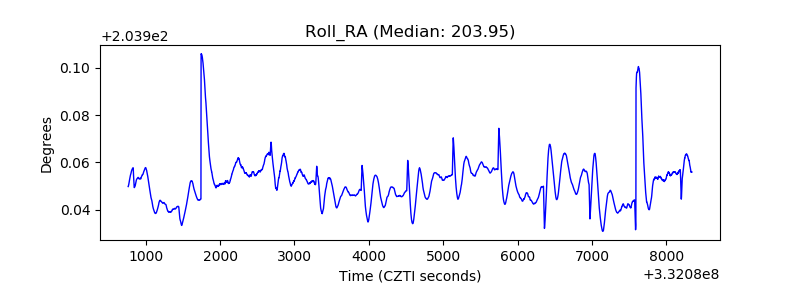 |
| Veto Counter | 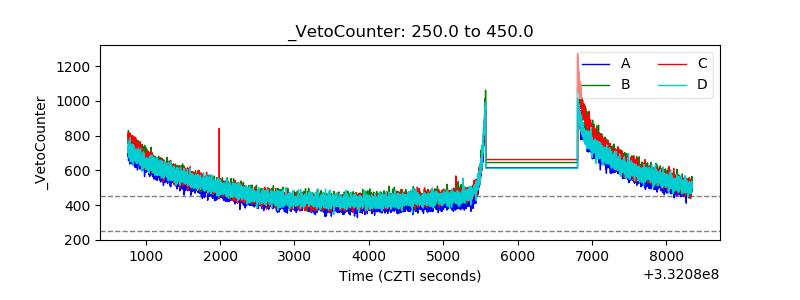 |