| Param | Original file | Final file |
|---|---|---|
| Filename | modeM0/AS1A07_068T01_9000003756_25866cztM0_level2.evt | modeM0/AS1A07_068T01_9000003756_25866cztM0_level2_quad_clean.evt |
| Size (bytes) | 605,695,680 | 99,961,920 |
| Size | 577.6 MB | 95.3 MB |
| Events in quadrant A | 6,766,284 | 654,860 |
| Events in quadrant B | 3,392,290 | 680,501 |
| Events in quadrant C | 3,181,228 | 632,229 |
| Events in quadrant D | 4,589,965 | 632,313 |
| Mode M0 | |||
|---|---|---|---|
| Quadrant | BADHDUFLAG | Total packets | Discarded packets |
| A | 0 | 24452 | 0 |
| B | 0 | 13947 | 0 |
| C | 0 | 13213 | 0 |
| D | 0 | 17765 | 0 |
| Mode M9 | |||
|---|---|---|---|
| Quadrant | BADHDUFLAG | Total packets | Discarded packets |
| A | 0 | 13 | 0 |
| B | 0 | 13 | 0 |
| C | 0 | 13 | 0 |
| D | 0 | 13 | 0 |
| Quadrant | Total seconds | Saturated seconds | Saturation percentage |
|---|---|---|---|
| A | 6114 | 903 | 14.769382% |
| B | 6114 | 103 | 1.684658% |
| C | 6115 | 94 | 1.537204% |
| D | 6114 | 136 | 2.224403% |
Noise dominated data is calculated using 1-second bins in cleaned event files. If a bin has >2000 counts, and if more than 50% of those come from <1% of pixels, then it is considered to be noise-dominated and hence unusable.
| Quadrant | # 1 sec bins | Bins with >0 counts | Bins with >2000 counts | High rate bins dominated by noise | Noise dominated (total time) | Noise dominated (detector-on time) | Marked lightcurve |
|---|---|---|---|---|---|---|---|
| A | 7429 | 6115 | 696 | 696 | 9.37% | 11.38% | 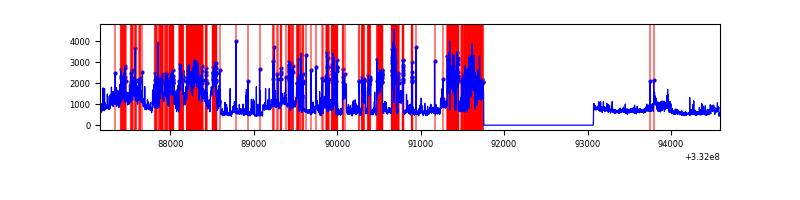 |
| B | 7429 | 6115 | 11 | 11 | 0.15% | 0.18% | 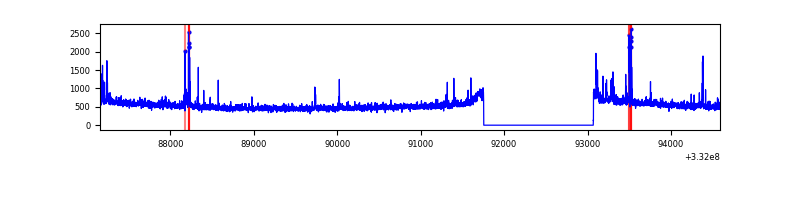 |
| C | 7430 | 6116 | 0 | 0 | 0.00% | 0.00% | 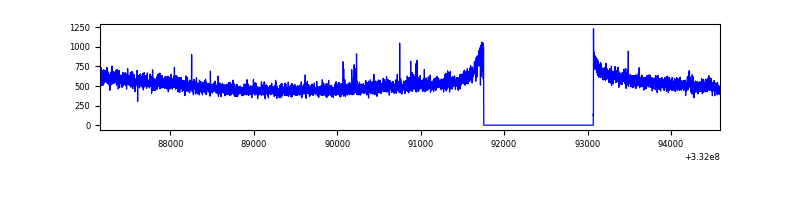 |
| D | 7429 | 6115 | 158 | 158 | 2.13% | 2.58% | 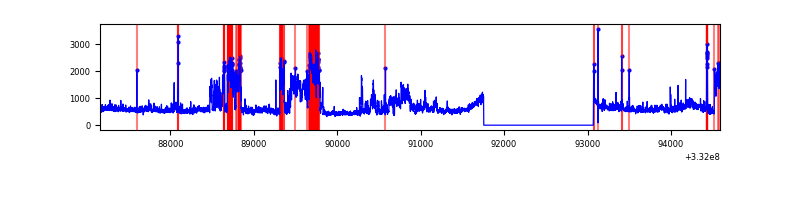 |
Top three noisy pixels from each quadrant. If the there are fewer than three noisy pixels in the level2.evt file, extra rows are filled as -1
| Pixel properties | Quadrant properties | ||||||
|---|---|---|---|---|---|---|---|
| Quadrant | DetID | PixID | Counts | Sigma | Mean | Median | Sigma |
| A | 0 | 13 | 3743054 | 23928.64 | 784 | 772 | 156.4 |
| A | 13 | 254 | 9001 | 52.62 | 784 | 772 | 156.4 |
| A | 0 | 226 | 6690 | 37.84 | 784 | 772 | 156.4 |
| B | 10 | 245 | 125385 | 815.39 | 813 | 796 | 152.8 |
| B | 0 | 219 | 49840 | 320.97 | 813 | 796 | 152.8 |
| B | 12 | 111 | 17570 | 109.78 | 813 | 796 | 152.8 |
| C | 14 | 238 | 126354 | 704.37 | 770 | 775 | 178.3 |
| C | 3 | 233 | 50563 | 279.26 | 770 | 775 | 178.3 |
| C | 13 | 61 | 5332 | 25.56 | 770 | 775 | 178.3 |
| D | 1 | 52 | 1439407 | 7628.46 | 791 | 771 | 188.6 |
| D | 7 | 80 | 87364 | 459.16 | 791 | 771 | 188.6 |
| D | 2 | 234 | 24677 | 126.76 | 791 | 771 | 188.6 |
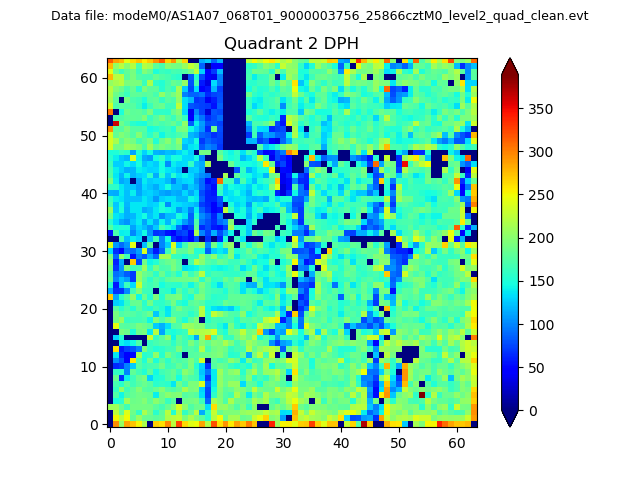
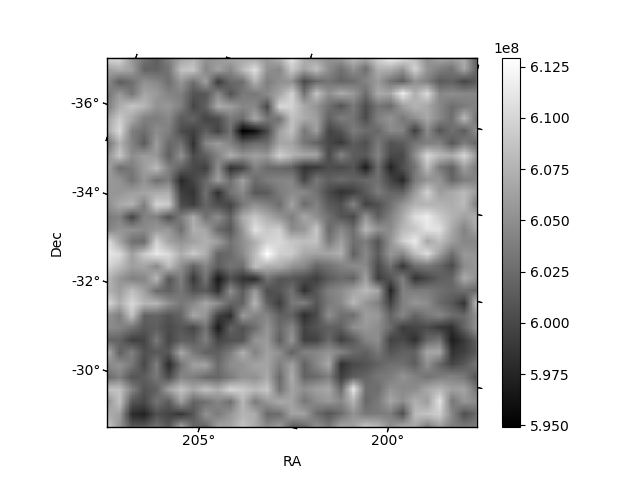
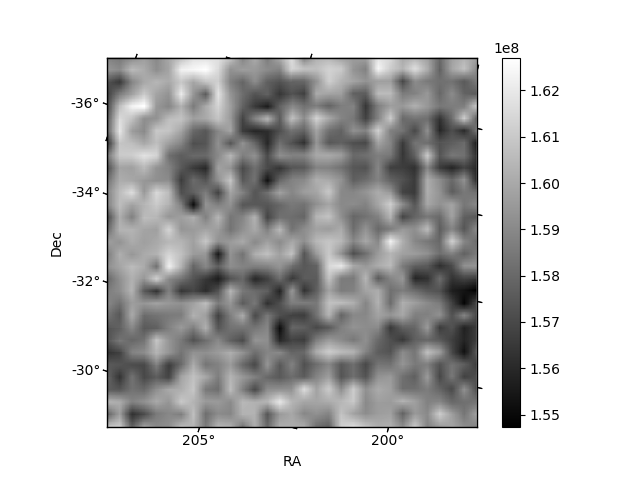
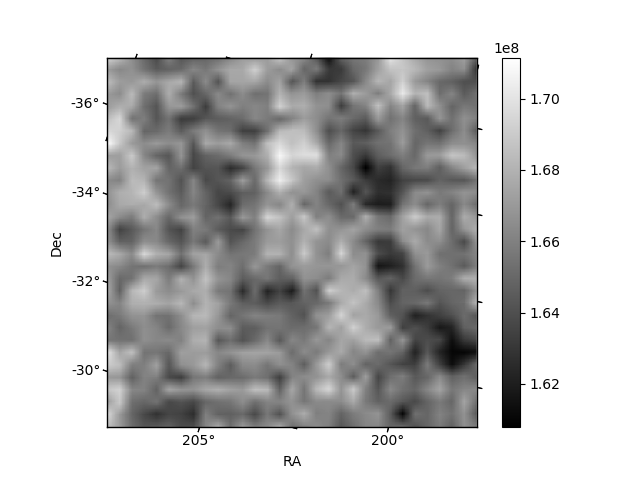
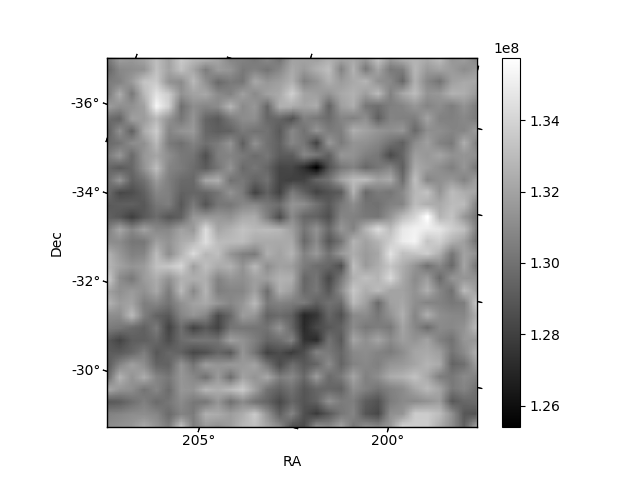
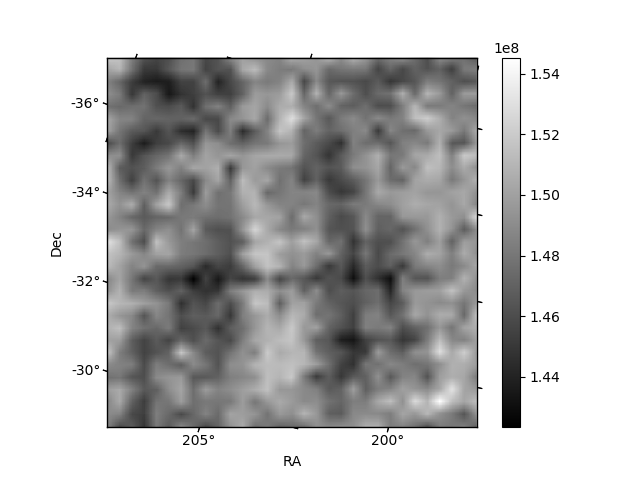
Histogram calculated using DETX and DETY for each event in the final _common_clean file
| Quadrant A | 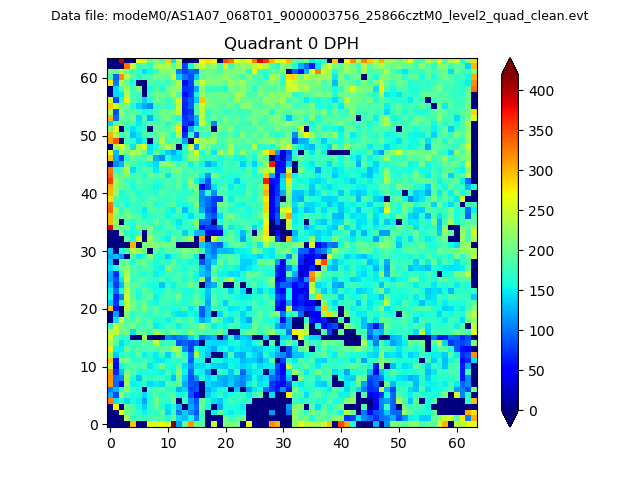 |
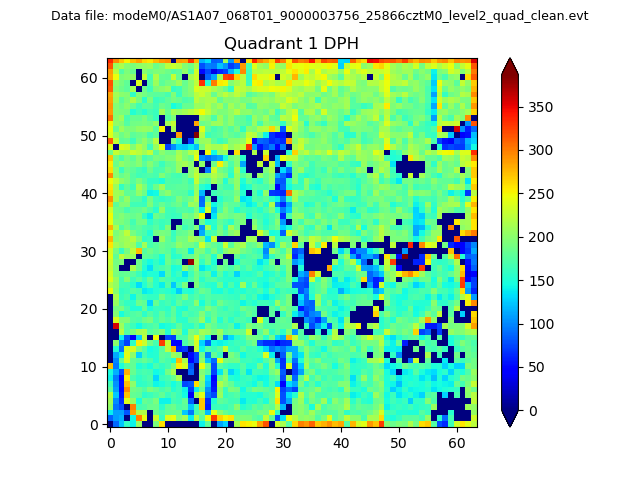 |
Quadrant B |
|---|---|---|---|
| Quadrant D | 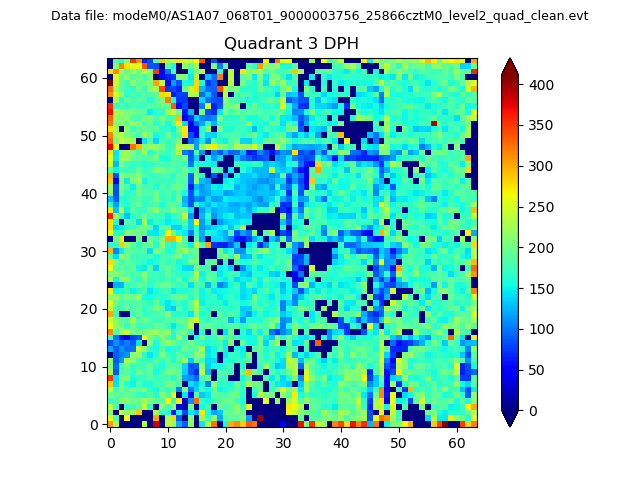 |
 |
Quadrant C |
| Plot type | Count rate plots | Images |
|---|---|---|
| Comparison with Poisson distribution Blue bars denote a histogram of data divided into 1 sec bins. Red curve is a Poisson curve with rate = median count rate of data. |
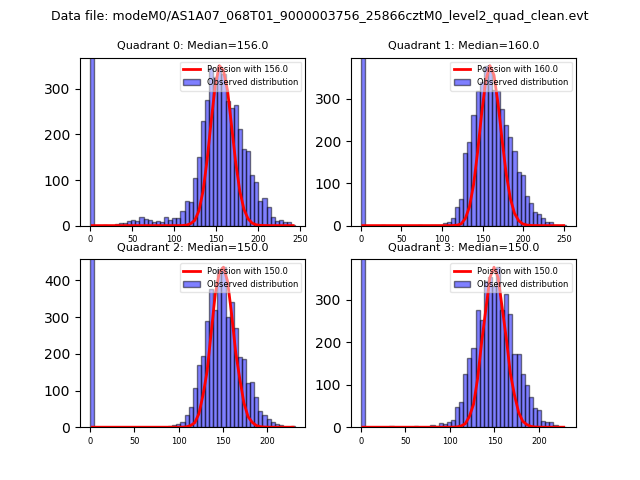 |
 |
| Quadrant-wise count rates Data is divided into 100 sec bins |
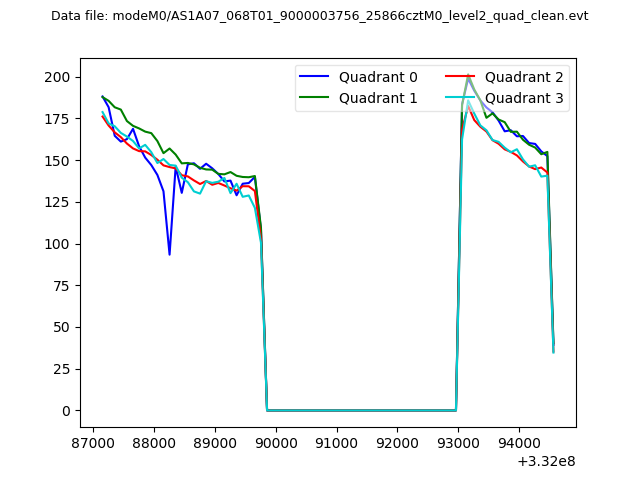 |
|
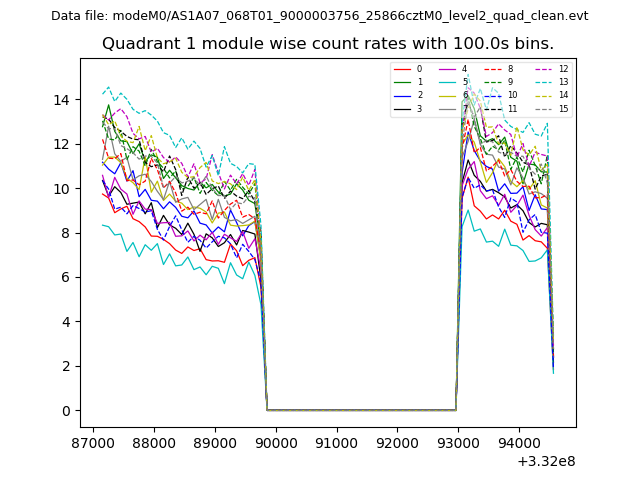
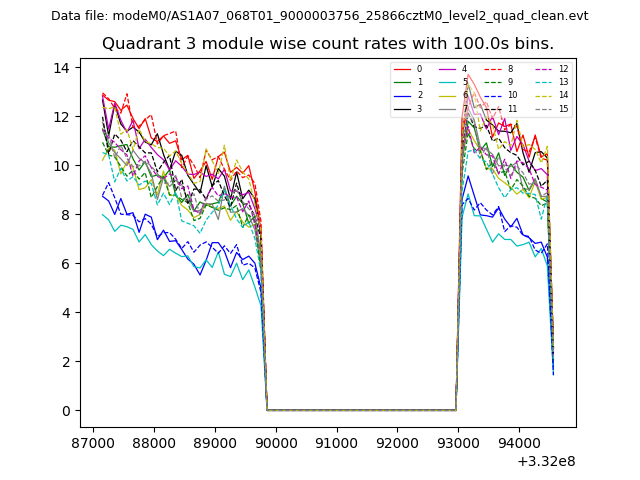
| Module-wise count rates for Quadrant A Data is divided into 100 sec bins |
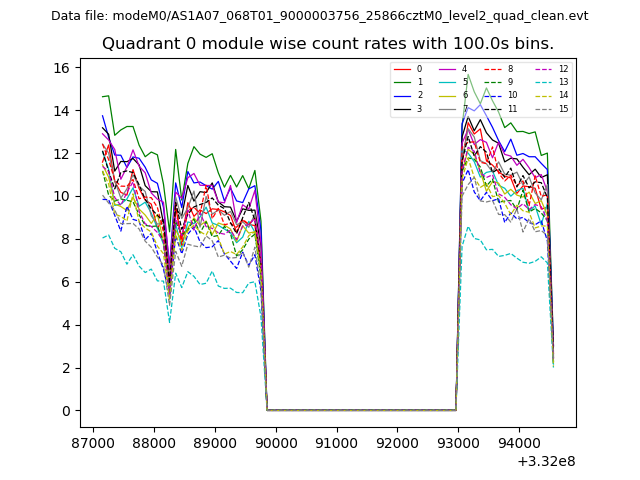 |
 |
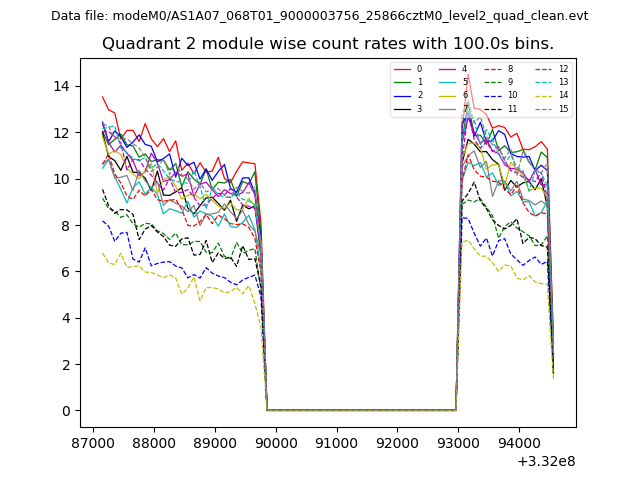
| Module-wise count rates for Quadrant B Data is divided into 100 sec bins |
 |
 |
| Module-wise count rates for Quadrant C Data is divided into 100 sec bins |
 |
 |
| Module-wise count rates for Quadrant D Data is divided into 100 sec bins |
 |
 |
| Parameter | Plot |
|---|---|
| CZT HV Monitor | 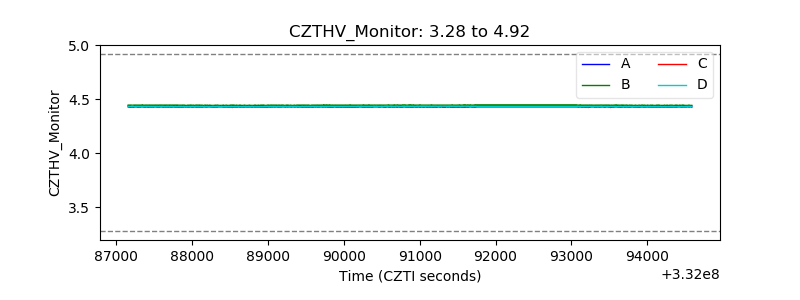 |
| D_VDD | 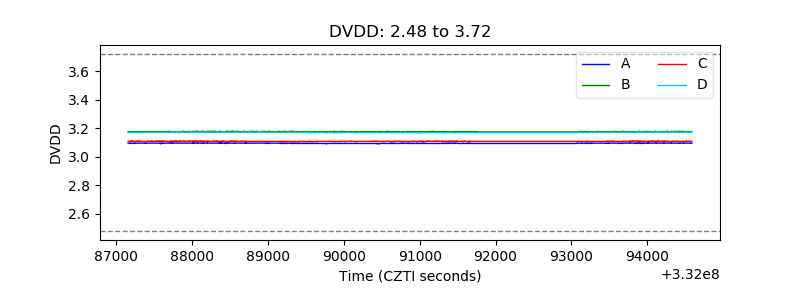 |
| Temperature 1 | 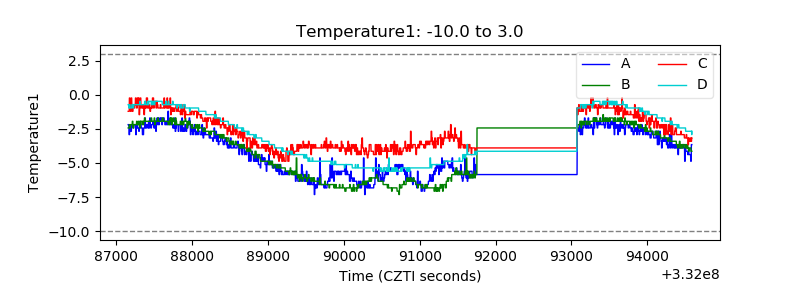 |
| Veto HV Monitor | 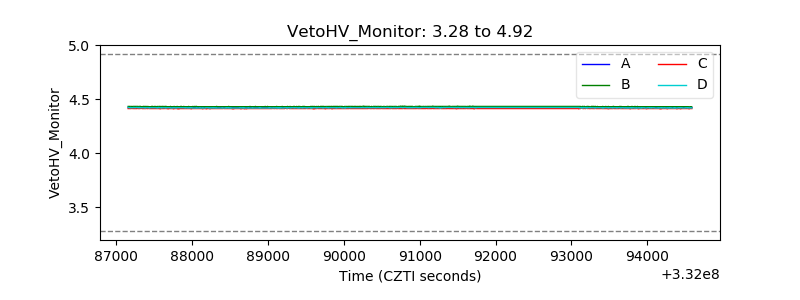 |
| Veto LLD | 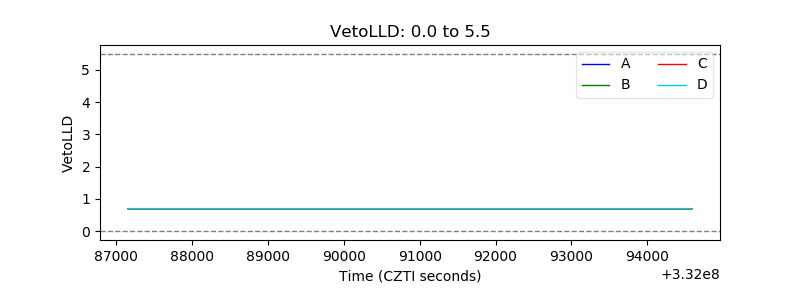 |
| Alpha Counter | 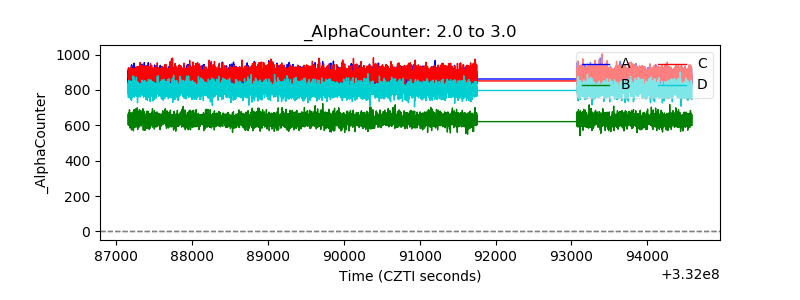 |
| _CPM_Rate |  |
| CZT Counter | 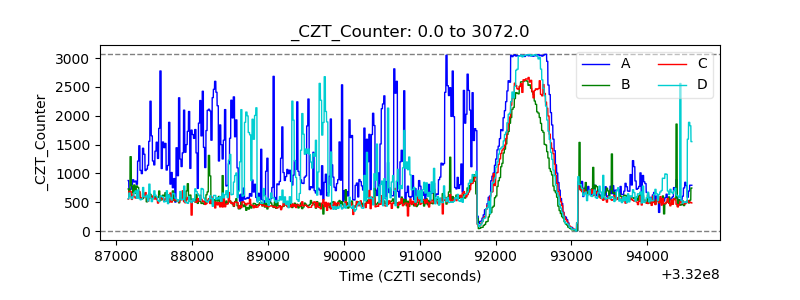 |
| +2.5 Volts monitor | 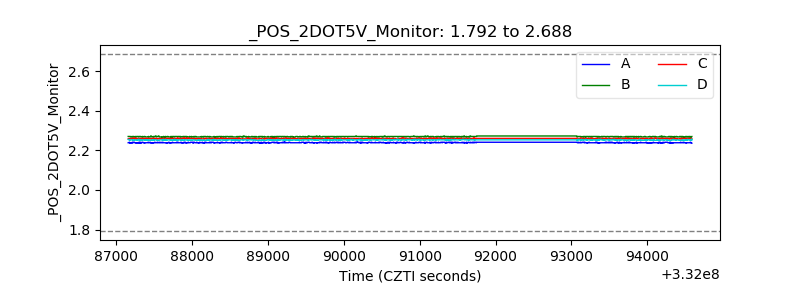 |
| +5 Volts monitor | 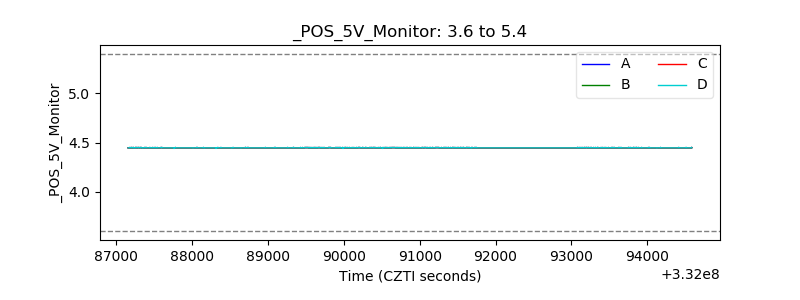 |
| _ROLL_ROT | 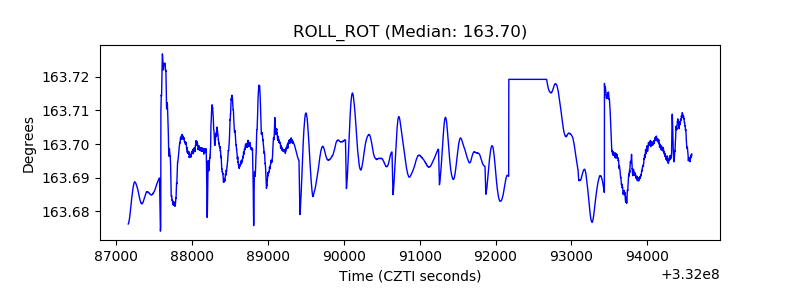 |
| _Roll_DEC | 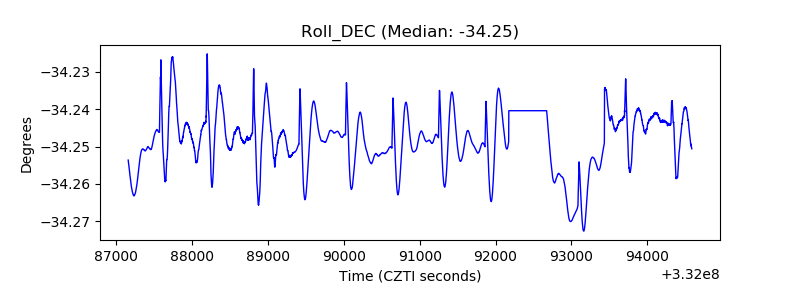 |
| _Roll_RA | 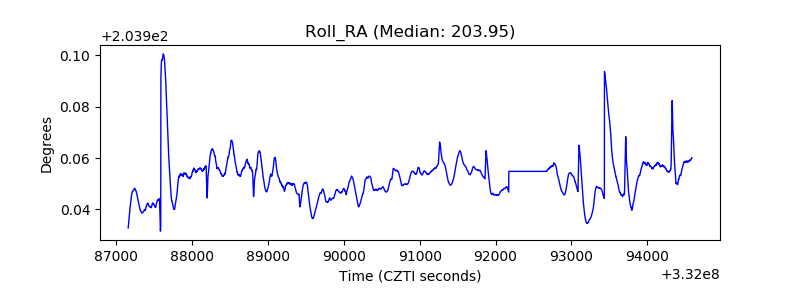 |
| Veto Counter | 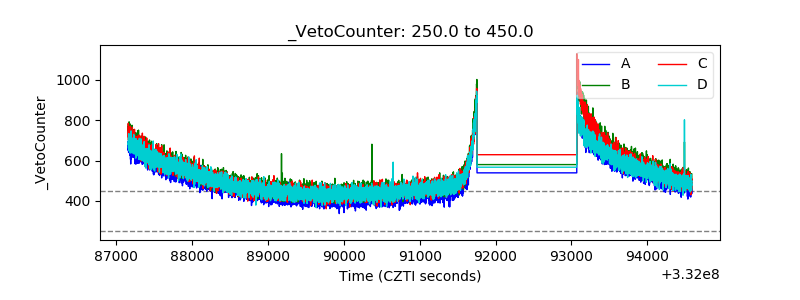 |