| Param | Original file | Final file |
|---|---|---|
| Filename | modeM0/AS1A07_068T01_9000003756_25867cztM0_level2.evt | modeM0/AS1A07_068T01_9000003756_25867cztM0_level2_quad_clean.evt |
| Size (bytes) | 579,283,200 | 98,320,320 |
| Size | 552.4 MB | 93.8 MB |
| Events in quadrant A | 5,415,143 | 646,359 |
| Events in quadrant B | 3,750,650 | 668,764 |
| Events in quadrant C | 3,340,961 | 619,513 |
| Events in quadrant D | 4,612,442 | 605,240 |
| Mode M0 | |||
|---|---|---|---|
| Quadrant | BADHDUFLAG | Total packets | Discarded packets |
| A | 0 | 20444 | 0 |
| B | 0 | 15235 | 0 |
| C | 0 | 13768 | 0 |
| D | 0 | 17858 | 0 |
| Mode M9 | |||
|---|---|---|---|
| Quadrant | BADHDUFLAG | Total packets | Discarded packets |
| A | 0 | 16 | 0 |
| B | 0 | 17 | 0 |
| C | 0 | 17 | 0 |
| D | 0 | 17 | 0 |
| Quadrant | Total seconds | Saturated seconds | Saturation percentage |
|---|---|---|---|
| A | 6263 | 502 | 8.015328% |
| B | 6263 | 165 | 2.634520% |
| C | 6263 | 150 | 2.395018% |
| D | 6263 | 513 | 8.190963% |
Noise dominated data is calculated using 1-second bins in cleaned event files. If a bin has >2000 counts, and if more than 50% of those come from <1% of pixels, then it is considered to be noise-dominated and hence unusable.
| Quadrant | # 1 sec bins | Bins with >0 counts | Bins with >2000 counts | High rate bins dominated by noise | Noise dominated (total time) | Noise dominated (detector-on time) | Marked lightcurve |
|---|---|---|---|---|---|---|---|
| A | 7563 | 6264 | 221 | 221 | 2.92% | 3.53% | 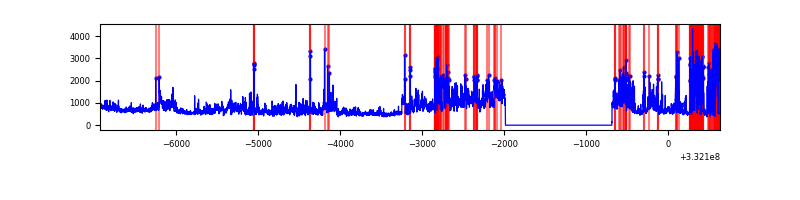 |
| B | 7563 | 6264 | 21 | 21 | 0.28% | 0.34% | 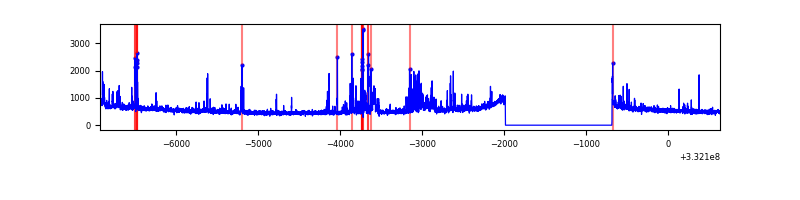 |
| C | 7563 | 6264 | 1 | 1 | 0.01% | 0.02% | 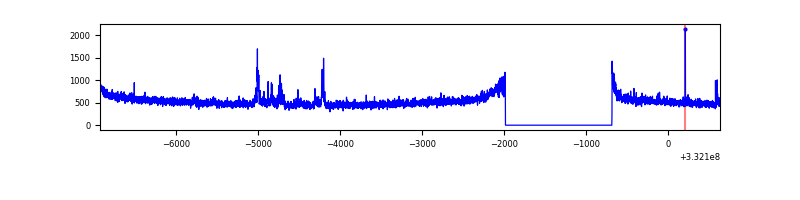 |
| D | 7563 | 6264 | 518 | 518 | 6.85% | 8.27% | 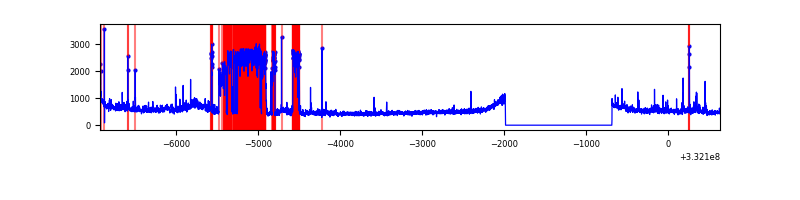 |
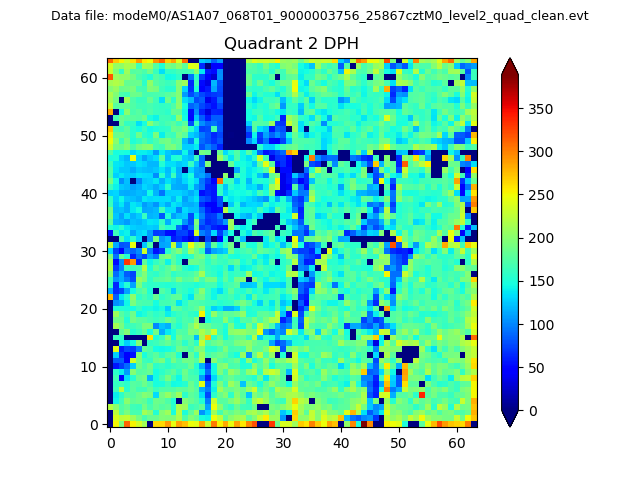
Top three noisy pixels from each quadrant. If the there are fewer than three noisy pixels in the level2.evt file, extra rows are filled as -1
| Pixel properties | Quadrant properties | ||||||
|---|---|---|---|---|---|---|---|
| Quadrant | DetID | PixID | Counts | Sigma | Mean | Median | Sigma |
| A | 0 | 13 | 2216795 | 13312.3 | 830 | 815 | 166.5 |
| A | 13 | 254 | 9437 | 51.8 | 830 | 815 | 166.5 |
| A | 0 | 226 | 7379 | 39.43 | 830 | 815 | 166.5 |
| B | 10 | 245 | 396365 | 2528.5 | 832 | 814 | 156.4 |
| B | 0 | 219 | 34787 | 217.17 | 832 | 814 | 156.4 |
| B | 12 | 111 | 18267 | 111.57 | 832 | 814 | 156.4 |
| C | 3 | 233 | 139954 | 761.23 | 787 | 790 | 182.8 |
| C | 14 | 238 | 129281 | 702.85 | 787 | 790 | 182.8 |
| C | 13 | 61 | 5577 | 26.19 | 787 | 790 | 182.8 |
| D | 1 | 52 | 1457183 | 7692.31 | 798 | 779 | 189.3 |
| D | 7 | 80 | 59884 | 312.18 | 798 | 779 | 189.3 |
| D | 2 | 234 | 25414 | 130.12 | 798 | 779 | 189.3 |
Histogram calculated using DETX and DETY for each event in the final _common_clean file
| Quadrant A | 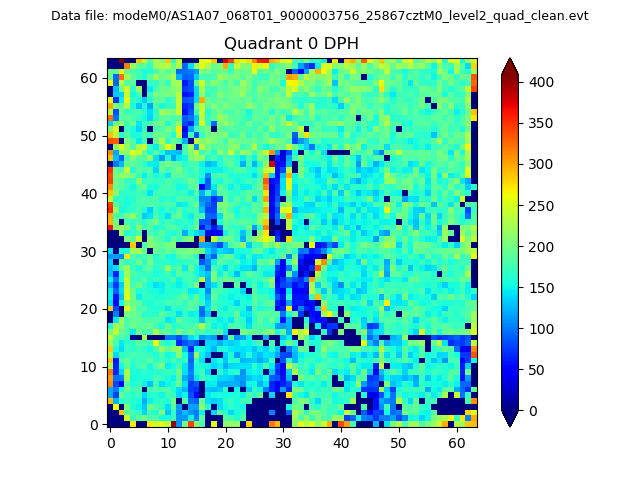 |
 |
Quadrant B |
|---|---|---|---|
| Quadrant D |  |
 |
Quadrant C |
| Plot type | Count rate plots | Images |
|---|---|---|
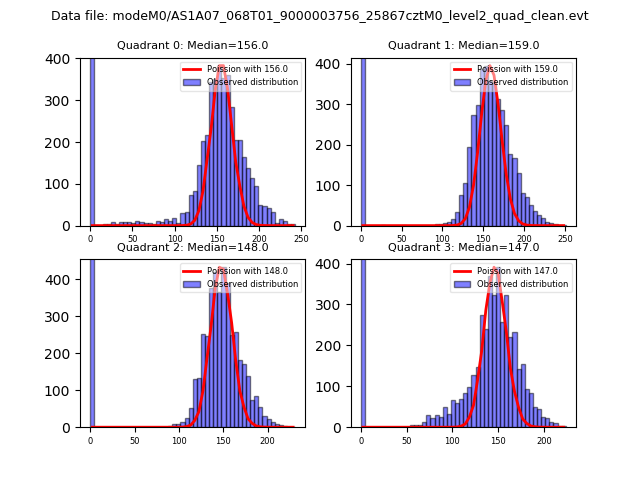
| Comparison with Poisson distribution Blue bars denote a histogram of data divided into 1 sec bins. Red curve is a Poisson curve with rate = median count rate of data. |
 |
 |
| Quadrant-wise count rates Data is divided into 100 sec bins |
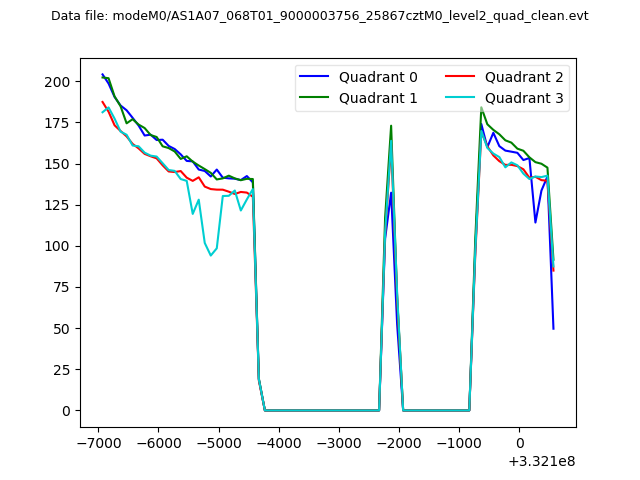 |
|
| Module-wise count rates for Quadrant A Data is divided into 100 sec bins |
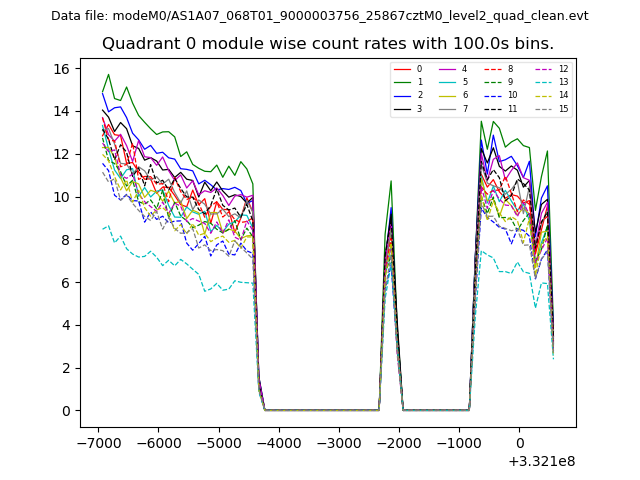 |
 |
| Module-wise count rates for Quadrant B Data is divided into 100 sec bins |
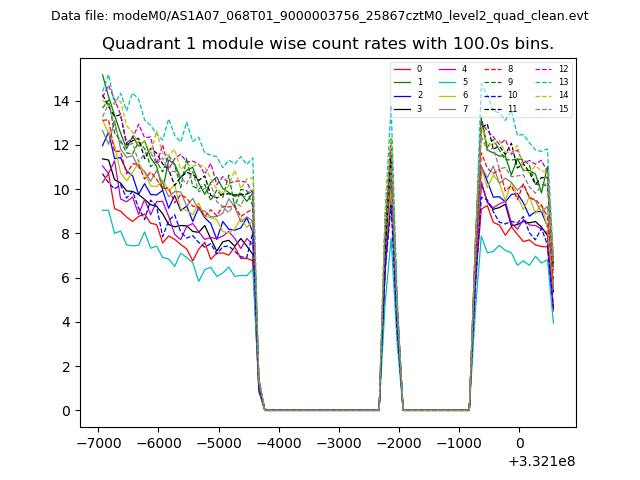 |
 |
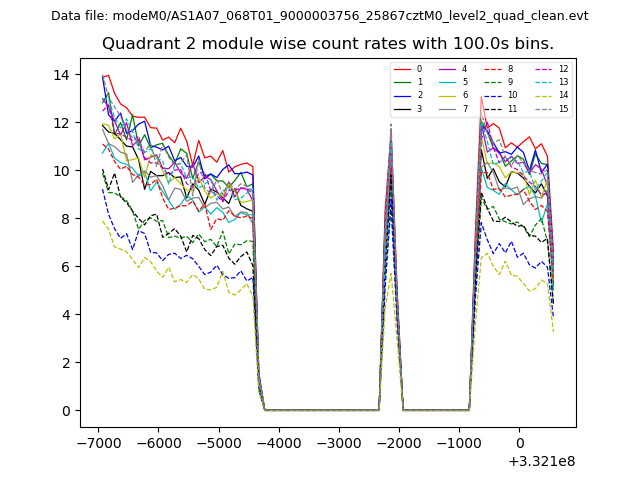
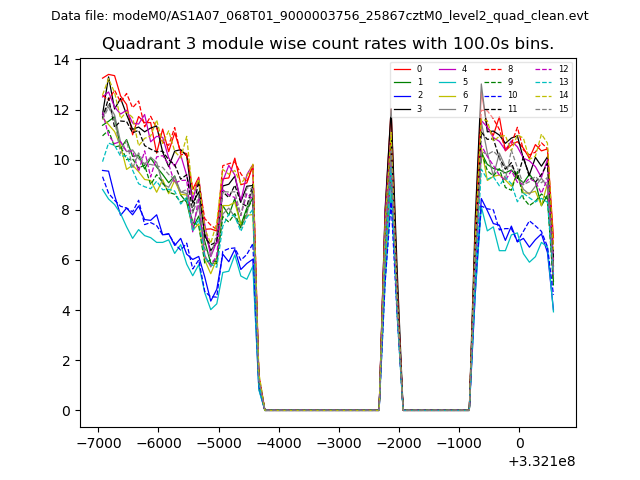
| Module-wise count rates for Quadrant C Data is divided into 100 sec bins |
 |
 |
| Module-wise count rates for Quadrant D Data is divided into 100 sec bins |
 |
 |
| Parameter | Plot |
|---|---|
| CZT HV Monitor | 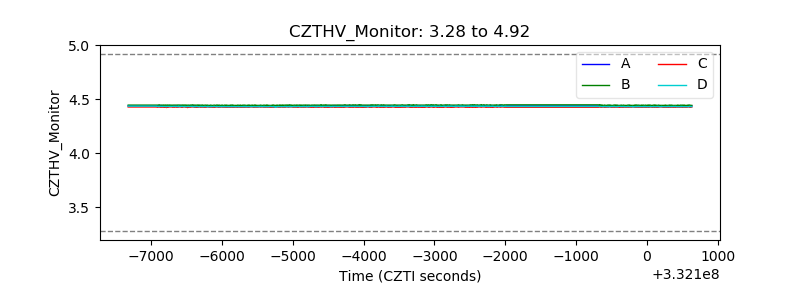 |
| D_VDD | 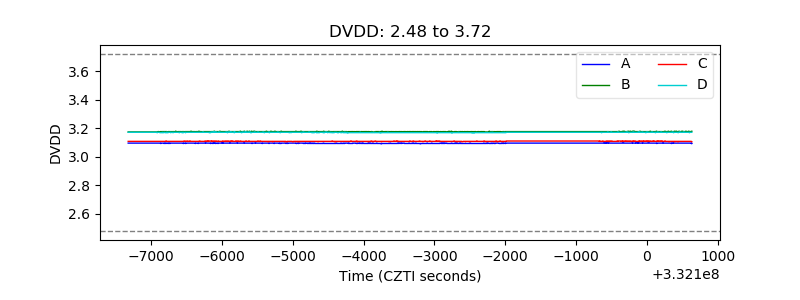 |
| Temperature 1 | 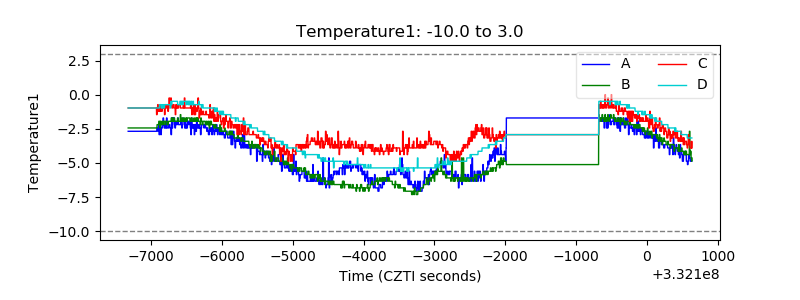 |
| Veto HV Monitor | 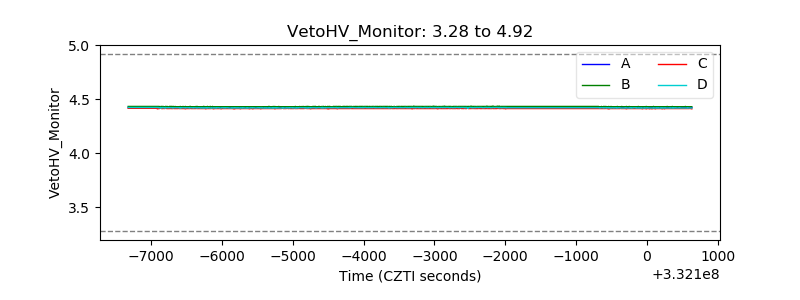 |
| Veto LLD | 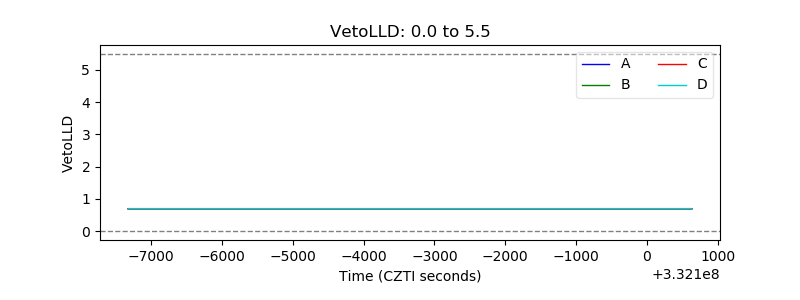 |
| Alpha Counter | 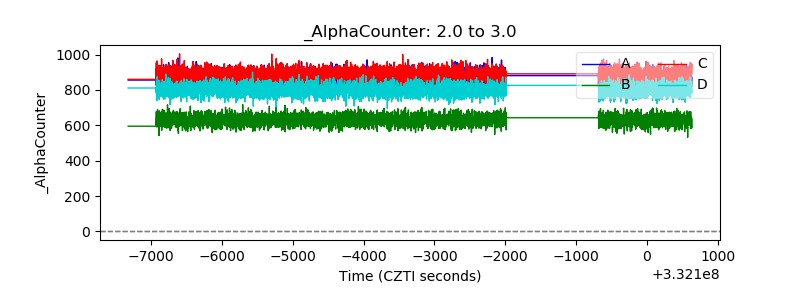 |
| _CPM_Rate |  |
| CZT Counter | 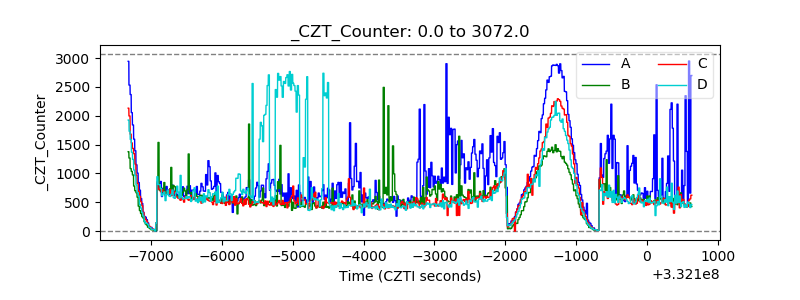 |
| +2.5 Volts monitor | 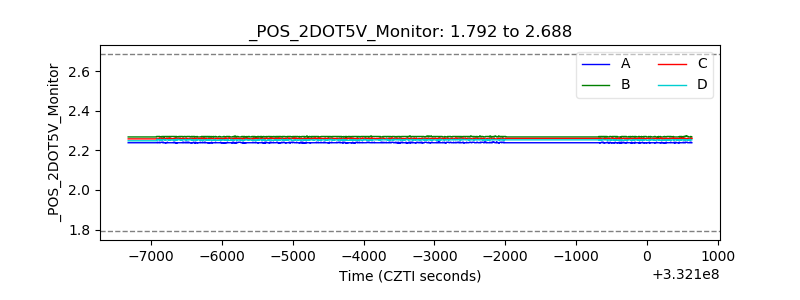 |
| +5 Volts monitor | 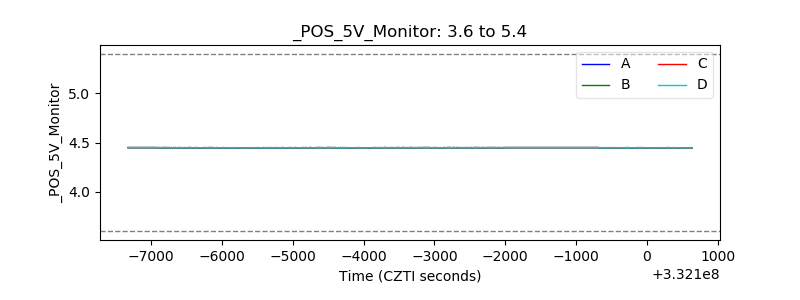 |
| _ROLL_ROT | 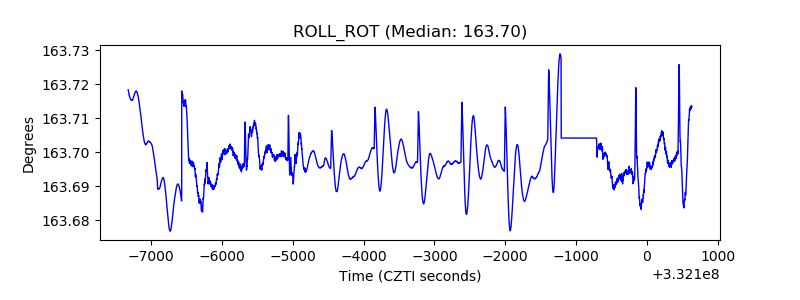 |
| _Roll_DEC | 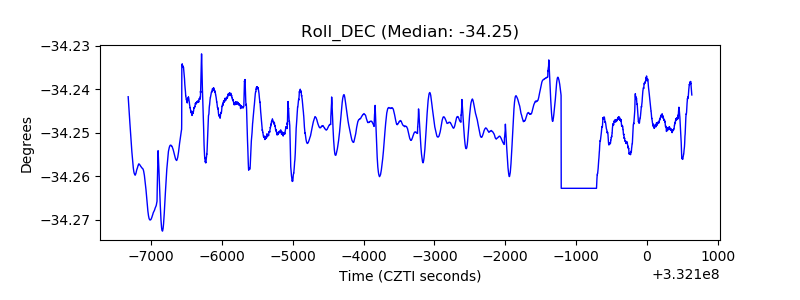 |
| _Roll_RA | 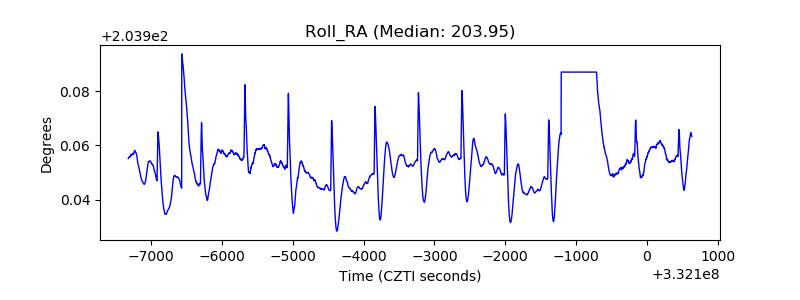 |
| Veto Counter | 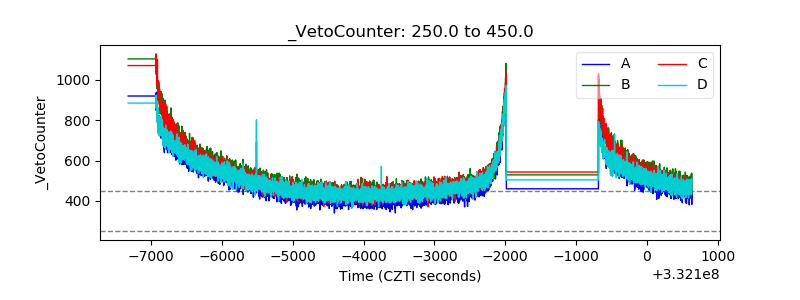 |