| Param | Original file | Final file |
|---|---|---|
| Filename | modeM0/AS1A07_068T01_9000003756_25868cztM0_level2.evt | modeM0/AS1A07_068T01_9000003756_25868cztM0_level2_quad_clean.evt |
| Size (bytes) | 526,979,520 | 94,504,320 |
| Size | 502.6 MB | 90.1 MB |
| Events in quadrant A | 4,389,626 | 618,278 |
| Events in quadrant B | 4,604,807 | 594,678 |
| Events in quadrant C | 3,228,385 | 599,502 |
| Events in quadrant D | 3,304,776 | 604,755 |
| Mode M0 | |||
|---|---|---|---|
| Quadrant | BADHDUFLAG | Total packets | Discarded packets |
| A | 0 | 17242 | 0 |
| B | 0 | 17719 | 0 |
| C | 0 | 13651 | 0 |
| D | 0 | 14109 | 0 |
| Mode M9 | |||
|---|---|---|---|
| Quadrant | BADHDUFLAG | Total packets | Discarded packets |
| A | 0 | 13 | 0 |
| B | 0 | 13 | 0 |
| C | 0 | 13 | 0 |
| D | 0 | 13 | 0 |
| Quadrant | Total seconds | Saturated seconds | Saturation percentage |
|---|---|---|---|
| A | 6371 | 342 | 5.368074% |
| B | 6372 | 624 | 9.792844% |
| C | 6372 | 114 | 1.789077% |
| D | 6372 | 52 | 0.816070% |
Noise dominated data is calculated using 1-second bins in cleaned event files. If a bin has >2000 counts, and if more than 50% of those come from <1% of pixels, then it is considered to be noise-dominated and hence unusable.
| Quadrant | # 1 sec bins | Bins with >0 counts | Bins with >2000 counts | High rate bins dominated by noise | Noise dominated (total time) | Noise dominated (detector-on time) | Marked lightcurve |
|---|---|---|---|---|---|---|---|
| A | 7581 | 6372 | 219 | 219 | 2.89% | 3.44% | 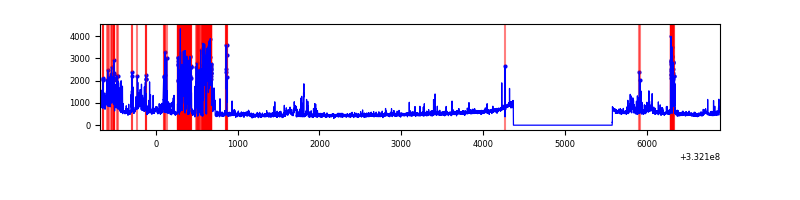 |
| B | 7582 | 6373 | 500 | 500 | 6.59% | 7.85% | 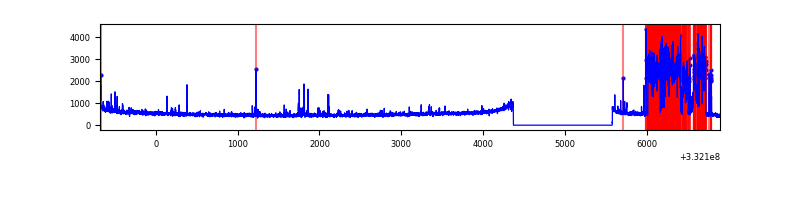 |
| C | 7582 | 6373 | 1 | 1 | 0.01% | 0.02% | 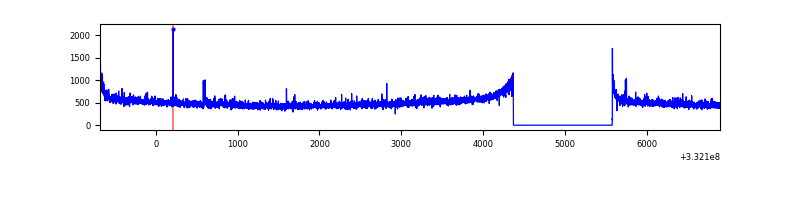 |
| D | 7582 | 6373 | 6 | 6 | 0.08% | 0.09% | 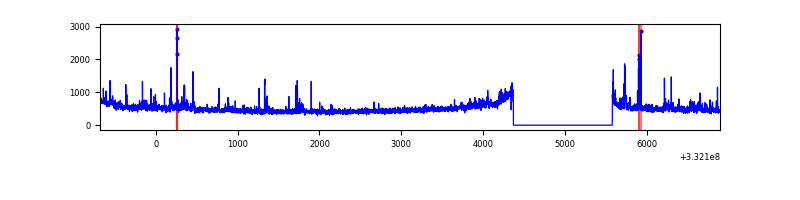 |
Top three noisy pixels from each quadrant. If the there are fewer than three noisy pixels in the level2.evt file, extra rows are filled as -1
| Pixel properties | Quadrant properties | ||||||
|---|---|---|---|---|---|---|---|
| Quadrant | DetID | PixID | Counts | Sigma | Mean | Median | Sigma |
| A | 0 | 13 | 1243836 | 7589.21 | 816 | 802 | 163.8 |
| A | 13 | 254 | 9806 | 54.97 | 816 | 802 | 163.8 |
| A | 3 | 137 | 7365 | 40.07 | 816 | 802 | 163.8 |
| B | 10 | 245 | 1498413 | 10043.74 | 782 | 764 | 149.1 |
| B | 12 | 111 | 17763 | 114.0 | 782 | 764 | 149.1 |
| B | 11 | 111 | 15750 | 100.5 | 782 | 764 | 149.1 |
| C | 14 | 238 | 126456 | 695.73 | 775 | 781 | 180.6 |
| C | 3 | 233 | 78169 | 428.42 | 775 | 781 | 180.6 |
| C | 13 | 61 | 5428 | 25.73 | 775 | 781 | 180.6 |
| D | 1 | 52 | 233196 | 1232.52 | 788 | 772 | 188.6 |
| D | 2 | 234 | 27413 | 141.27 | 788 | 772 | 188.6 |
| D | 1 | 3 | 27217 | 140.24 | 788 | 772 | 188.6 |
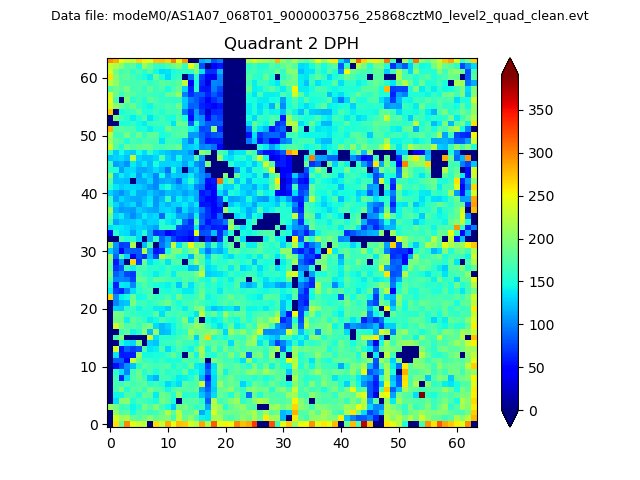
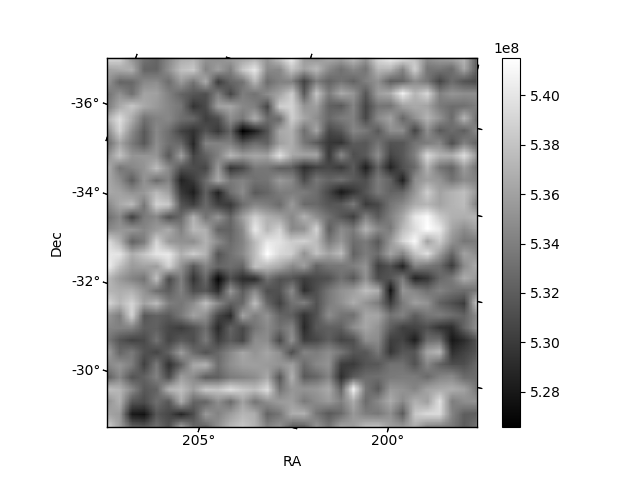
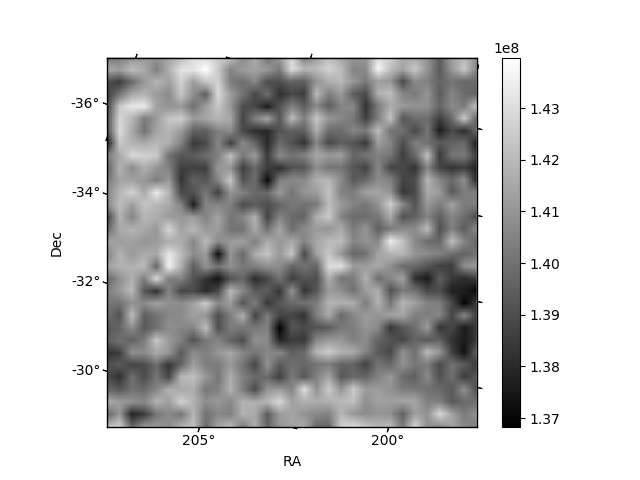
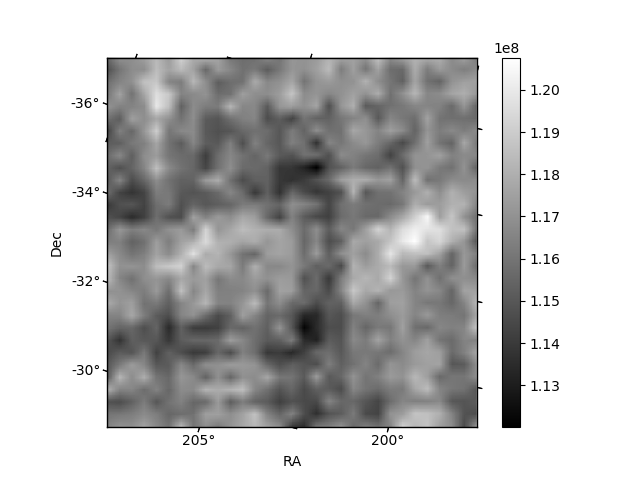
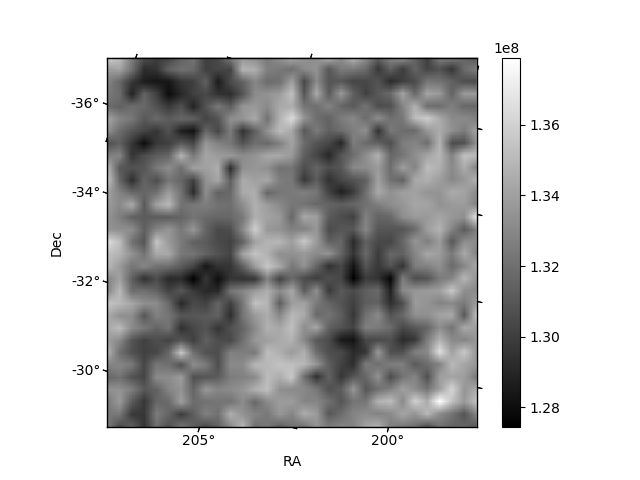
Histogram calculated using DETX and DETY for each event in the final _common_clean file
| Quadrant A | 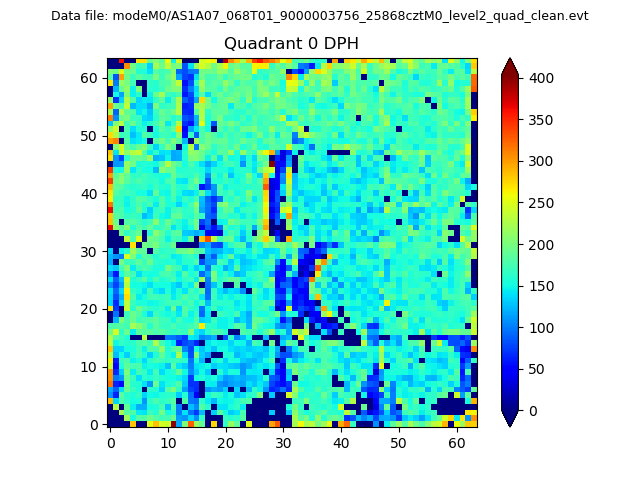 |
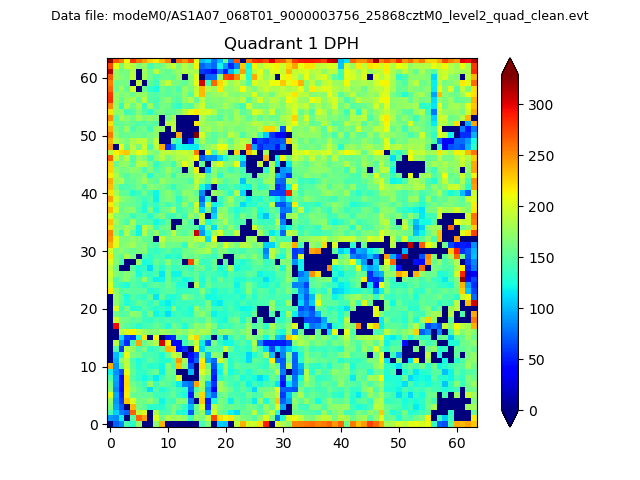 |
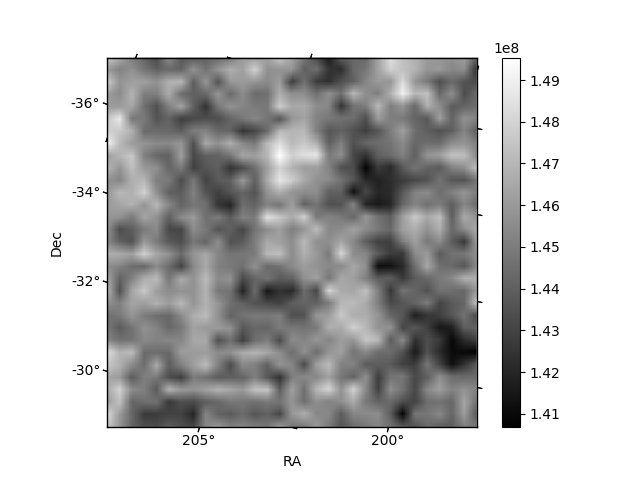
Quadrant B |
|---|---|---|---|
| Quadrant D | 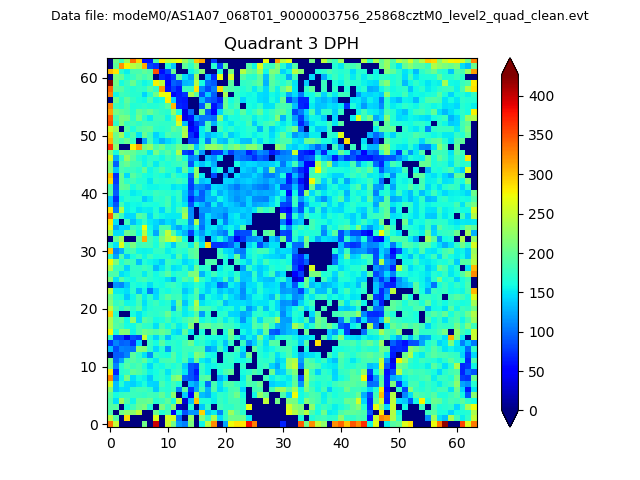 |
 |
Quadrant C |
| Plot type | Count rate plots | Images |
|---|---|---|
| Comparison with Poisson distribution Blue bars denote a histogram of data divided into 1 sec bins. Red curve is a Poisson curve with rate = median count rate of data. |
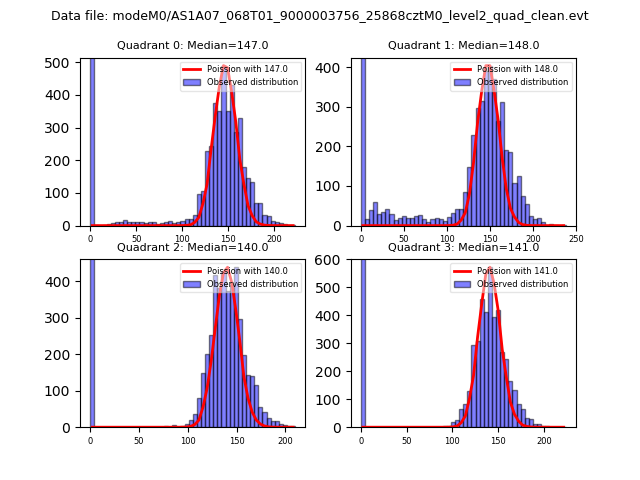 |
 |
| Quadrant-wise count rates Data is divided into 100 sec bins |
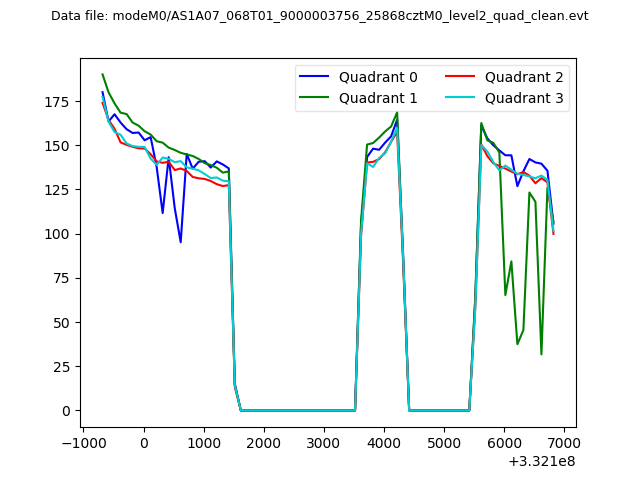 |
|
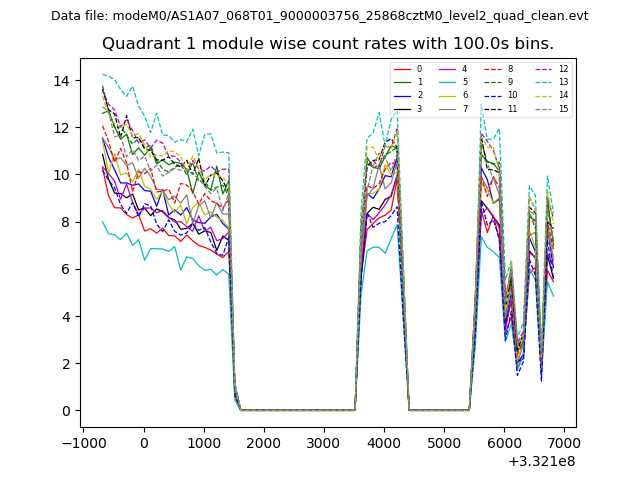
| Module-wise count rates for Quadrant A Data is divided into 100 sec bins |
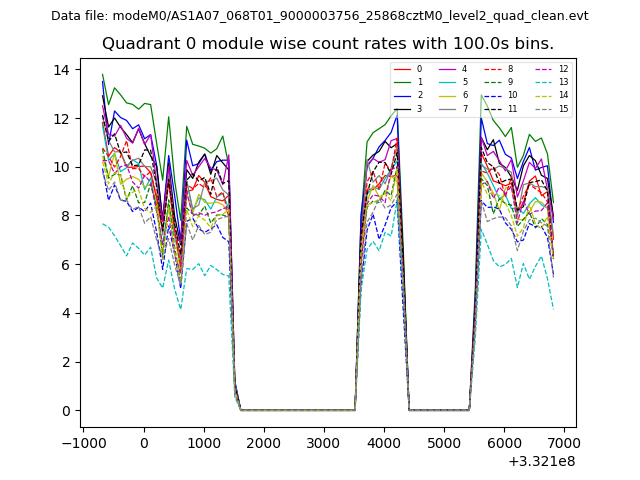 |
 |
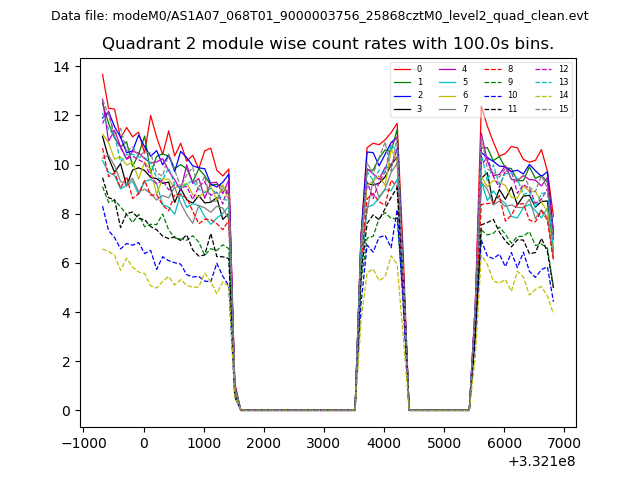
| Module-wise count rates for Quadrant B Data is divided into 100 sec bins |
 |
 |
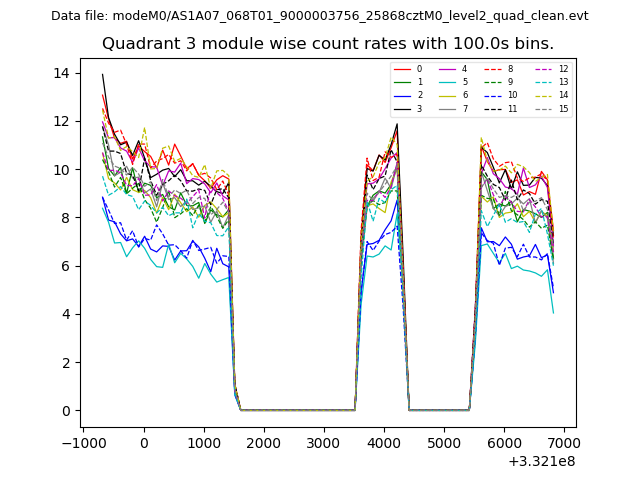
| Module-wise count rates for Quadrant C Data is divided into 100 sec bins |
 |
 |
| Module-wise count rates for Quadrant D Data is divided into 100 sec bins |
 |
 |
| Parameter | Plot |
|---|---|
| CZT HV Monitor | 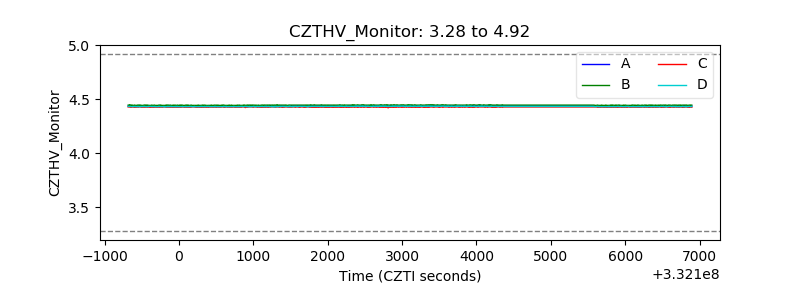 |
| D_VDD | 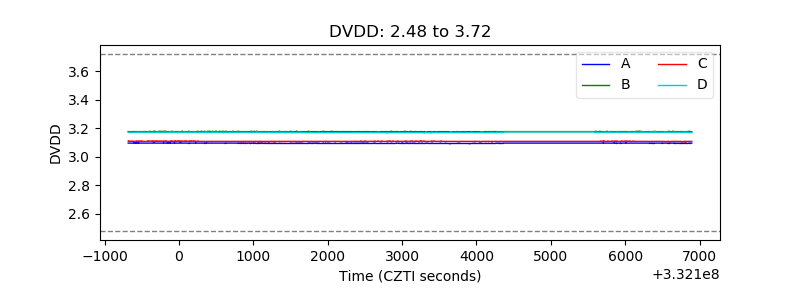 |
| Temperature 1 | 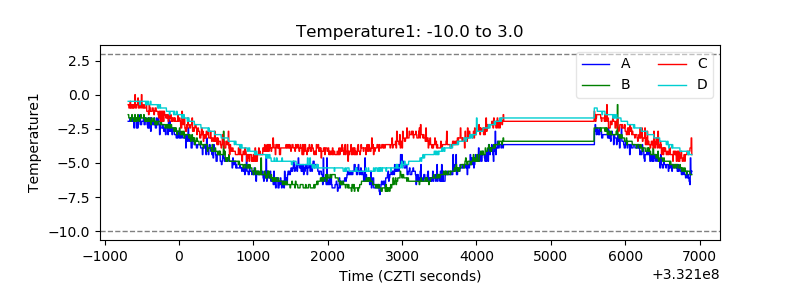 |
| Veto HV Monitor | 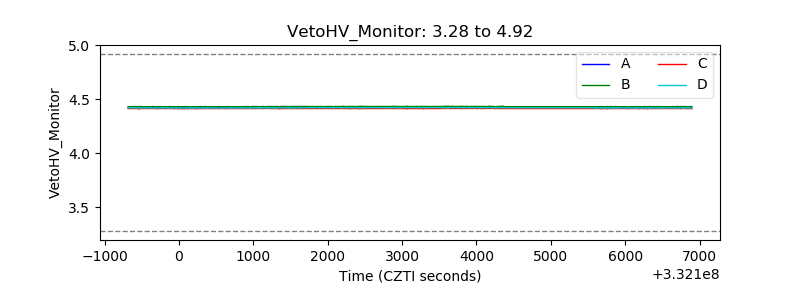 |
| Veto LLD | 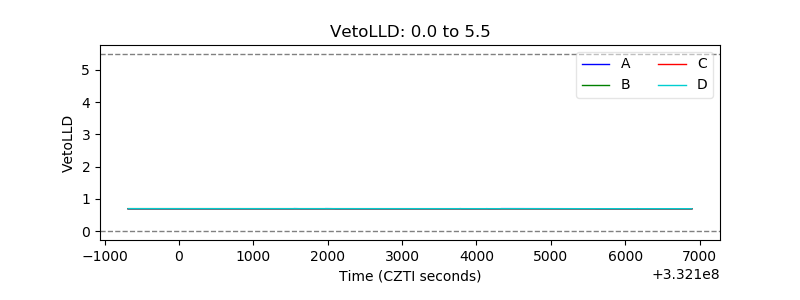 |
| Alpha Counter |  |
| _CPM_Rate | 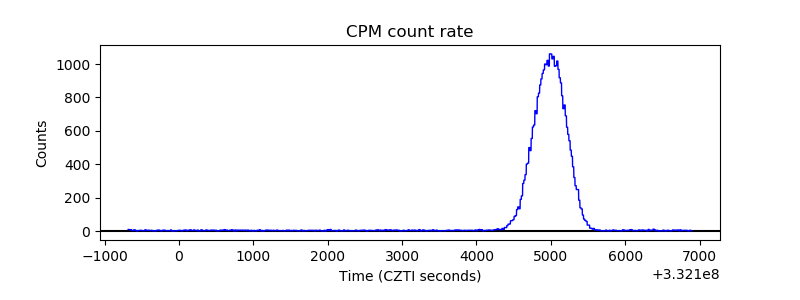 |
| CZT Counter | 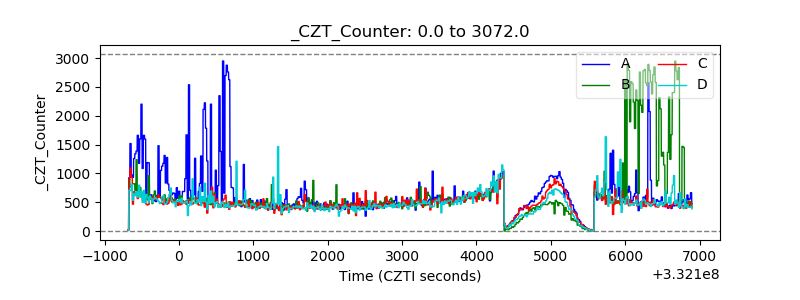 |
| +2.5 Volts monitor |  |
| +5 Volts monitor |  |
| _ROLL_ROT | 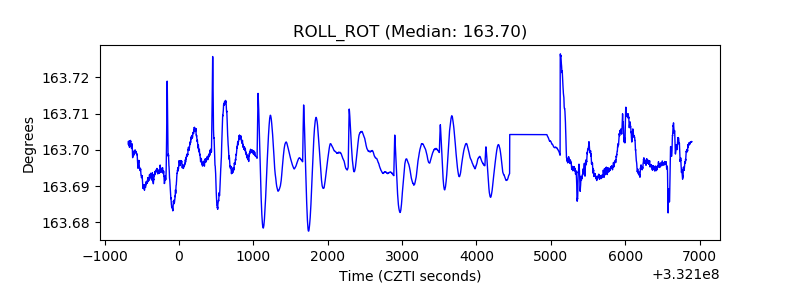 |
| _Roll_DEC | 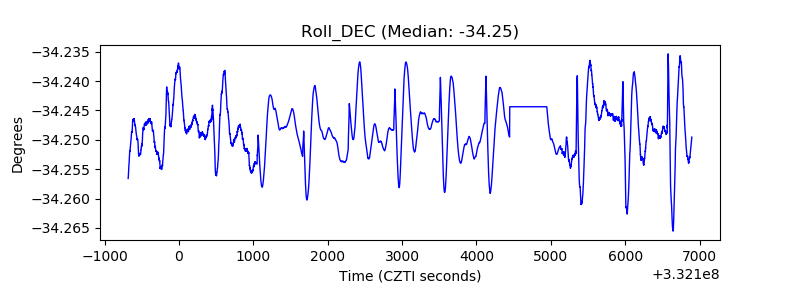 |
| _Roll_RA |  |
| Veto Counter | 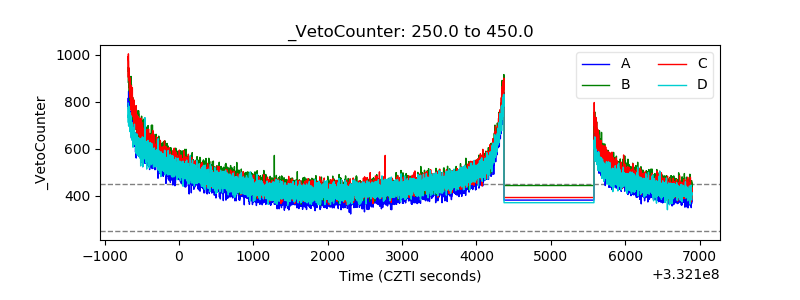 |