| Param | Original file | Final file |
|---|---|---|
| Filename | modeM0/AS1A07_068T01_9000003756_25869cztM0_level2.evt | modeM0/AS1A07_068T01_9000003756_25869cztM0_level2_quad_clean.evt |
| Size (bytes) | 524,831,040 | 95,328,000 |
| Size | 500.5 MB | 90.9 MB |
| Events in quadrant A | 4,325,612 | 629,965 |
| Events in quadrant B | 4,595,263 | 587,715 |
| Events in quadrant C | 3,209,041 | 601,954 |
| Events in quadrant D | 3,313,439 | 603,449 |
| Mode M0 | |||
|---|---|---|---|
| Quadrant | BADHDUFLAG | Total packets | Discarded packets |
| A | 0 | 17423 | 0 |
| B | 0 | 17940 | 0 |
| C | 0 | 13828 | 0 |
| D | 0 | 14373 | 0 |
| Mode M9 | |||
|---|---|---|---|
| Quadrant | BADHDUFLAG | Total packets | Discarded packets |
| A | 0 | 16 | 0 |
| B | 0 | 17 | 0 |
| C | 0 | 17 | 0 |
| D | 0 | 17 | 0 |
| Quadrant | Total seconds | Saturated seconds | Saturation percentage |
|---|---|---|---|
| A | 6652 | 72 | 1.082381% |
| B | 6651 | 567 | 8.525034% |
| C | 6652 | 51 | 0.766687% |
| D | 6651 | 31 | 0.466095% |
Noise dominated data is calculated using 1-second bins in cleaned event files. If a bin has >2000 counts, and if more than 50% of those come from <1% of pixels, then it is considered to be noise-dominated and hence unusable.
| Quadrant | # 1 sec bins | Bins with >0 counts | Bins with >2000 counts | High rate bins dominated by noise | Noise dominated (total time) | Noise dominated (detector-on time) | Marked lightcurve |
|---|---|---|---|---|---|---|---|
| A | 7622 | 6653 | 38 | 38 | 0.50% | 0.57% | 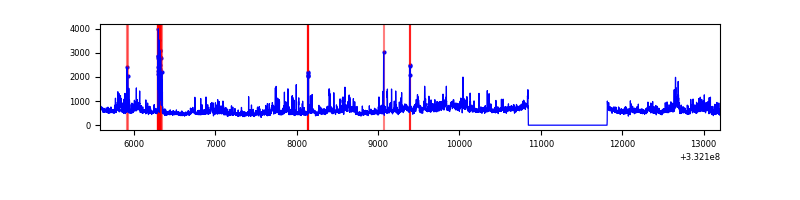 |
| B | 7622 | 6653 | 506 | 506 | 6.64% | 7.61% | 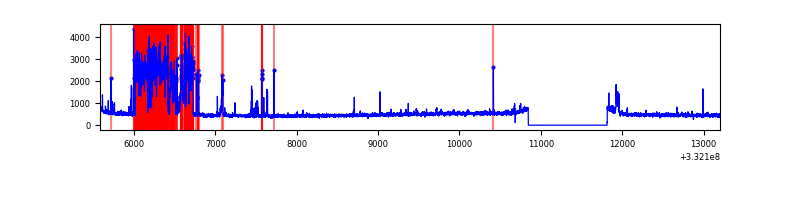 |
| C | 7622 | 6653 | 0 | 0 | 0.00% | 0.00% | 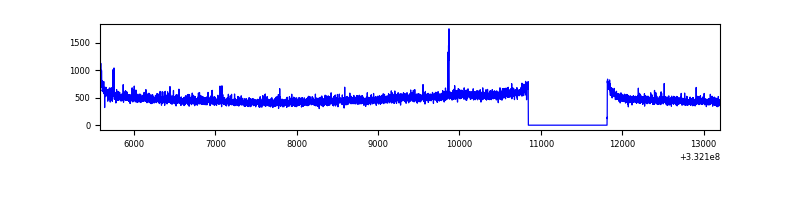 |
| D | 7621 | 6652 | 17 | 17 | 0.22% | 0.26% | 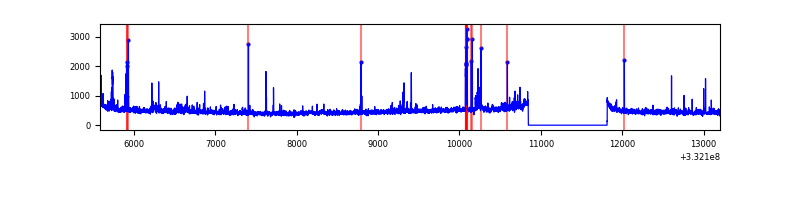 |
Top three noisy pixels from each quadrant. If the there are fewer than three noisy pixels in the level2.evt file, extra rows are filled as -1
| Pixel properties | Quadrant properties | ||||||
|---|---|---|---|---|---|---|---|
| Quadrant | DetID | PixID | Counts | Sigma | Mean | Median | Sigma |
| A | 0 | 13 | 1168475 | 7102.32 | 818 | 806 | 164.4 |
| A | 13 | 254 | 10034 | 56.13 | 818 | 806 | 164.4 |
| A | 3 | 137 | 7544 | 40.98 | 818 | 806 | 164.4 |
| B | 10 | 245 | 1538019 | 10338.5 | 775 | 756 | 148.7 |
| B | 12 | 111 | 17933 | 115.52 | 775 | 756 | 148.7 |
| B | 11 | 111 | 15963 | 102.27 | 775 | 756 | 148.7 |
| C | 14 | 238 | 125574 | 686.59 | 775 | 780 | 181.8 |
| C | 3 | 233 | 61121 | 331.98 | 775 | 780 | 181.8 |
| C | 13 | 61 | 5426 | 25.56 | 775 | 780 | 181.8 |
| D | 1 | 52 | 262638 | 1390.44 | 785 | 765 | 188.3 |
| D | 8 | 195 | 35781 | 185.92 | 785 | 765 | 188.3 |
| D | 2 | 234 | 26808 | 138.28 | 785 | 765 | 188.3 |
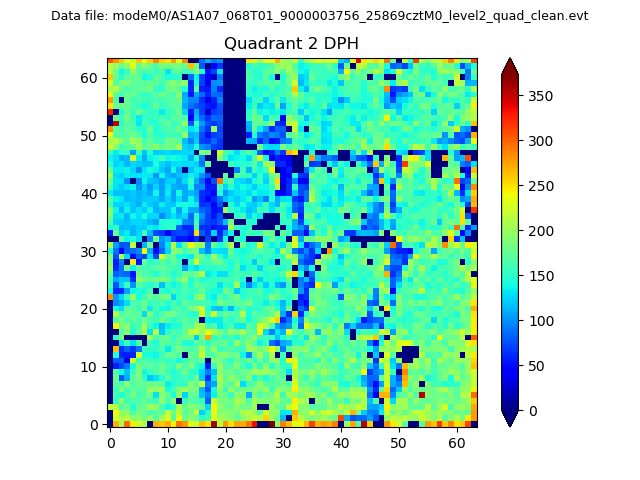
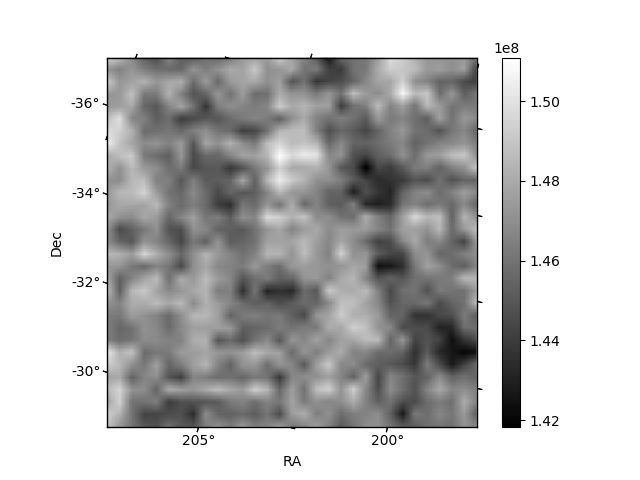
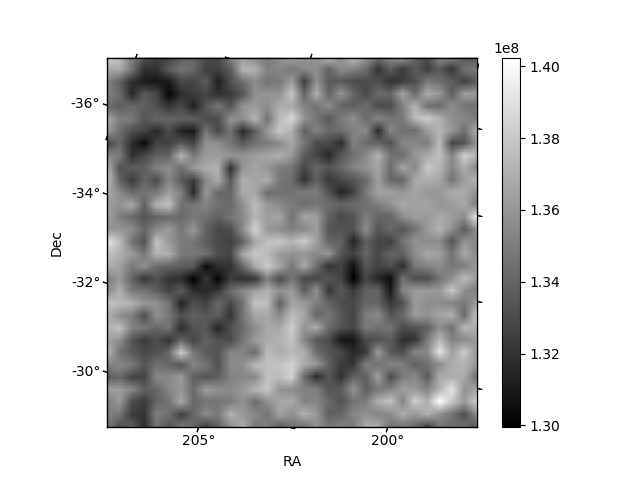
Histogram calculated using DETX and DETY for each event in the final _common_clean file
| Quadrant A | 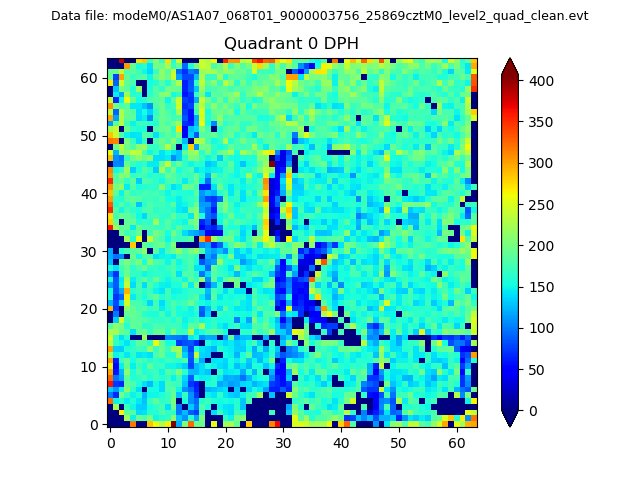 |
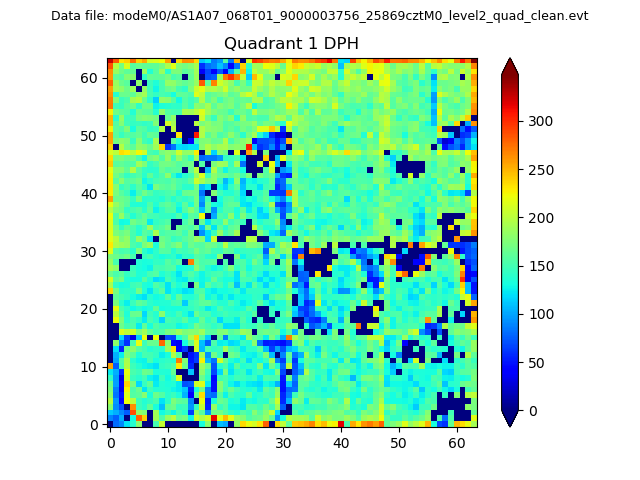 |
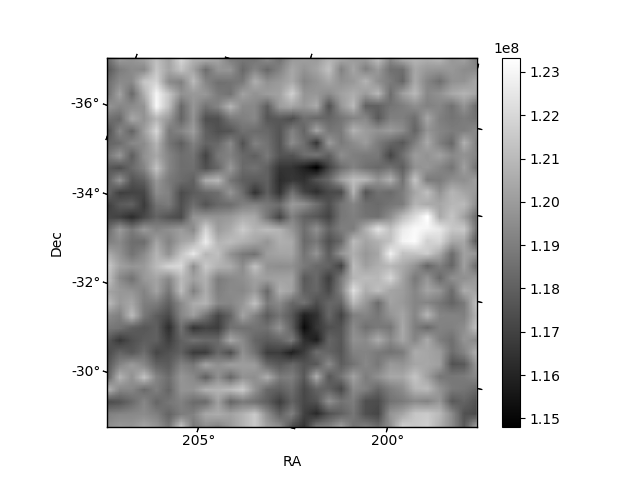
Quadrant B |
|---|---|---|---|
| Quadrant D | 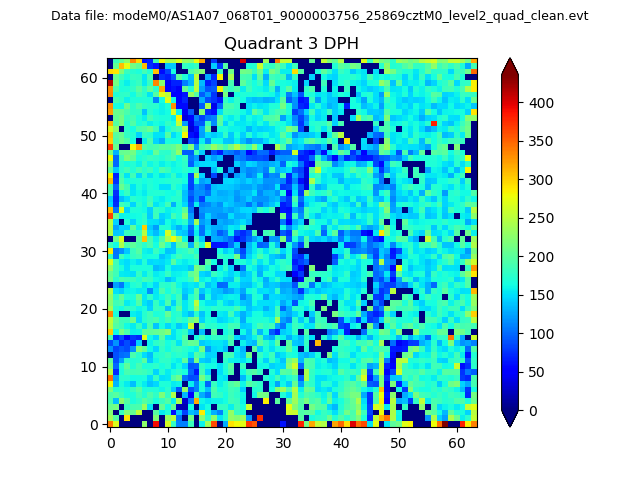 |
 |
Quadrant C |
| Plot type | Count rate plots | Images |
|---|---|---|
| Comparison with Poisson distribution Blue bars denote a histogram of data divided into 1 sec bins. Red curve is a Poisson curve with rate = median count rate of data. |
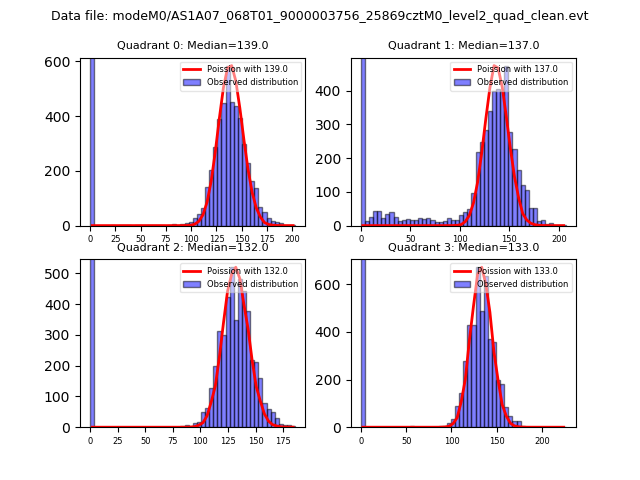 |
 |
| Quadrant-wise count rates Data is divided into 100 sec bins |
 |
|
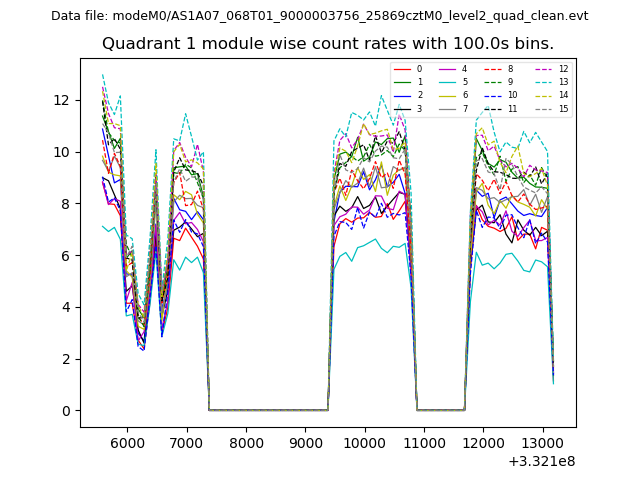
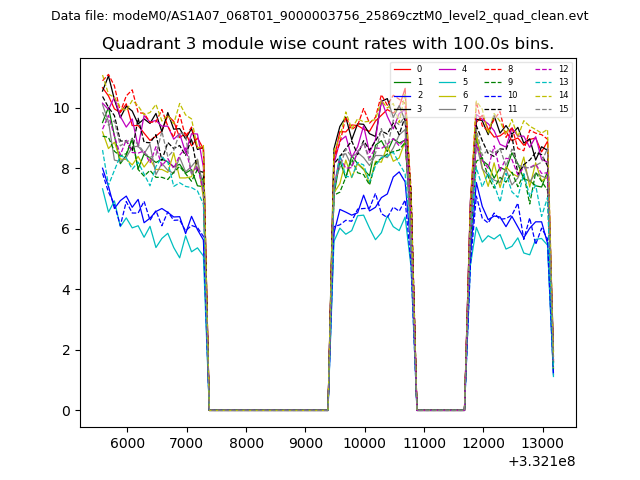
| Module-wise count rates for Quadrant A Data is divided into 100 sec bins |
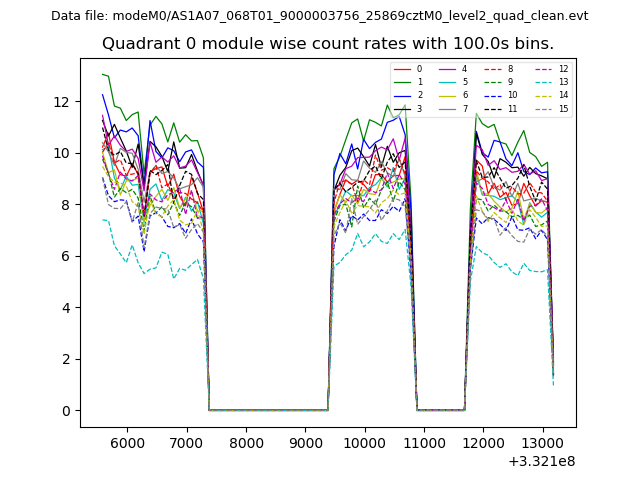 |
 |
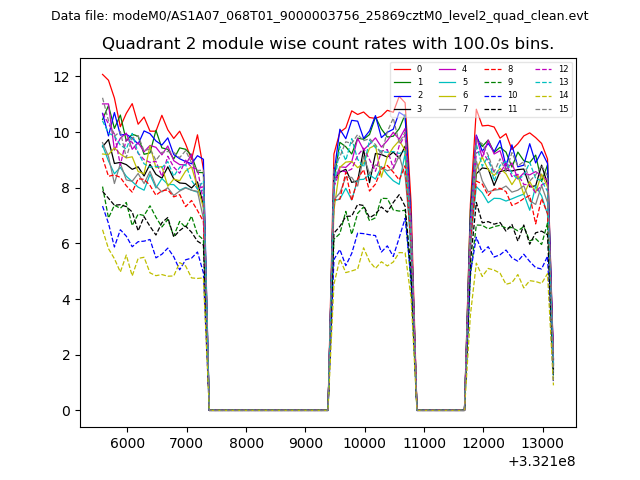
| Module-wise count rates for Quadrant B Data is divided into 100 sec bins |
 |
 |
| Module-wise count rates for Quadrant C Data is divided into 100 sec bins |
 |
 |
| Module-wise count rates for Quadrant D Data is divided into 100 sec bins |
 |
 |
| Parameter | Plot |
|---|---|
| CZT HV Monitor | 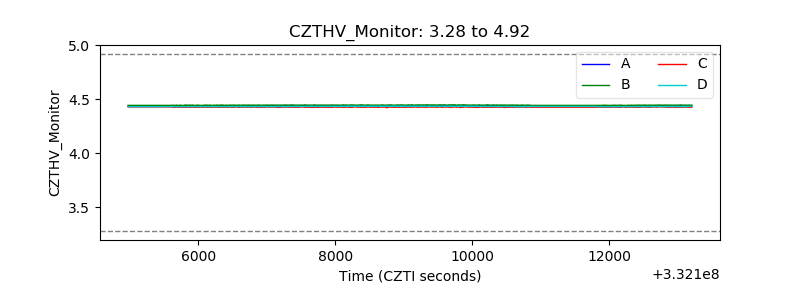 |
| D_VDD | 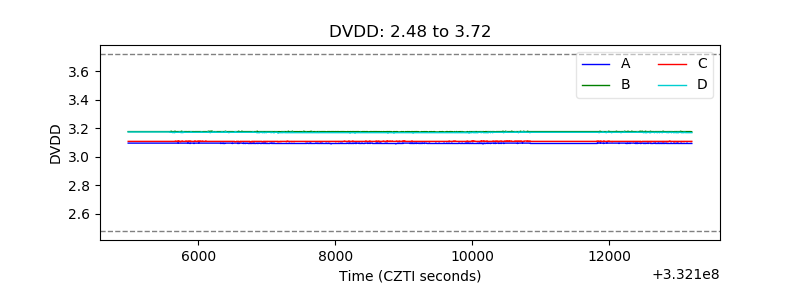 |
| Temperature 1 | 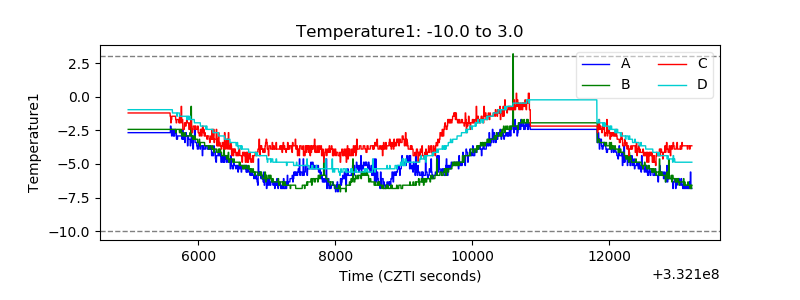 |
| Veto HV Monitor |  |
| Veto LLD | 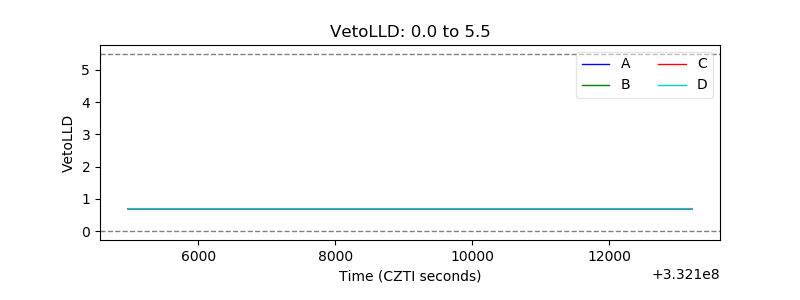 |
| Alpha Counter | 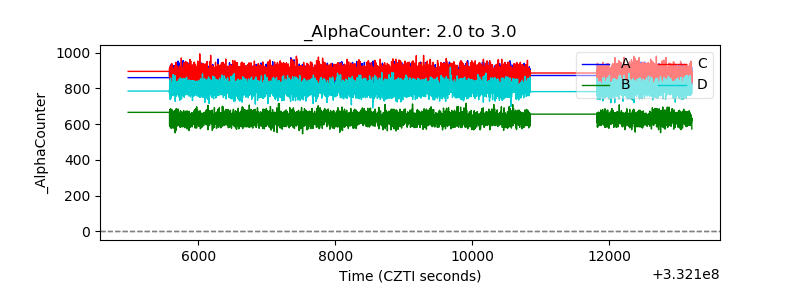 |
| _CPM_Rate |  |
| CZT Counter | 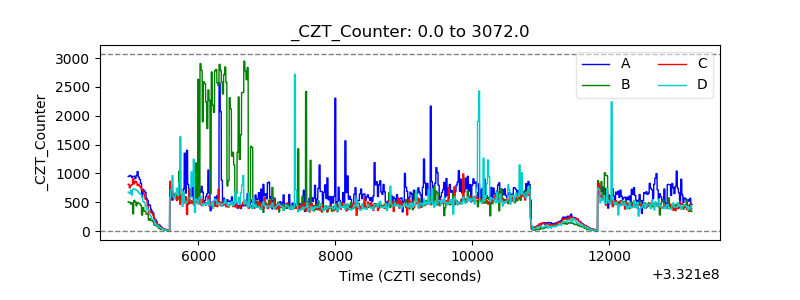 |
| +2.5 Volts monitor | 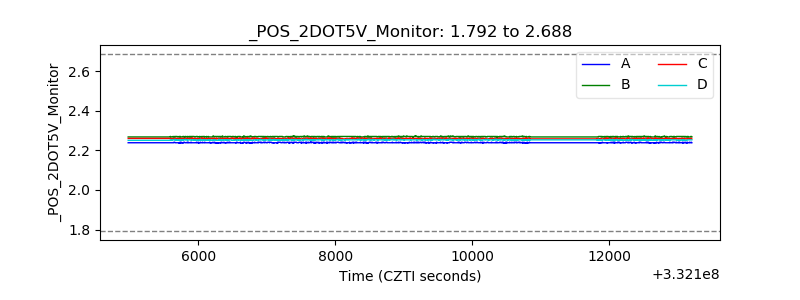 |
| +5 Volts monitor |  |
| _ROLL_ROT | 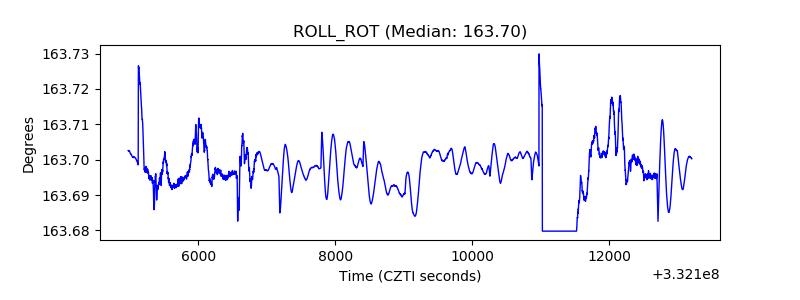 |
| _Roll_DEC |  |
| _Roll_RA | 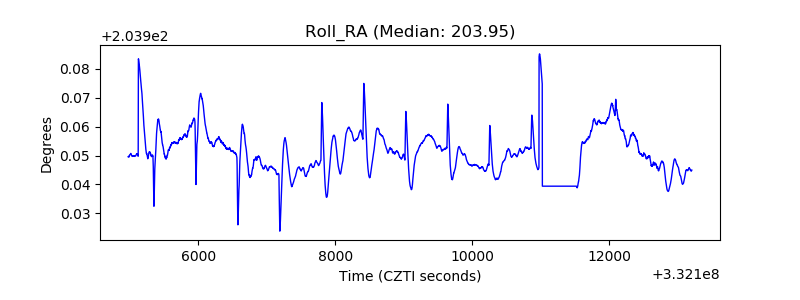 |
| Veto Counter | 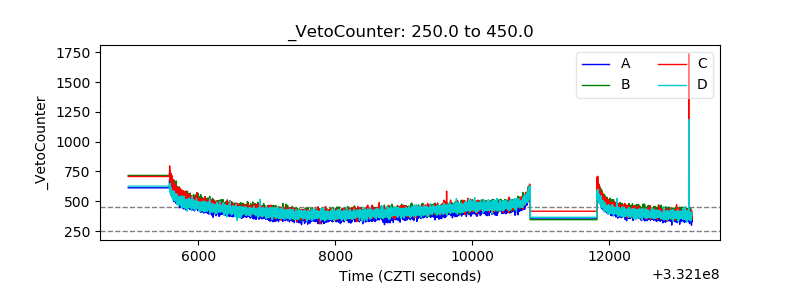 |