| Param | Original file | Final file |
|---|---|---|
| Filename | modeM0/AS1A07_068T01_9000003756_25870cztM0_level2.evt | modeM0/AS1A07_068T01_9000003756_25870cztM0_level2_quad_clean.evt |
| Size (bytes) | 510,269,760 | 96,022,080 |
| Size | 486.6 MB | 91.6 MB |
| Events in quadrant A | 4,467,730 | 613,790 |
| Events in quadrant B | 3,577,114 | 622,066 |
| Events in quadrant C | 3,377,436 | 588,672 |
| Events in quadrant D | 3,550,380 | 589,745 |
| Mode M0 | |||
|---|---|---|---|
| Quadrant | BADHDUFLAG | Total packets | Discarded packets |
| A | 0 | 18082 | 0 |
| B | 0 | 15183 | 0 |
| C | 0 | 14627 | 0 |
| D | 0 | 15416 | 0 |
| Mode M9 | |||
|---|---|---|---|
| Quadrant | BADHDUFLAG | Total packets | Discarded packets |
| A | 0 | 8 | 0 |
| B | 0 | 9 | 0 |
| C | 0 | 9 | 0 |
| D | 0 | 9 | 0 |
| Quadrant | Total seconds | Saturated seconds | Saturation percentage |
|---|---|---|---|
| A | 7094 | 107 | 1.508317% |
| B | 7094 | 66 | 0.930364% |
| C | 7094 | 60 | 0.845785% |
| D | 7094 | 60 | 0.845785% |
Noise dominated data is calculated using 1-second bins in cleaned event files. If a bin has >2000 counts, and if more than 50% of those come from <1% of pixels, then it is considered to be noise-dominated and hence unusable.
| Quadrant | # 1 sec bins | Bins with >0 counts | Bins with >2000 counts | High rate bins dominated by noise | Noise dominated (total time) | Noise dominated (detector-on time) | Marked lightcurve |
|---|---|---|---|---|---|---|---|
| A | 7649 | 7095 | 42 | 42 | 0.55% | 0.59% | 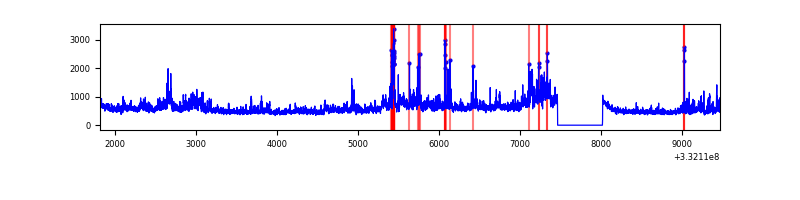 |
| B | 7649 | 7095 | 18 | 18 | 0.24% | 0.25% | 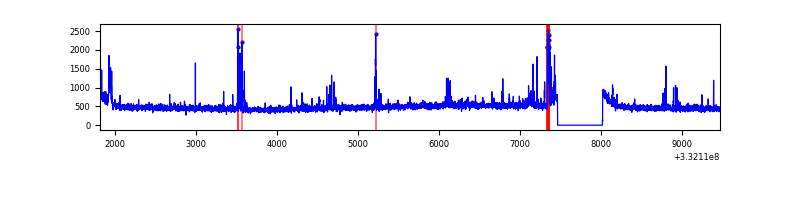 |
| C | 7649 | 7095 | 2 | 2 | 0.03% | 0.03% | 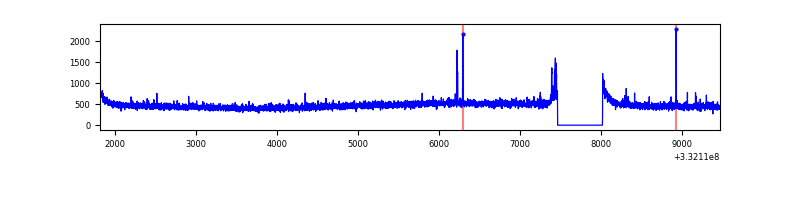 |
| D | 7649 | 7095 | 22 | 22 | 0.29% | 0.31% | 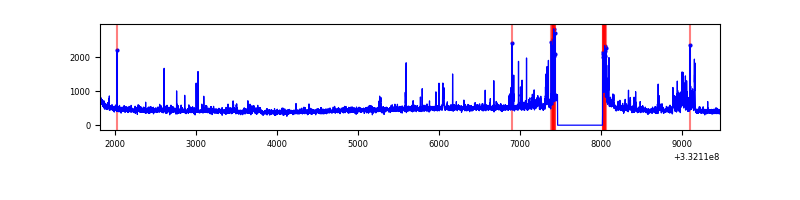 |
Top three noisy pixels from each quadrant. If the there are fewer than three noisy pixels in the level2.evt file, extra rows are filled as -1
| Pixel properties | Quadrant properties | ||||||
|---|---|---|---|---|---|---|---|
| Quadrant | DetID | PixID | Counts | Sigma | Mean | Median | Sigma |
| A | 0 | 13 | 1147910 | 6588.96 | 861 | 846 | 174.1 |
| A | 13 | 254 | 10640 | 56.26 | 861 | 846 | 174.1 |
| A | 3 | 137 | 8208 | 42.29 | 861 | 846 | 174.1 |
| B | 10 | 245 | 206306 | 1240.58 | 854 | 831 | 165.6 |
| B | 12 | 111 | 20175 | 116.79 | 854 | 831 | 165.6 |
| B | 11 | 111 | 18039 | 103.89 | 854 | 831 | 165.6 |
| C | 14 | 238 | 130437 | 677.16 | 815 | 821 | 191.4 |
| C | 3 | 233 | 54186 | 278.8 | 815 | 821 | 191.4 |
| C | 14 | 128 | 10694 | 51.58 | 815 | 821 | 191.4 |
| D | 1 | 52 | 258284 | 1306.34 | 824 | 804 | 197.1 |
| D | 12 | 233 | 107544 | 541.55 | 824 | 804 | 197.1 |
| D | 7 | 80 | 33308 | 164.91 | 824 | 804 | 197.1 |
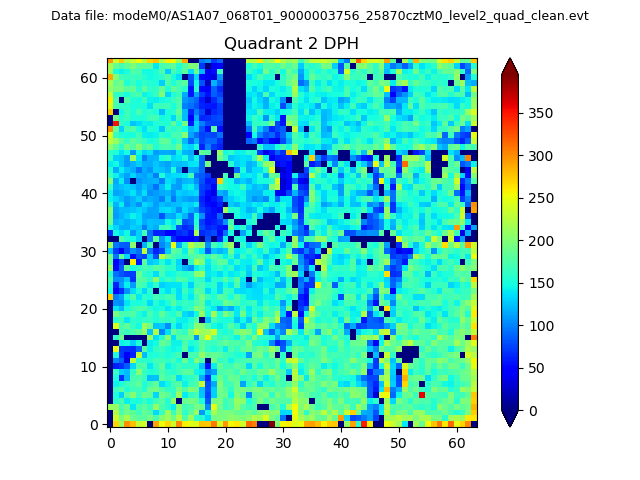
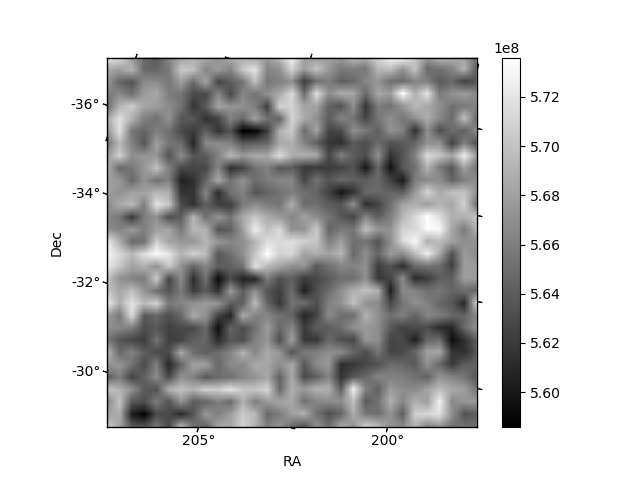
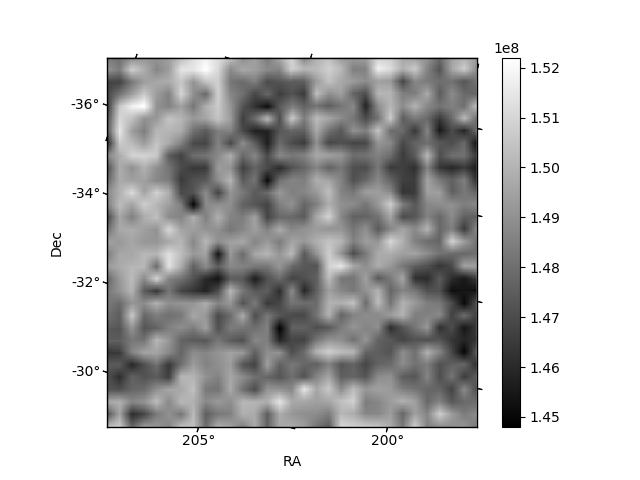
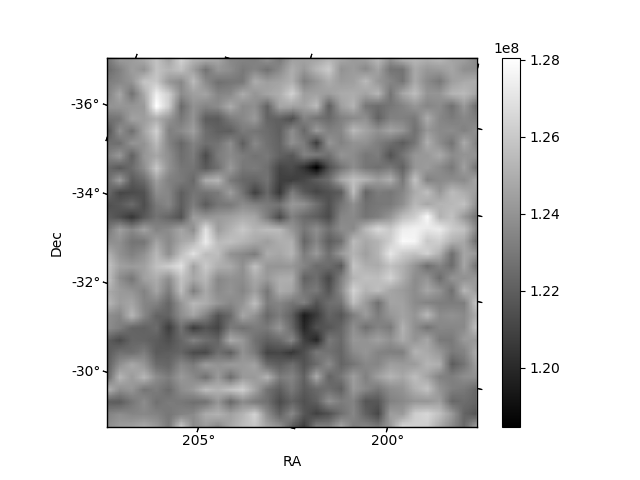
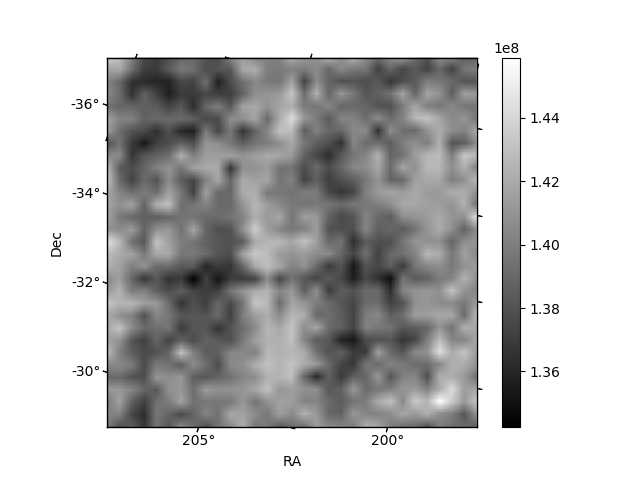
Histogram calculated using DETX and DETY for each event in the final _common_clean file
| Quadrant A | 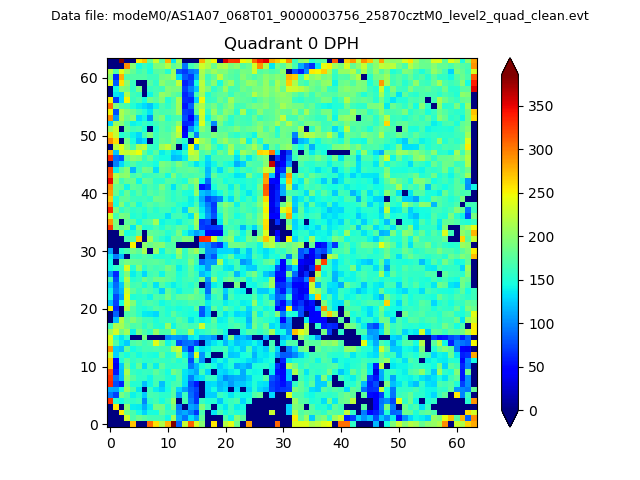 |
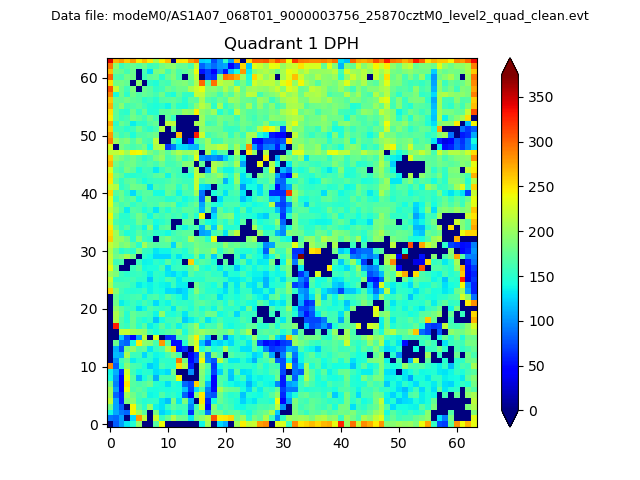 |
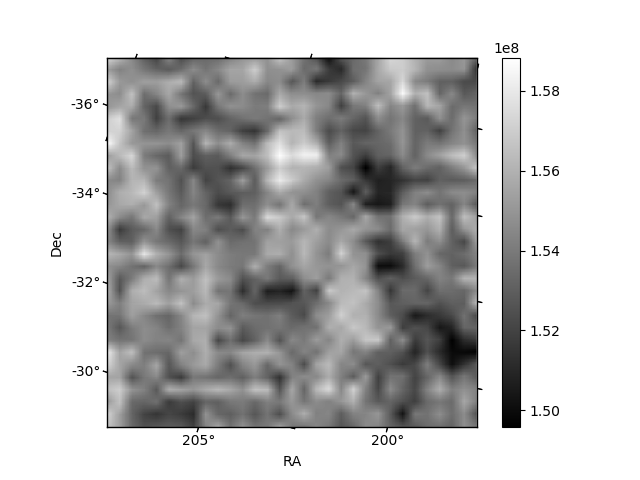
Quadrant B |
|---|---|---|---|
| Quadrant D | 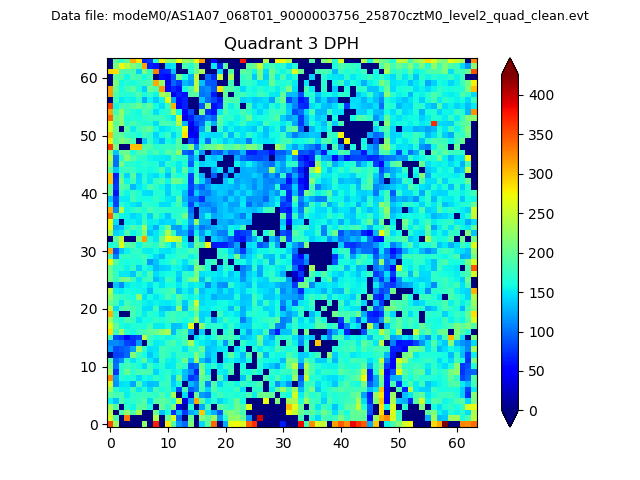 |
 |
Quadrant C |
| Plot type | Count rate plots | Images |
|---|---|---|
| Comparison with Poisson distribution Blue bars denote a histogram of data divided into 1 sec bins. Red curve is a Poisson curve with rate = median count rate of data. |
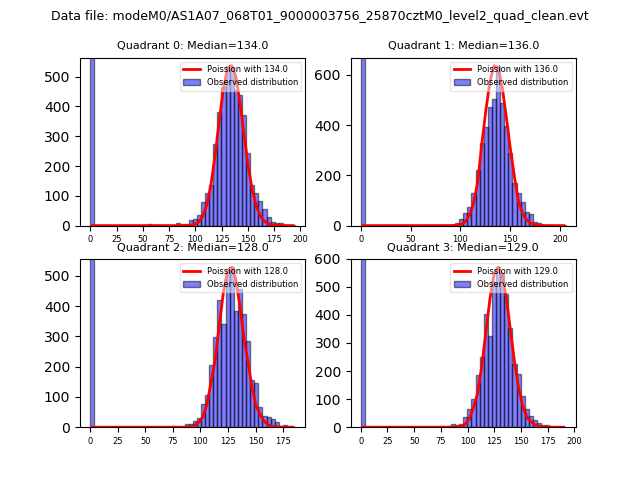 |
 |
| Quadrant-wise count rates Data is divided into 100 sec bins |
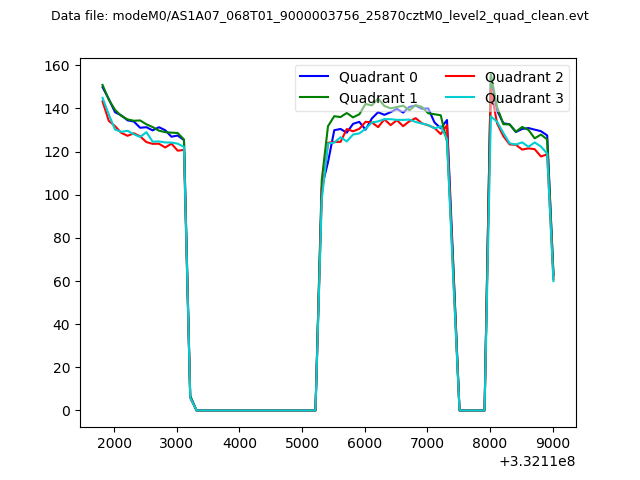 |
|
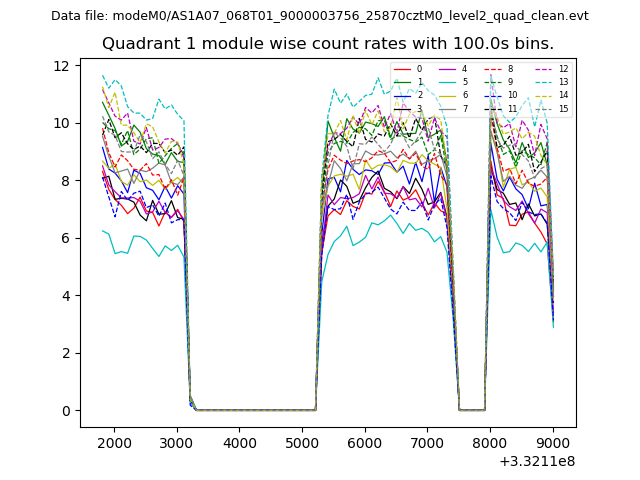
| Module-wise count rates for Quadrant A Data is divided into 100 sec bins |
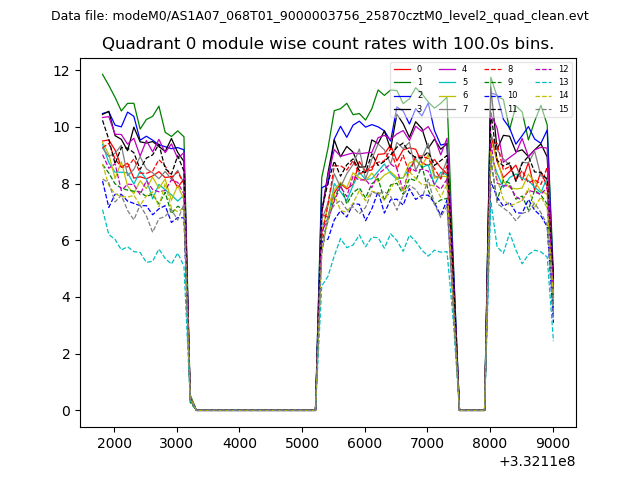 |
 |
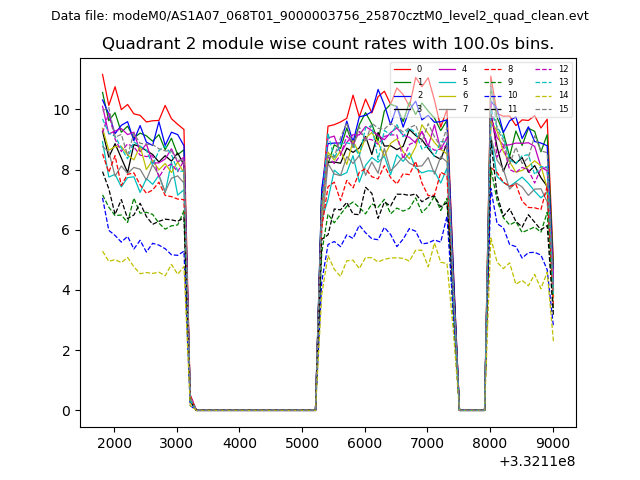
| Module-wise count rates for Quadrant B Data is divided into 100 sec bins |
 |
 |
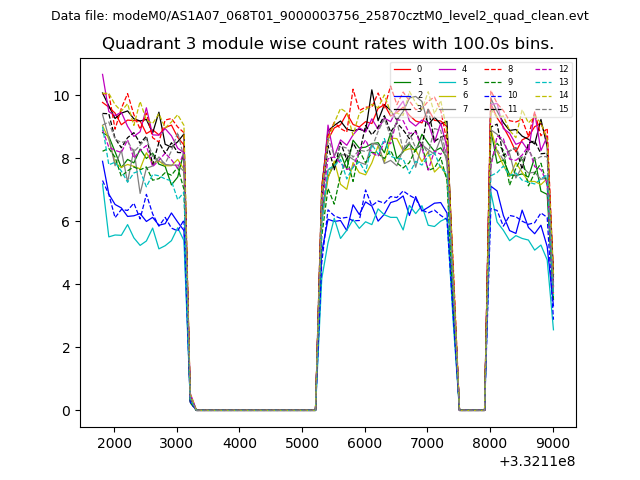
| Module-wise count rates for Quadrant C Data is divided into 100 sec bins |
 |
 |
| Module-wise count rates for Quadrant D Data is divided into 100 sec bins |
 |
 |
| Parameter | Plot |
|---|---|
| CZT HV Monitor | 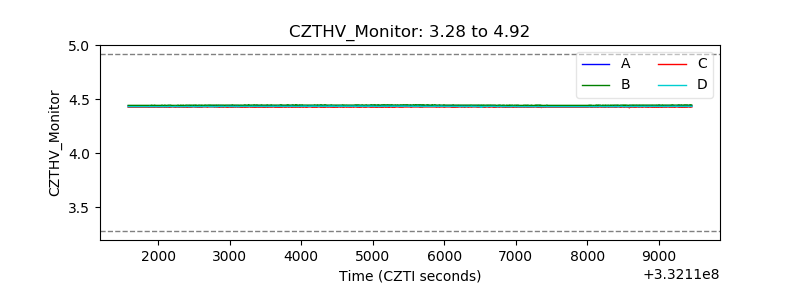 |
| D_VDD | 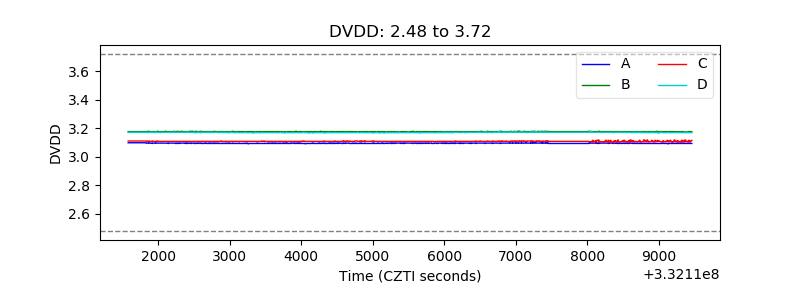 |
| Temperature 1 | 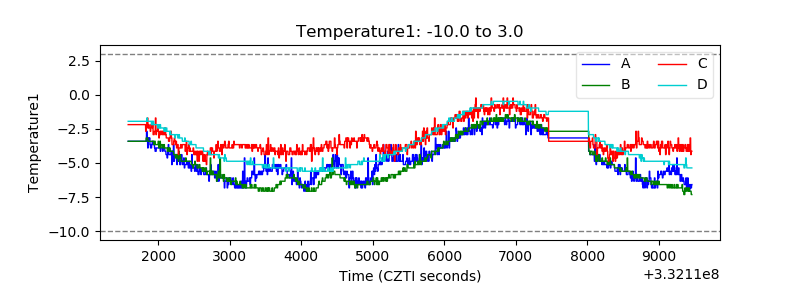 |
| Veto HV Monitor | 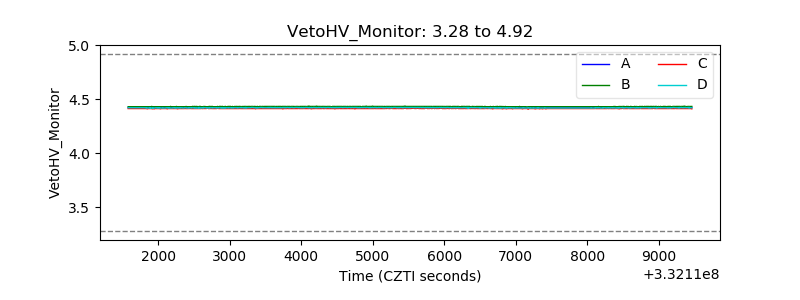 |
| Veto LLD | 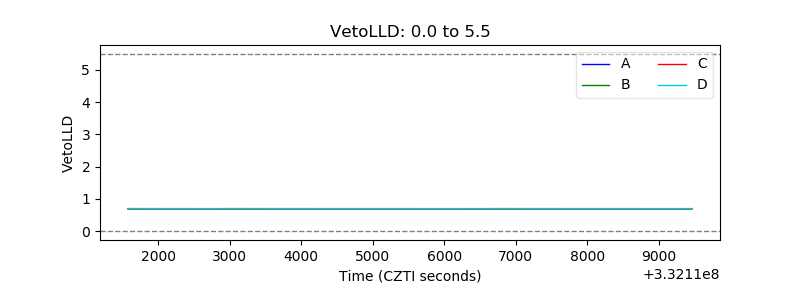 |
| Alpha Counter | 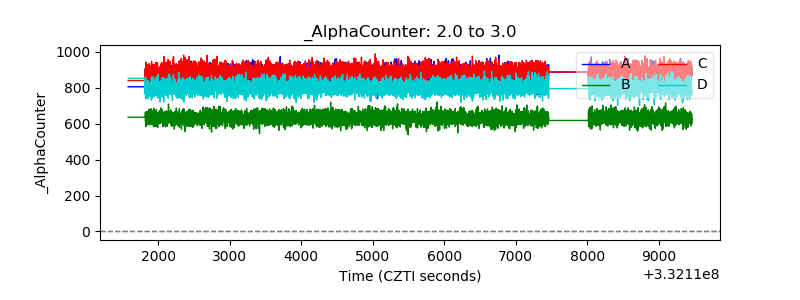 |
| _CPM_Rate | 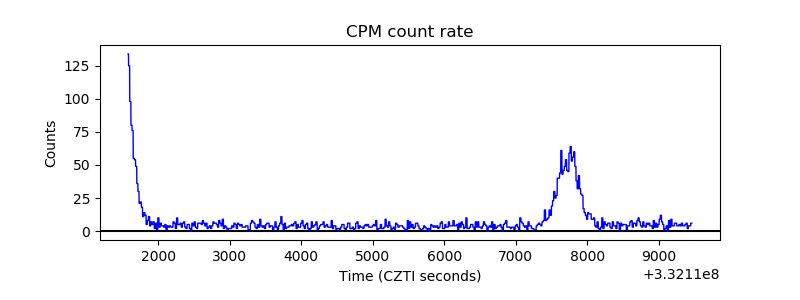 |
| CZT Counter | 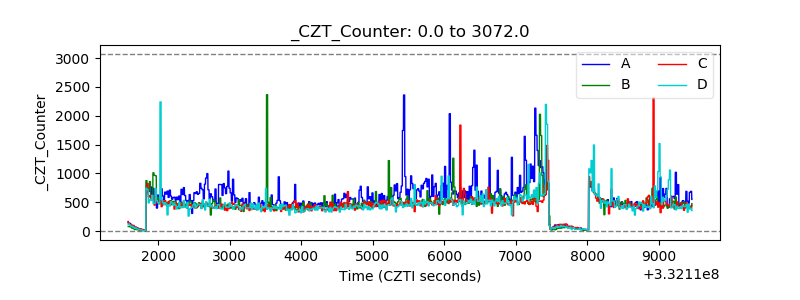 |
| +2.5 Volts monitor |  |
| +5 Volts monitor |  |
| _ROLL_ROT | 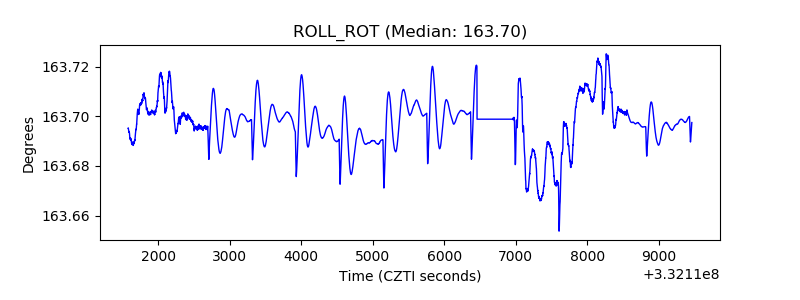 |
| _Roll_DEC | 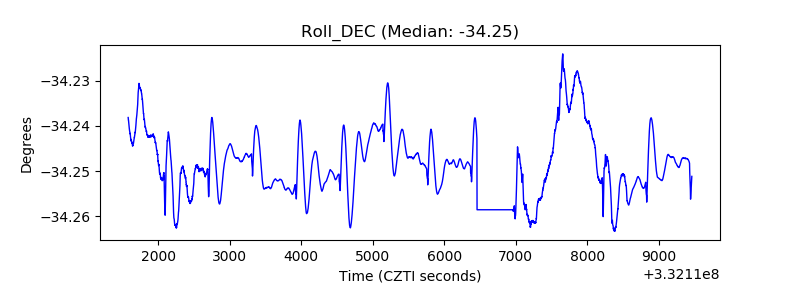 |
| _Roll_RA | 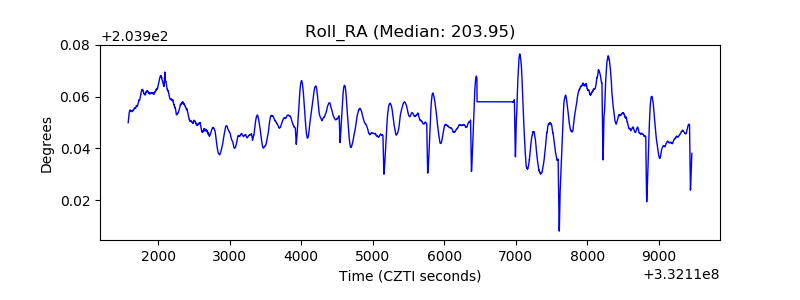 |
| Veto Counter | 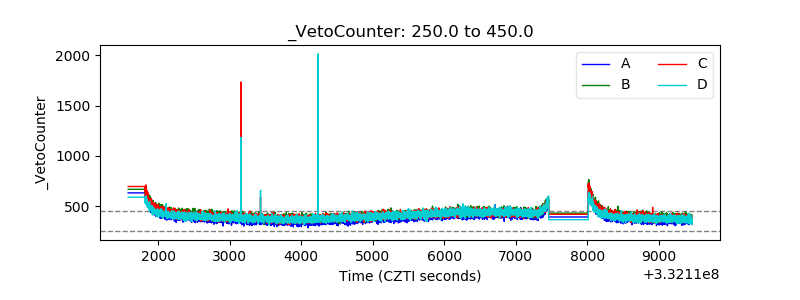 |