| Param | Original file | Final file |
|---|---|---|
| Filename | modeM0/AS1A07_068T01_9000003756_25871cztM0_level2.evt | modeM0/AS1A07_068T01_9000003756_25871cztM0_level2_quad_clean.evt |
| Size (bytes) | 588,479,040 | 103,763,520 |
| Size | 561.2 MB | 99.0 MB |
| Events in quadrant A | 4,617,432 | 662,923 |
| Events in quadrant B | 4,201,337 | 660,246 |
| Events in quadrant C | 3,941,375 | 633,886 |
| Events in quadrant D | 4,521,582 | 631,237 |
| Mode M0 | |||
|---|---|---|---|
| Quadrant | BADHDUFLAG | Total packets | Discarded packets |
| A | 0 | 18730 | 0 |
| B | 0 | 17612 | 0 |
| C | 0 | 16854 | 0 |
| D | 0 | 18905 | 0 |
| Mode M9 | |||
|---|---|---|---|
| Quadrant | BADHDUFLAG | Total packets | Discarded packets |
| A | 0 | 9 | 0 |
| B | 0 | 9 | 0 |
| C | 0 | 9 | 0 |
| D | 0 | 9 | 0 |
| Quadrant | Total seconds | Saturated seconds | Saturation percentage |
|---|---|---|---|
| A | 7967 | 134 | 1.681938% |
| B | 7967 | 232 | 2.912012% |
| C | 7967 | 133 | 1.669386% |
| D | 7967 | 164 | 2.058491% |
Noise dominated data is calculated using 1-second bins in cleaned event files. If a bin has >2000 counts, and if more than 50% of those come from <1% of pixels, then it is considered to be noise-dominated and hence unusable.
| Quadrant | # 1 sec bins | Bins with >0 counts | Bins with >2000 counts | High rate bins dominated by noise | Noise dominated (total time) | Noise dominated (detector-on time) | Marked lightcurve |
|---|---|---|---|---|---|---|---|
| A | 8842 | 7969 | 10 | 10 | 0.11% | 0.13% | 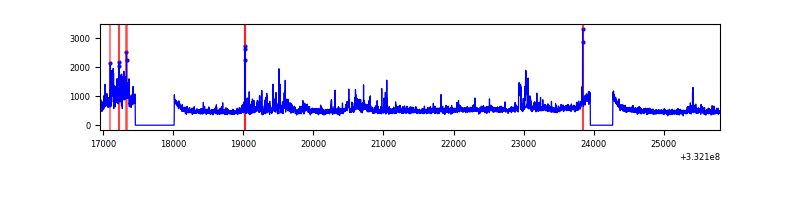 |
| B | 8842 | 7969 | 96 | 96 | 1.09% | 1.20% | 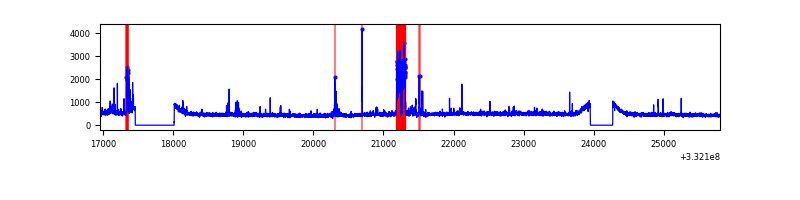 |
| C | 8842 | 7969 | 1 | 1 | 0.01% | 0.01% | 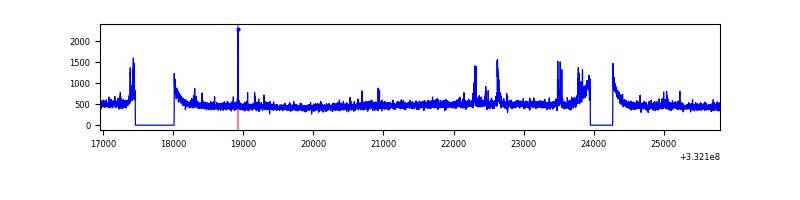 |
| D | 8842 | 7969 | 81 | 81 | 0.92% | 1.02% | 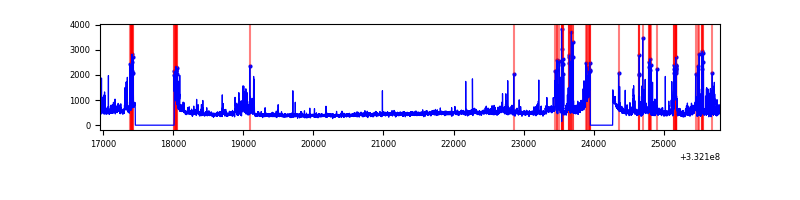 |
Top three noisy pixels from each quadrant. If the there are fewer than three noisy pixels in the level2.evt file, extra rows are filled as -1
| Pixel properties | Quadrant properties | ||||||
|---|---|---|---|---|---|---|---|
| Quadrant | DetID | PixID | Counts | Sigma | Mean | Median | Sigma |
| A | 0 | 13 | 833426 | 4193.42 | 981 | 960 | 198.5 |
| A | 13 | 254 | 11213 | 51.65 | 981 | 960 | 198.5 |
| A | 3 | 137 | 9395 | 42.49 | 981 | 960 | 198.5 |
| B | 10 | 245 | 393914 | 2102.22 | 966 | 939 | 186.9 |
| B | 12 | 111 | 23357 | 119.92 | 966 | 939 | 186.9 |
| B | 11 | 111 | 21280 | 108.81 | 966 | 939 | 186.9 |
| C | 14 | 238 | 147669 | 673.32 | 927 | 933 | 217.9 |
| C | 3 | 233 | 138900 | 633.08 | 927 | 933 | 217.9 |
| C | 14 | 128 | 28029 | 124.33 | 927 | 933 | 217.9 |
| D | 1 | 52 | 810850 | 3604.04 | 934 | 909 | 224.7 |
| D | 12 | 233 | 102552 | 452.29 | 934 | 909 | 224.7 |
| D | 7 | 80 | 52102 | 227.8 | 934 | 909 | 224.7 |
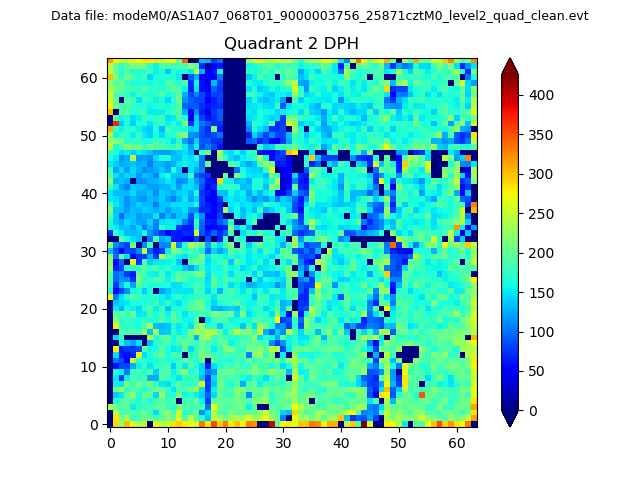
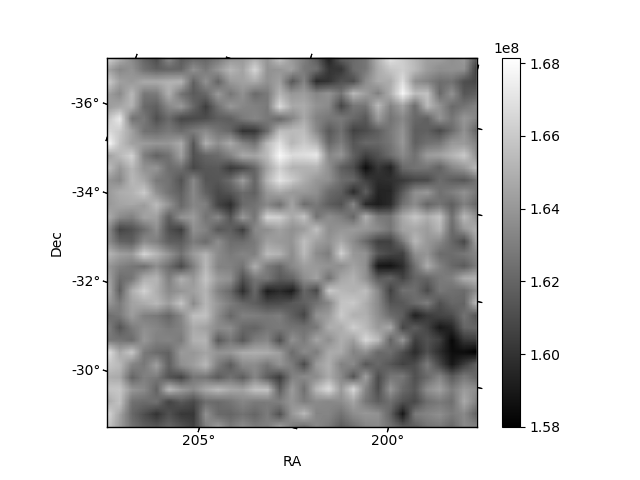
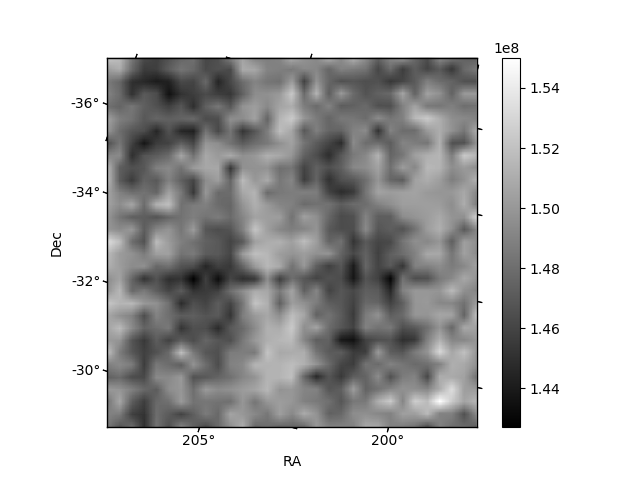
Histogram calculated using DETX and DETY for each event in the final _common_clean file
| Quadrant A | 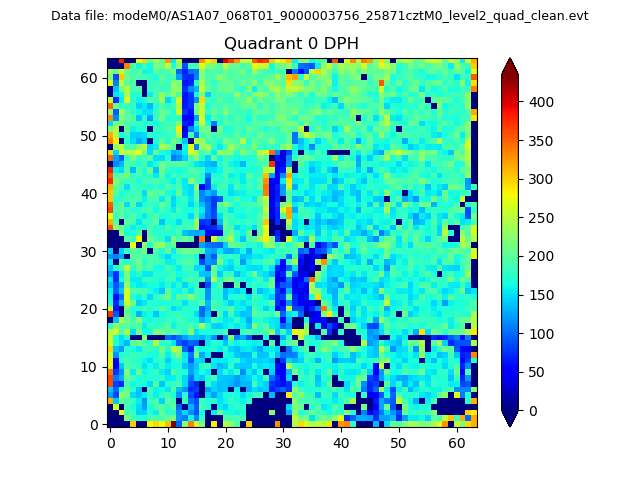 |
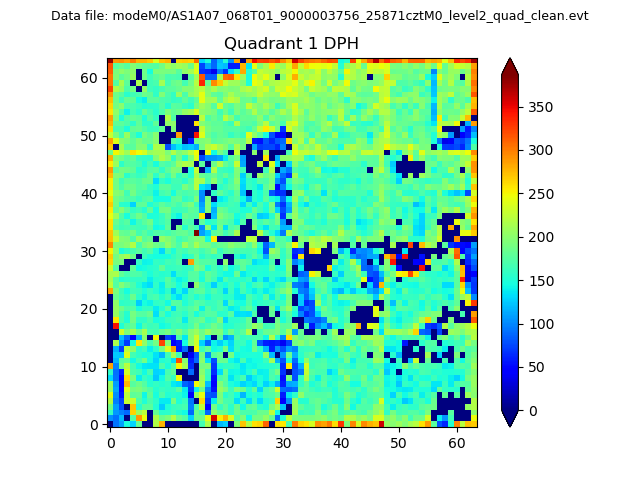 |
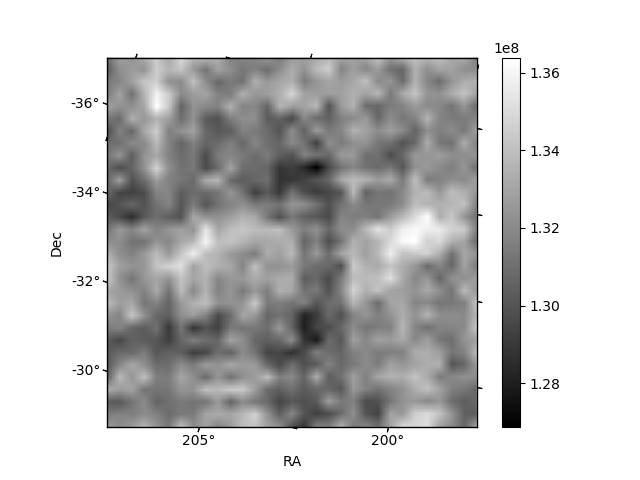
Quadrant B |
|---|---|---|---|
| Quadrant D | 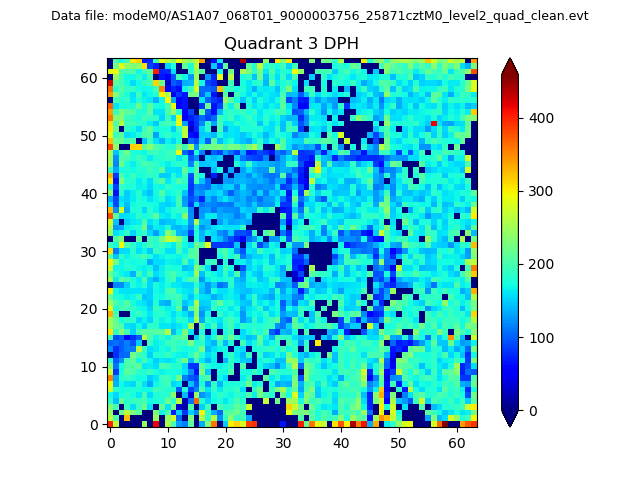 |
 |
Quadrant C |
| Plot type | Count rate plots | Images |
|---|---|---|
| Comparison with Poisson distribution Blue bars denote a histogram of data divided into 1 sec bins. Red curve is a Poisson curve with rate = median count rate of data. |
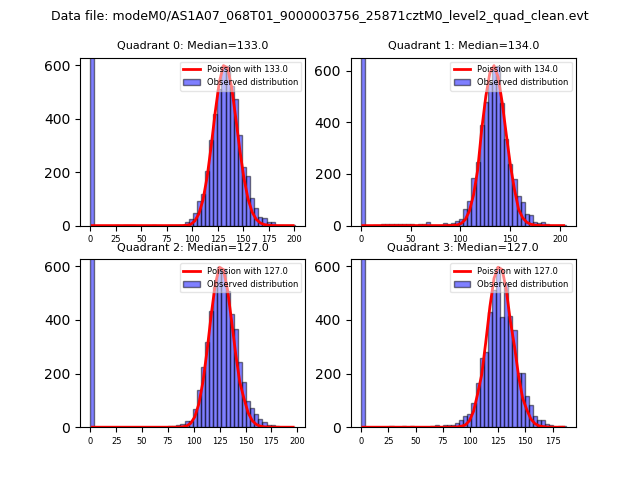 |
 |
| Quadrant-wise count rates Data is divided into 100 sec bins |
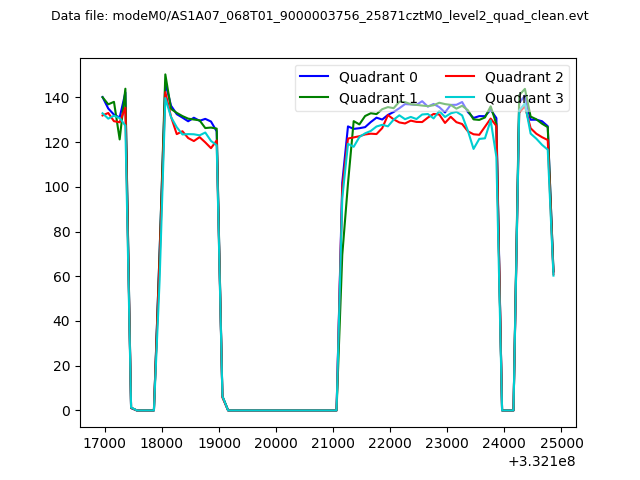 |
|
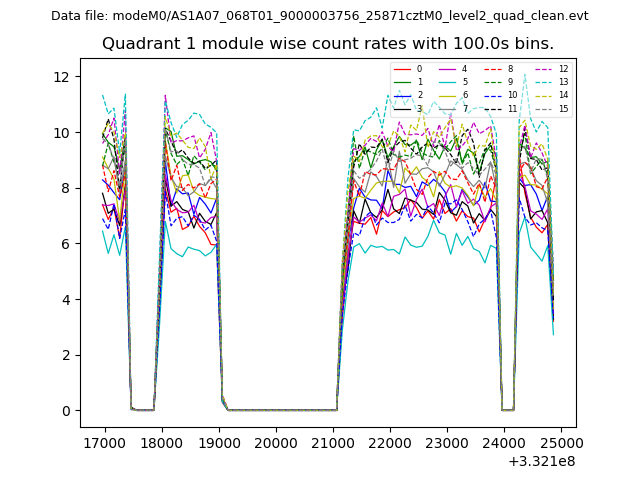
| Module-wise count rates for Quadrant A Data is divided into 100 sec bins |
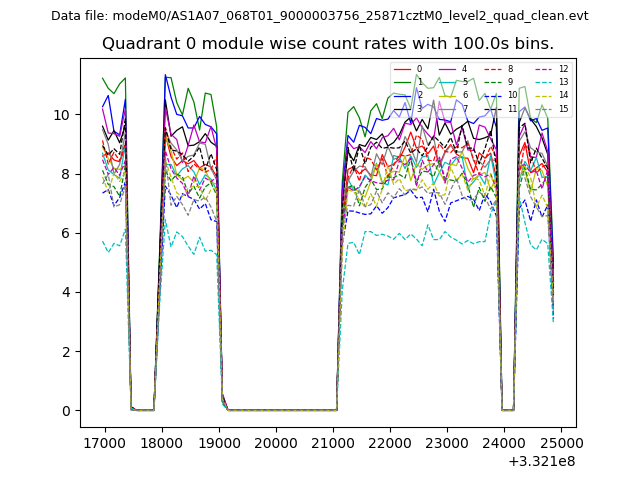 |
 |
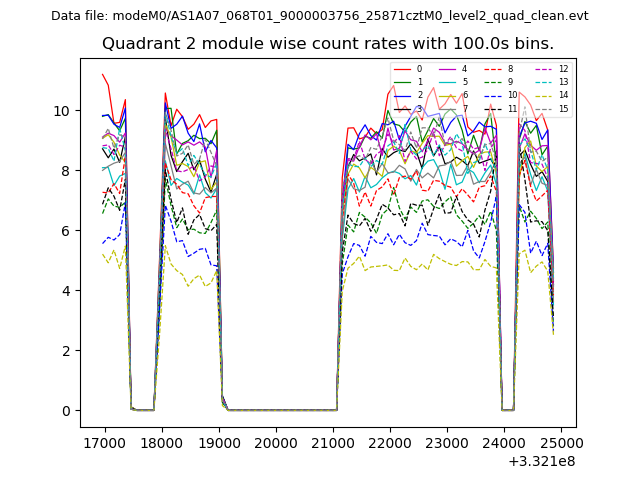
| Module-wise count rates for Quadrant B Data is divided into 100 sec bins |
 |
 |
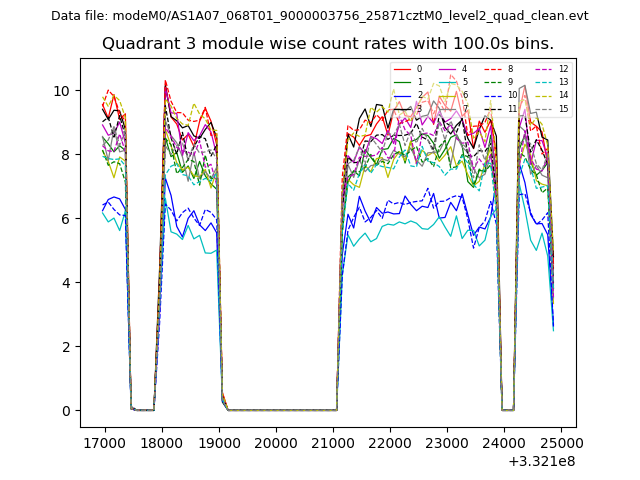
| Module-wise count rates for Quadrant C Data is divided into 100 sec bins |
 |
 |
| Module-wise count rates for Quadrant D Data is divided into 100 sec bins |
 |
 |
| Parameter | Plot |
|---|---|
| CZT HV Monitor | 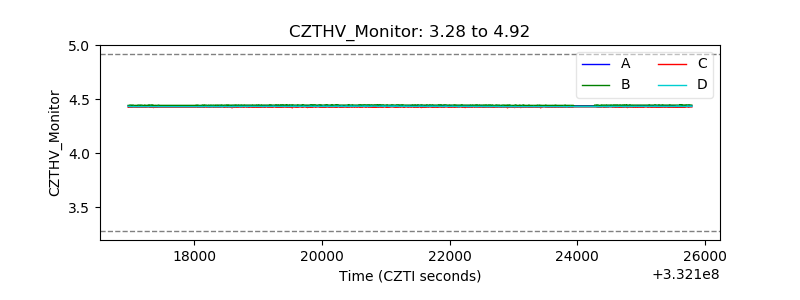 |
| D_VDD | 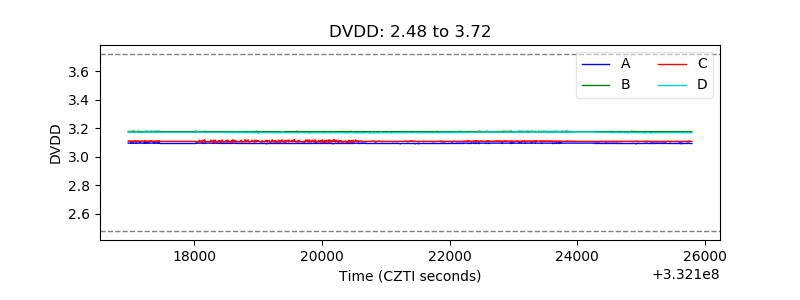 |
| Temperature 1 | 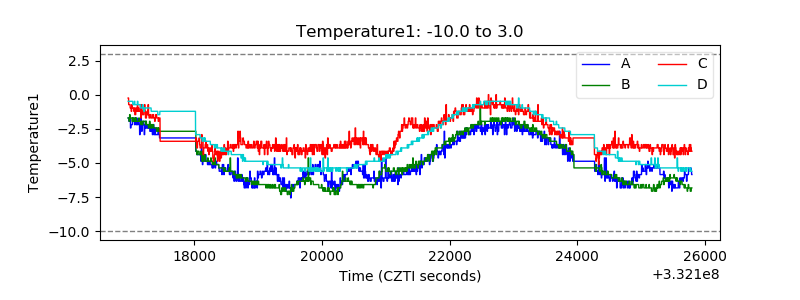 |
| Veto HV Monitor | 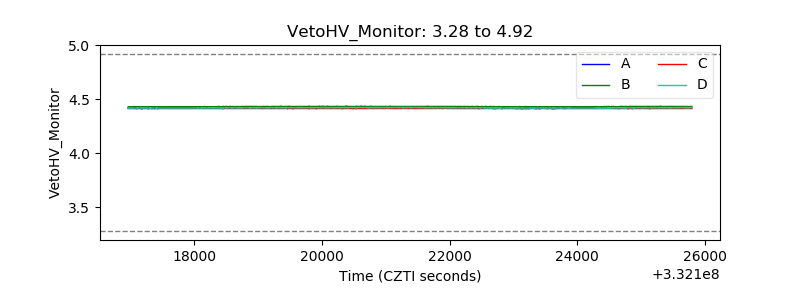 |
| Veto LLD | 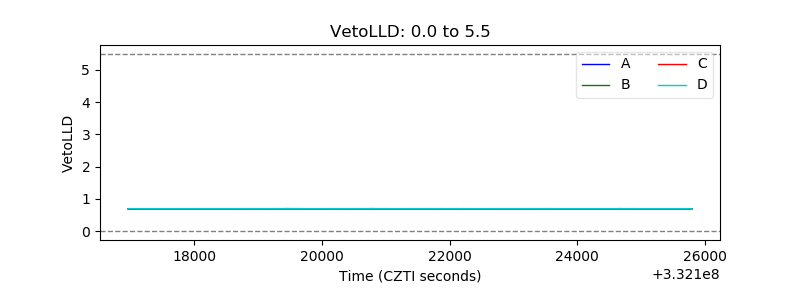 |
| Alpha Counter | 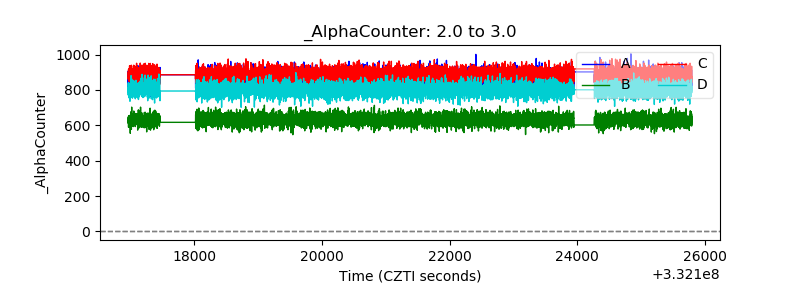 |
| _CPM_Rate | 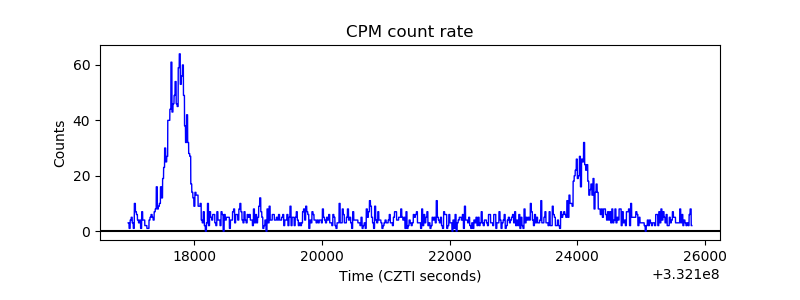 |
| CZT Counter | 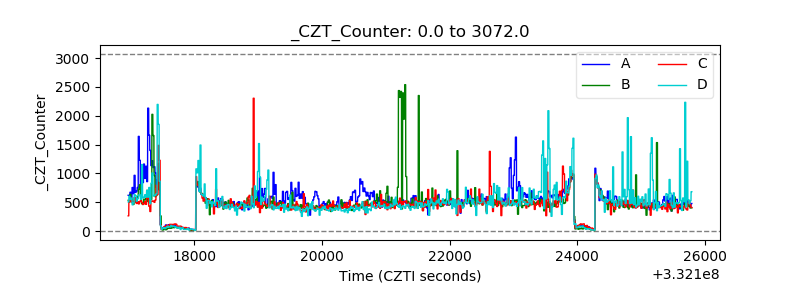 |
| +2.5 Volts monitor |  |
| +5 Volts monitor |  |
| _ROLL_ROT | 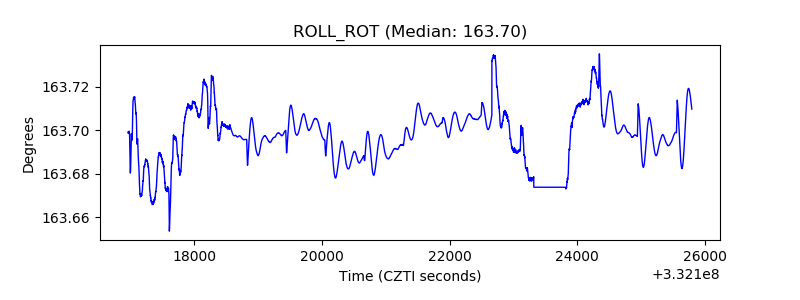 |
| _Roll_DEC | 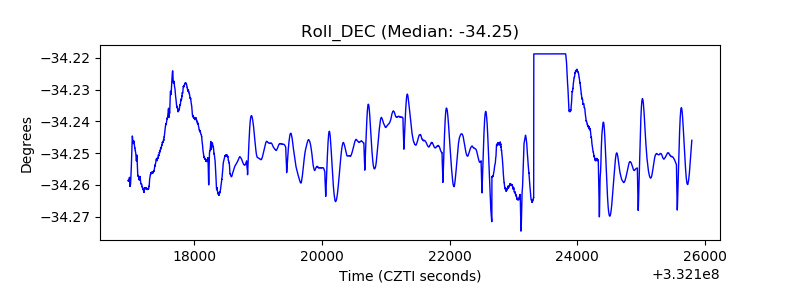 |
| _Roll_RA | 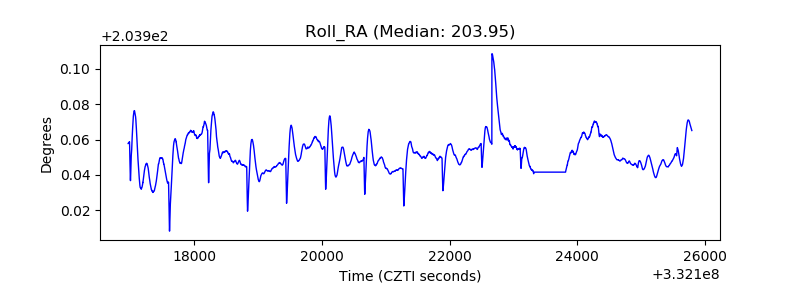 |
| Veto Counter | 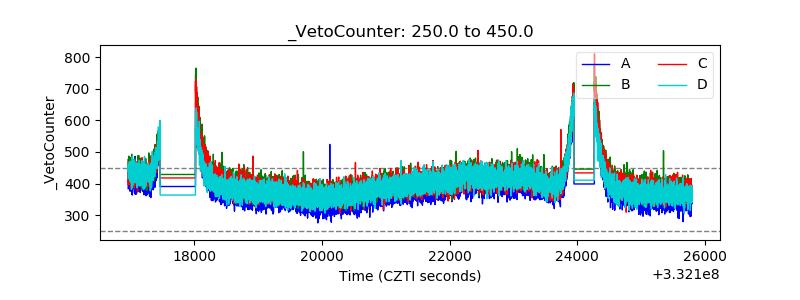 |