| Param | Original file | Final file |
|---|---|---|
| Filename | modeM0/AS1A07_068T01_9000003756_25872cztM0_level2.evt | modeM0/AS1A07_068T01_9000003756_25872cztM0_level2_quad_clean.evt |
| Size (bytes) | 587,295,360 | 87,295,680 |
| Size | 560.1 MB | 83.3 MB |
| Events in quadrant A | 3,695,857 | 547,263 |
| Events in quadrant B | 3,809,198 | 544,041 |
| Events in quadrant C | 3,817,482 | 519,340 |
| Events in quadrant D | 5,952,619 | 508,277 |
| Mode M0 | |||
|---|---|---|---|
| Quadrant | BADHDUFLAG | Total packets | Discarded packets |
| A | 0 | 15794 | 0 |
| B | 0 | 16202 | 0 |
| C | 0 | 16223 | 0 |
| D | 0 | 22876 | 0 |
| Mode M9 | |||
|---|---|---|---|
| Quadrant | BADHDUFLAG | Total packets | Discarded packets |
| A | 0 | 7 | 0 |
| B | 0 | 7 | 0 |
| C | 0 | 7 | 0 |
| D | 0 | 7 | 0 |
| Quadrant | Total seconds | Saturated seconds | Saturation percentage |
|---|---|---|---|
| A | 7537 | 111 | 1.472735% |
| B | 7538 | 184 | 2.440966% |
| C | 7538 | 167 | 2.215442% |
| D | 7538 | 499 | 6.619793% |
Noise dominated data is calculated using 1-second bins in cleaned event files. If a bin has >2000 counts, and if more than 50% of those come from <1% of pixels, then it is considered to be noise-dominated and hence unusable.
| Quadrant | # 1 sec bins | Bins with >0 counts | Bins with >2000 counts | High rate bins dominated by noise | Noise dominated (total time) | Noise dominated (detector-on time) | Marked lightcurve |
|---|---|---|---|---|---|---|---|
| A | 8257 | 7539 | 2 | 2 | 0.02% | 0.03% | 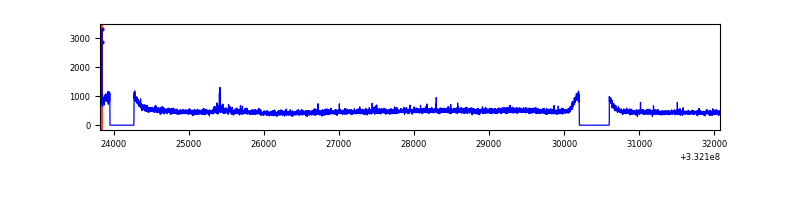 |
| B | 8258 | 7540 | 28 | 28 | 0.34% | 0.37% | 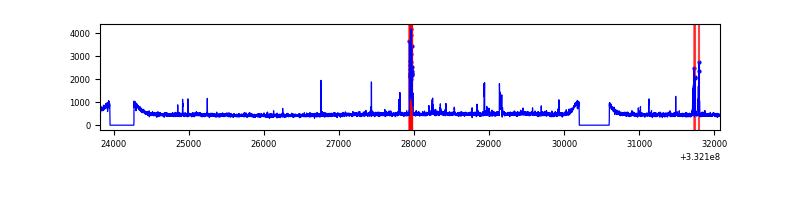 |
| C | 8258 | 7540 | 4 | 4 | 0.05% | 0.05% | 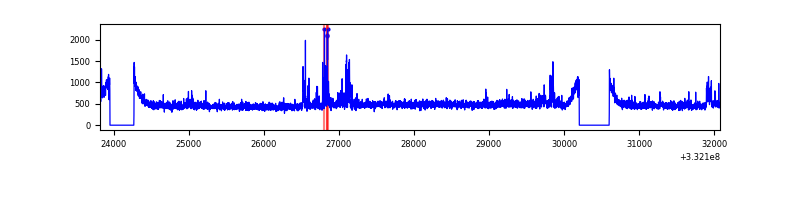 |
| D | 8258 | 7540 | 361 | 361 | 4.37% | 4.79% | 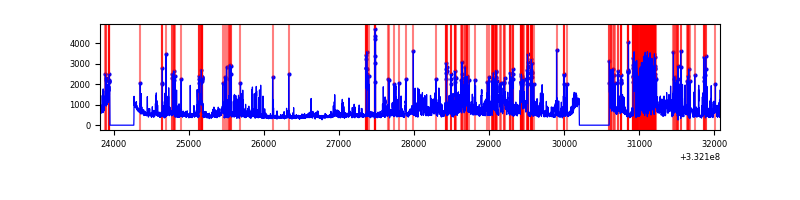 |
Top three noisy pixels from each quadrant. If the there are fewer than three noisy pixels in the level2.evt file, extra rows are filled as -1
| Pixel properties | Quadrant properties | ||||||
|---|---|---|---|---|---|---|---|
| Quadrant | DetID | PixID | Counts | Sigma | Mean | Median | Sigma |
| A | 0 | 13 | 122114 | 643.44 | 927 | 906 | 188.4 |
| A | 13 | 254 | 11999 | 58.89 | 927 | 906 | 188.4 |
| A | 3 | 137 | 9035 | 43.15 | 927 | 906 | 188.4 |
| B | 10 | 245 | 191569 | 1074.34 | 914 | 888 | 177.5 |
| B | 12 | 111 | 22682 | 122.79 | 914 | 888 | 177.5 |
| B | 11 | 111 | 20148 | 108.51 | 914 | 888 | 177.5 |
| C | 3 | 233 | 250719 | 1196.71 | 877 | 882 | 208.8 |
| C | 14 | 238 | 137504 | 654.41 | 877 | 882 | 208.8 |
| C | 14 | 128 | 11100 | 48.94 | 877 | 882 | 208.8 |
| D | 1 | 52 | 1896121 | 9073.22 | 870 | 847 | 208.9 |
| D | 7 | 80 | 650225 | 3108.76 | 870 | 847 | 208.9 |
| D | 12 | 233 | 108908 | 517.32 | 870 | 847 | 208.9 |
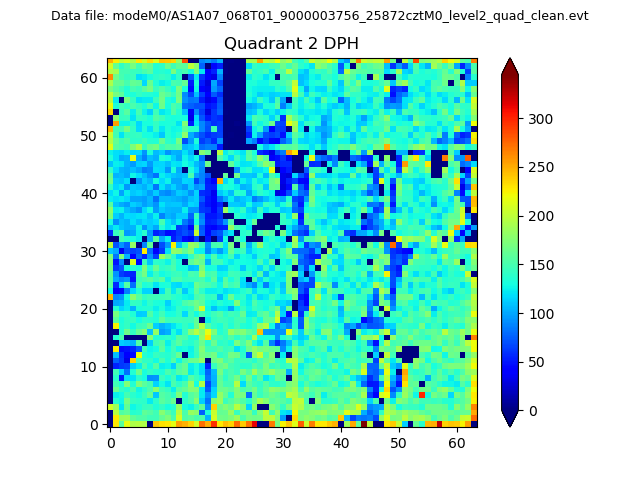
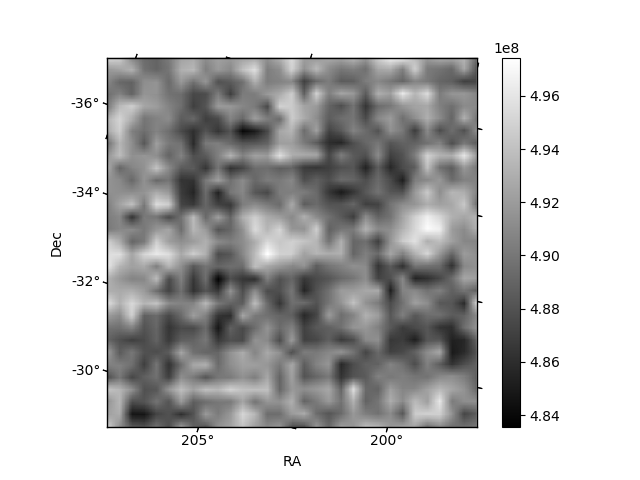
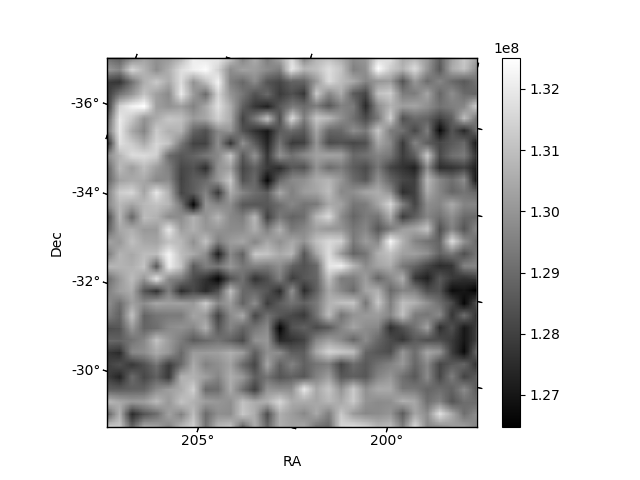
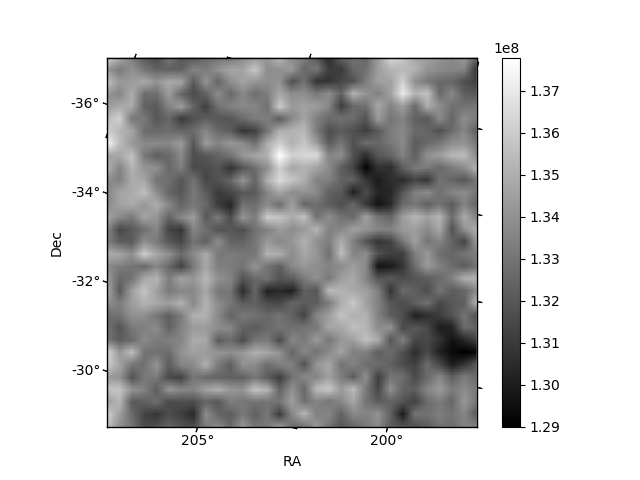
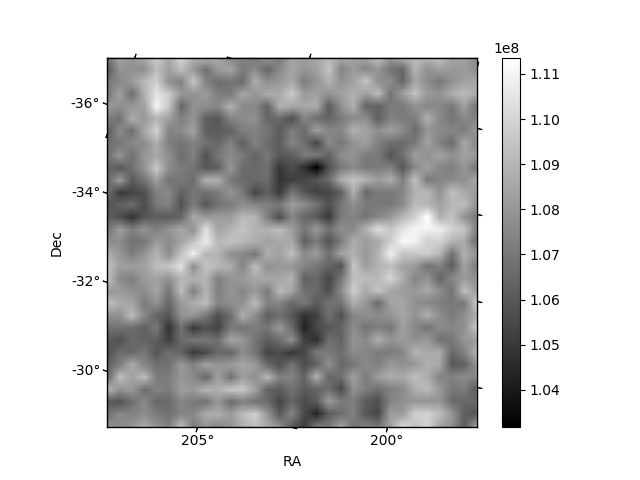
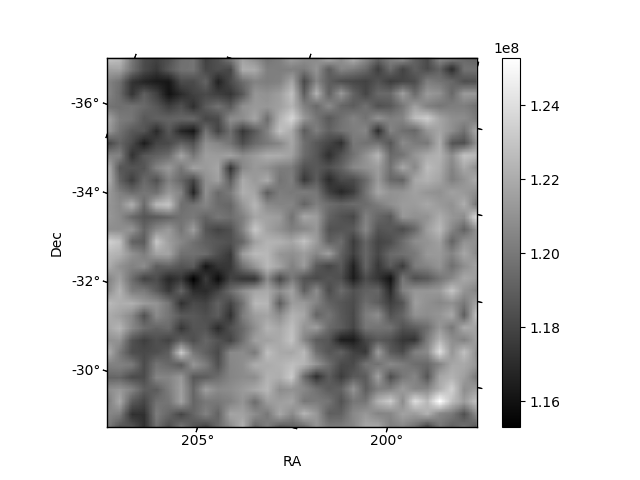
Histogram calculated using DETX and DETY for each event in the final _common_clean file
| Quadrant A | 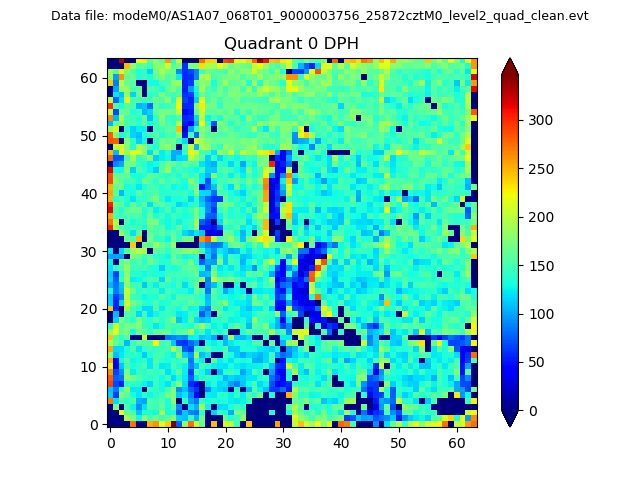 |
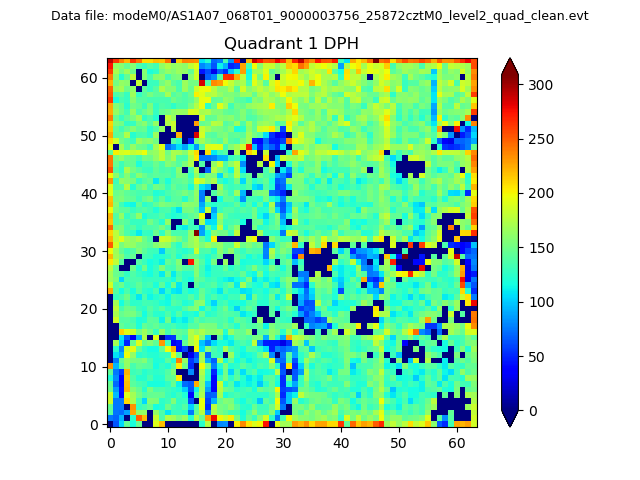 |
Quadrant B |
|---|---|---|---|
| Quadrant D | 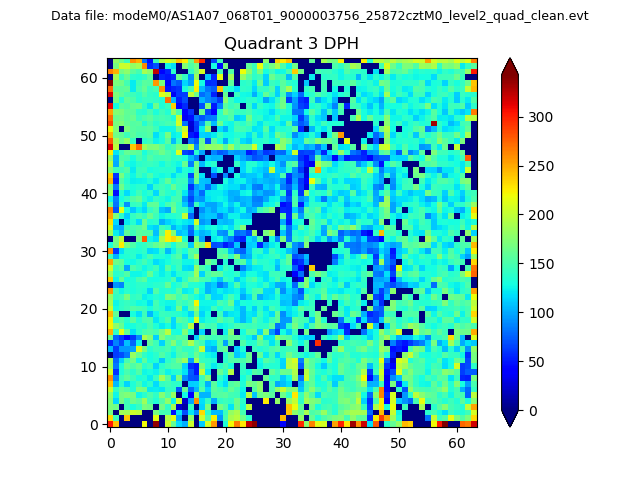 |
 |
Quadrant C |
| Plot type | Count rate plots | Images |
|---|---|---|
| Comparison with Poisson distribution Blue bars denote a histogram of data divided into 1 sec bins. Red curve is a Poisson curve with rate = median count rate of data. |
 |
 |
| Quadrant-wise count rates Data is divided into 100 sec bins |
 |
|
| Module-wise count rates for Quadrant A Data is divided into 100 sec bins |
 |
 |
| Module-wise count rates for Quadrant B Data is divided into 100 sec bins |
 |
 |
| Module-wise count rates for Quadrant C Data is divided into 100 sec bins |
 |
 |
| Module-wise count rates for Quadrant D Data is divided into 100 sec bins |
 |
 |
| Parameter | Plot |
|---|---|
| CZT HV Monitor |  |
| D_VDD | 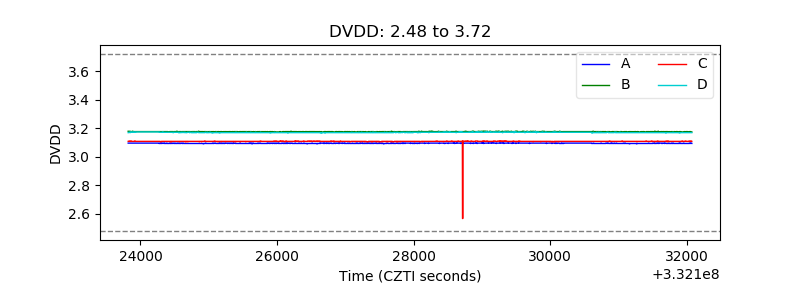 |
| Temperature 1 | 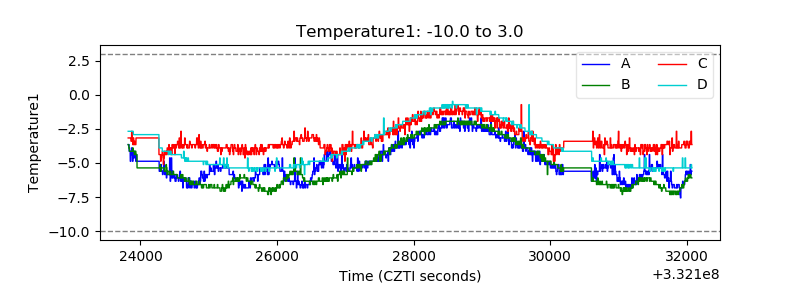 |
| Veto HV Monitor | 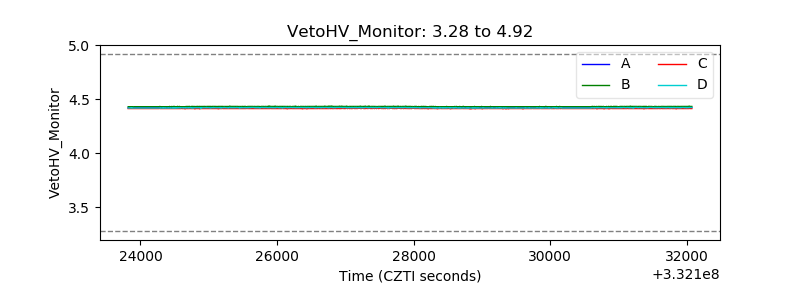 |
| Veto LLD | 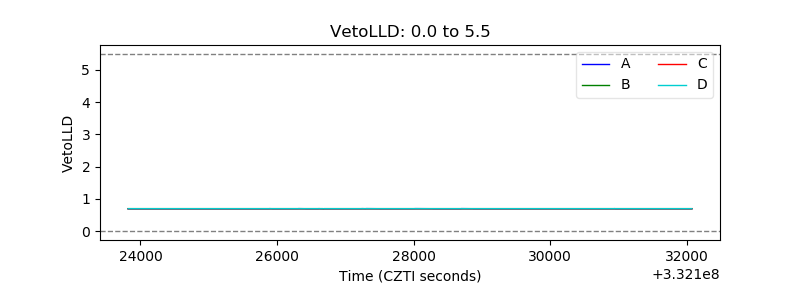 |
| Alpha Counter |  |
| _CPM_Rate |  |
| CZT Counter | 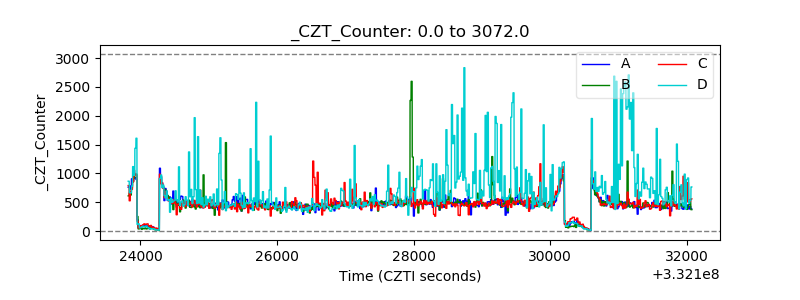 |
| +2.5 Volts monitor |  |
| +5 Volts monitor |  |
| _ROLL_ROT |  |
| _Roll_DEC | 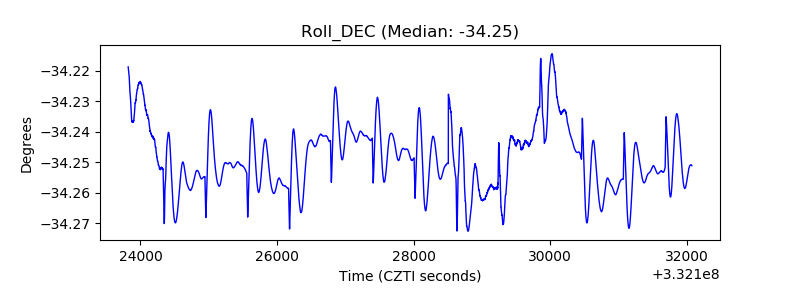 |
| _Roll_RA | 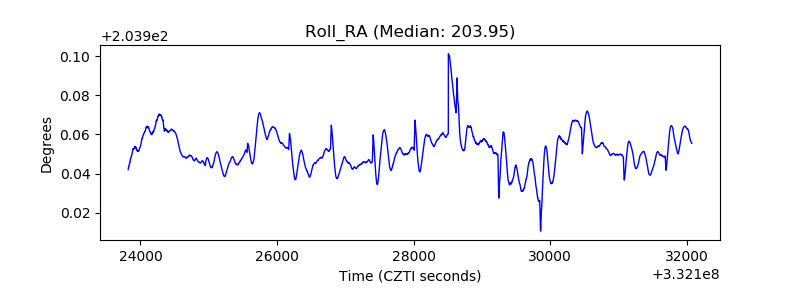 |
| Veto Counter |  |