| Param | Original file | Final file |
|---|---|---|
| Filename | modeM0/AS1A07_068T01_9000003756_25876cztM0_level2.evt | modeM0/AS1A07_068T01_9000003756_25876cztM0_level2_quad_clean.evt |
| Size (bytes) | 638,838,720 | 92,952,000 |
| Size | 609.2 MB | 88.6 MB |
| Events in quadrant A | 3,405,703 | 621,058 |
| Events in quadrant B | 3,600,515 | 620,292 |
| Events in quadrant C | 3,577,919 | 590,807 |
| Events in quadrant D | 8,331,640 | 537,476 |
| Mode M0 | |||
|---|---|---|---|
| Quadrant | BADHDUFLAG | Total packets | Discarded packets |
| A | 0 | 14255 | 0 |
| B | 0 | 14718 | 0 |
| C | 0 | 14753 | 0 |
| D | 0 | 29189 | 0 |
| Mode M9 | |||
|---|---|---|---|
| Quadrant | BADHDUFLAG | Total packets | Discarded packets |
| A | 0 | 9 | 0 |
| B | 0 | 9 | 0 |
| C | 0 | 9 | 0 |
| D | 0 | 9 | 0 |
| Quadrant | Total seconds | Saturated seconds | Saturation percentage |
|---|---|---|---|
| A | 6375 | 62 | 0.972549% |
| B | 6375 | 151 | 2.368627% |
| C | 6375 | 173 | 2.713725% |
| D | 6374 | 1587 | 24.898023% |
Noise dominated data is calculated using 1-second bins in cleaned event files. If a bin has >2000 counts, and if more than 50% of those come from <1% of pixels, then it is considered to be noise-dominated and hence unusable.
| Quadrant | # 1 sec bins | Bins with >0 counts | Bins with >2000 counts | High rate bins dominated by noise | Noise dominated (total time) | Noise dominated (detector-on time) | Marked lightcurve |
|---|---|---|---|---|---|---|---|
| A | 7350 | 6376 | 0 | 0 | 0.00% | 0.00% | 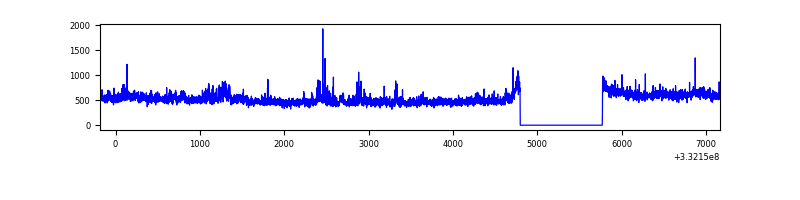 |
| B | 7350 | 6376 | 38 | 38 | 0.52% | 0.60% | 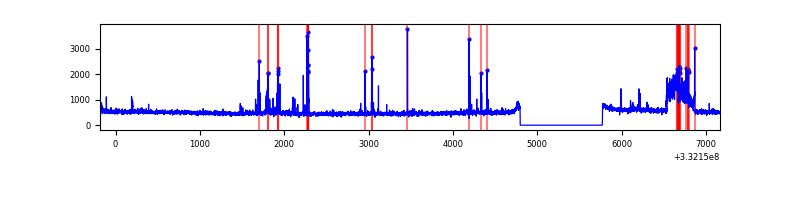 |
| C | 7350 | 6376 | 23 | 23 | 0.31% | 0.36% | 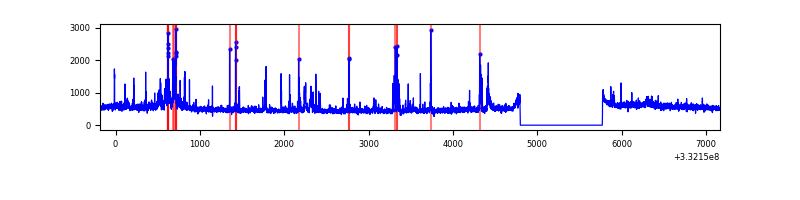 |
| D | 7349 | 6375 | 1464 | 1464 | 19.92% | 22.96% | 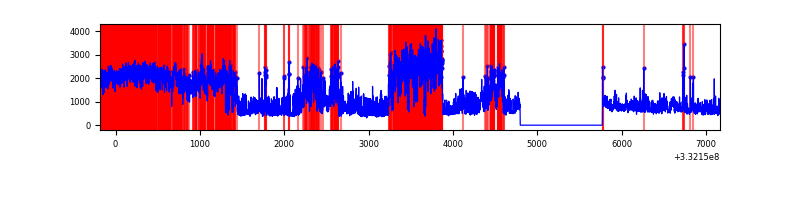 |
Top three noisy pixels from each quadrant. If the there are fewer than three noisy pixels in the level2.evt file, extra rows are filled as -1
| Pixel properties | Quadrant properties | ||||||
|---|---|---|---|---|---|---|---|
| Quadrant | DetID | PixID | Counts | Sigma | Mean | Median | Sigma |
| A | 0 | 13 | 278727 | 1706.58 | 811 | 796 | 162.9 |
| A | 13 | 254 | 9373 | 52.67 | 811 | 796 | 162.9 |
| A | 3 | 137 | 7378 | 40.42 | 811 | 796 | 162.9 |
| B | 10 | 245 | 414325 | 2698.88 | 795 | 775 | 153.2 |
| B | 5 | 172 | 32538 | 207.29 | 795 | 775 | 153.2 |
| B | 0 | 219 | 29270 | 185.96 | 795 | 775 | 153.2 |
| C | 3 | 233 | 450938 | 2520.88 | 768 | 775 | 178.6 |
| C | 14 | 238 | 123119 | 685.12 | 768 | 775 | 178.6 |
| C | 2 | 16 | 7902 | 39.91 | 768 | 775 | 178.6 |
| D | 7 | 80 | 3226339 | 18362.33 | 735 | 718 | 175.7 |
| D | 12 | 233 | 1276650 | 7263.43 | 735 | 718 | 175.7 |
| D | 7 | 223 | 909368 | 5172.63 | 735 | 718 | 175.7 |
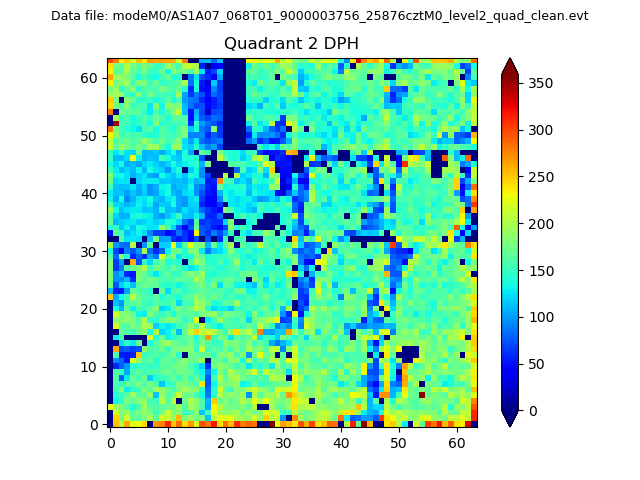
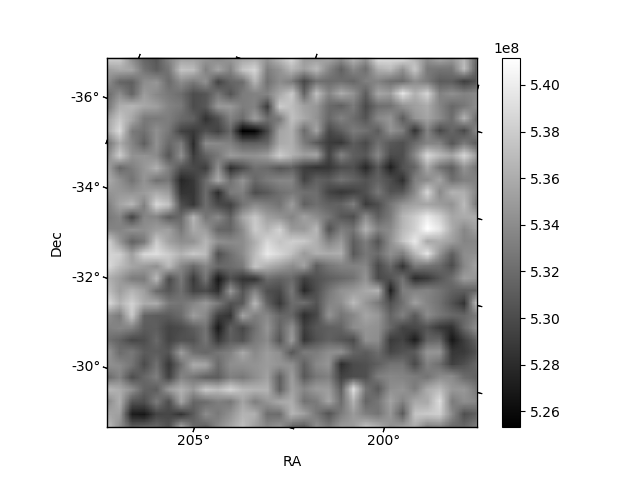
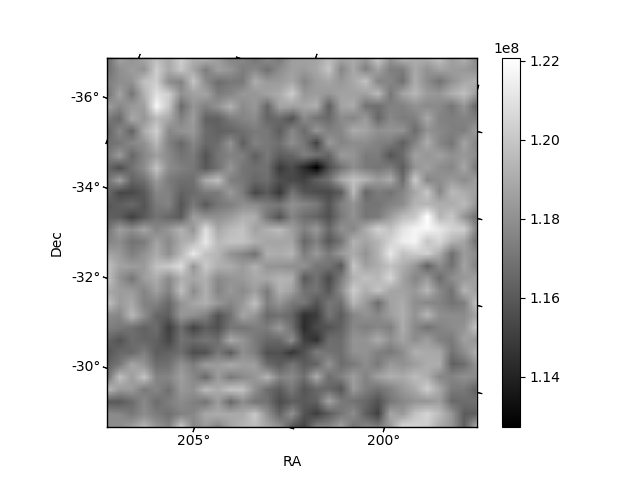
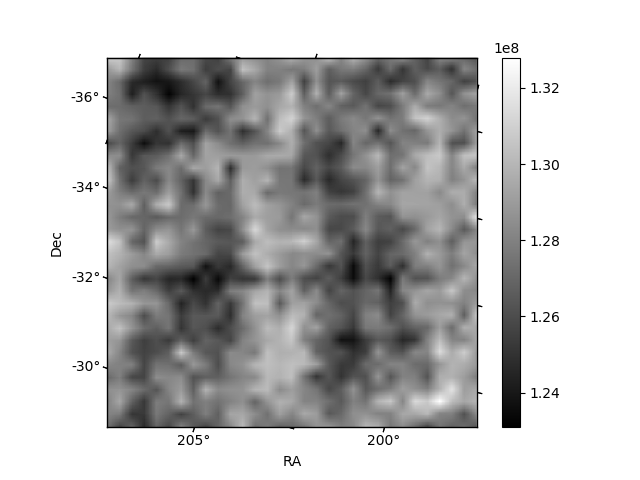
Histogram calculated using DETX and DETY for each event in the final _common_clean file
| Quadrant A | 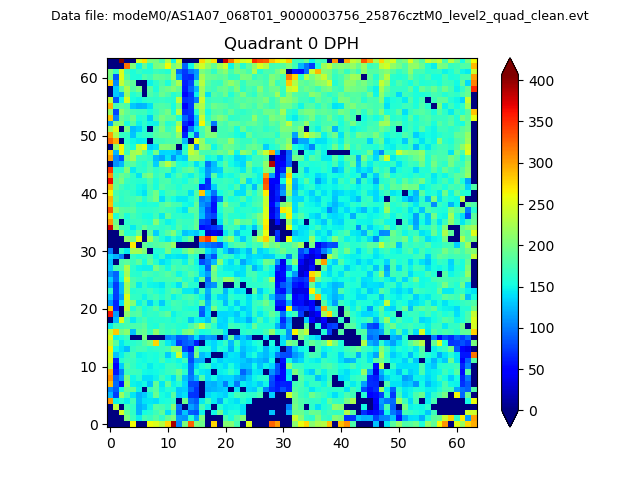 |
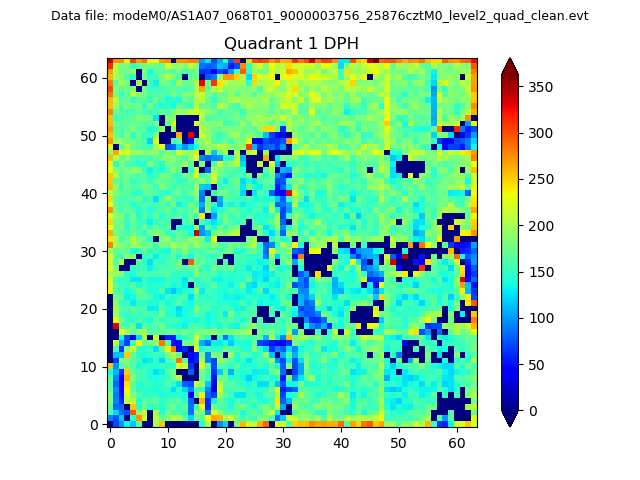 |
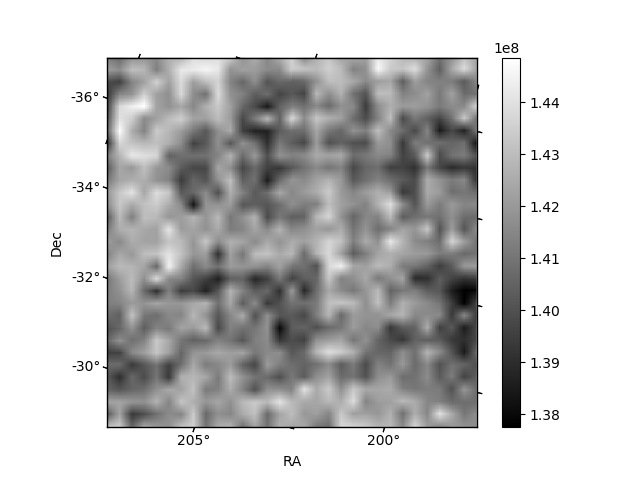
Quadrant B |
|---|---|---|---|
| Quadrant D | 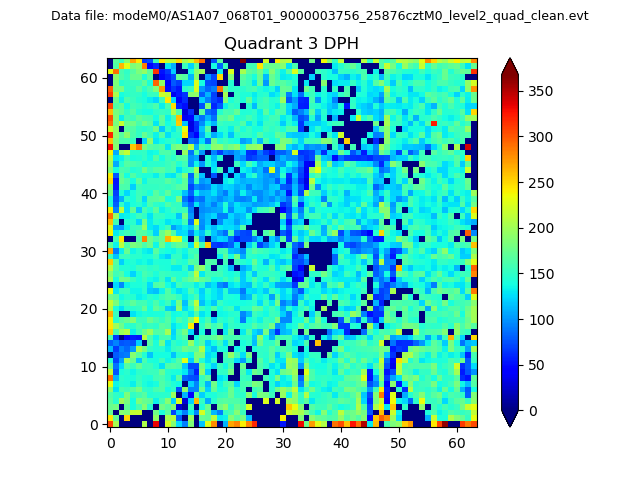 |
 |
Quadrant C |
| Plot type | Count rate plots | Images |
|---|---|---|
| Comparison with Poisson distribution Blue bars denote a histogram of data divided into 1 sec bins. Red curve is a Poisson curve with rate = median count rate of data. |
 |
 |
| Quadrant-wise count rates Data is divided into 100 sec bins |
 |
|
| Module-wise count rates for Quadrant A Data is divided into 100 sec bins |
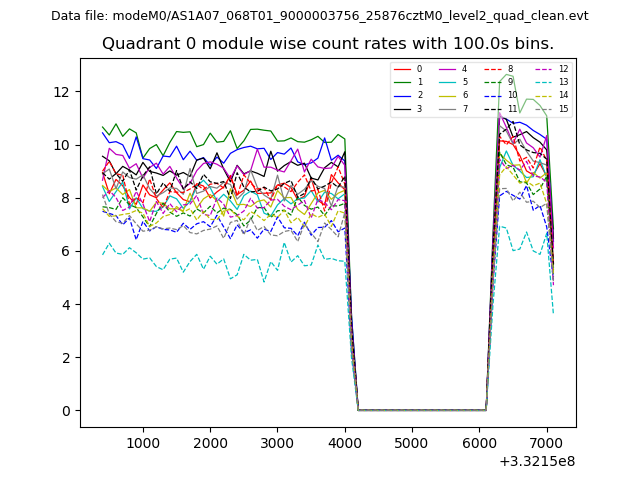 |
 |
| Module-wise count rates for Quadrant B Data is divided into 100 sec bins |
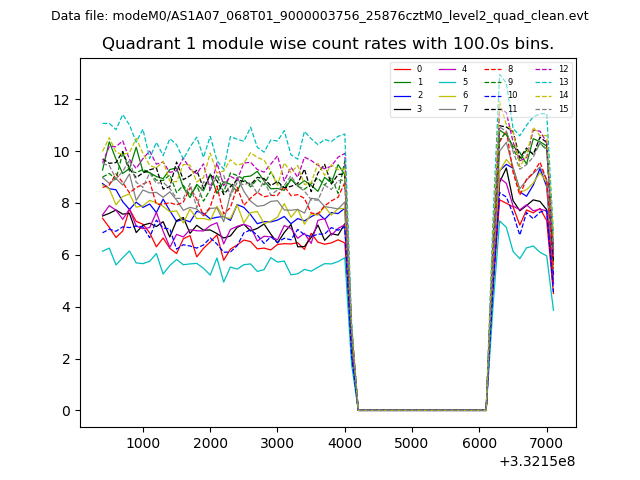 |
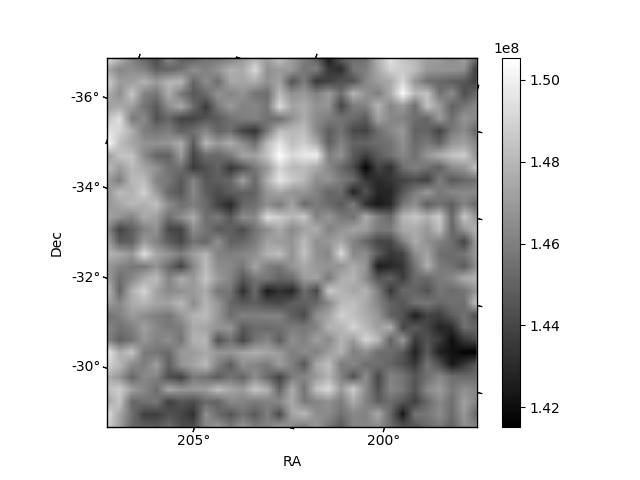 |
| Module-wise count rates for Quadrant C Data is divided into 100 sec bins |
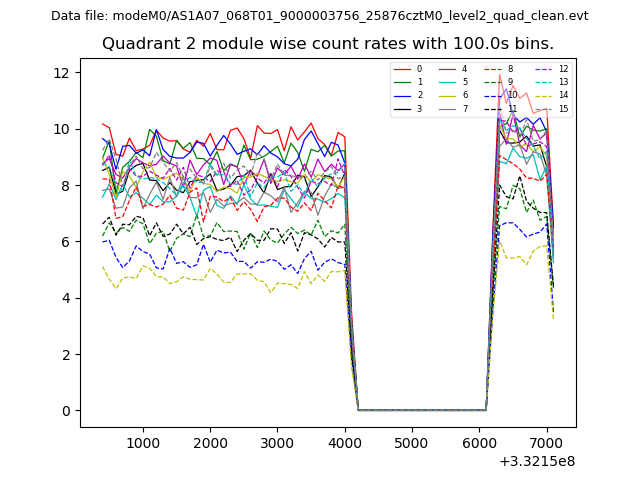 |
 |
| Module-wise count rates for Quadrant D Data is divided into 100 sec bins |
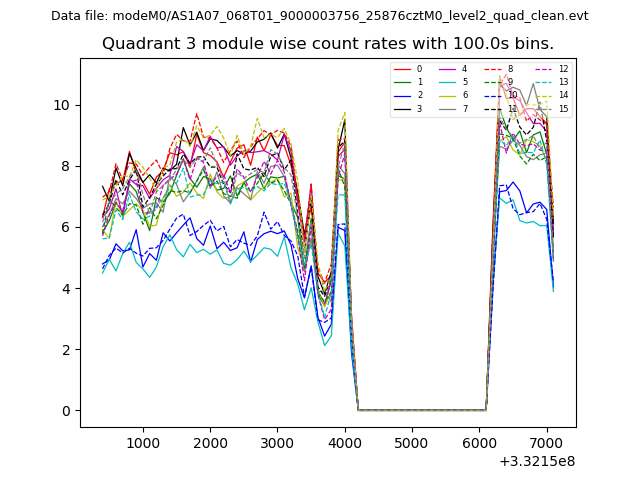 |
 |
| Parameter | Plot |
|---|---|
| CZT HV Monitor | 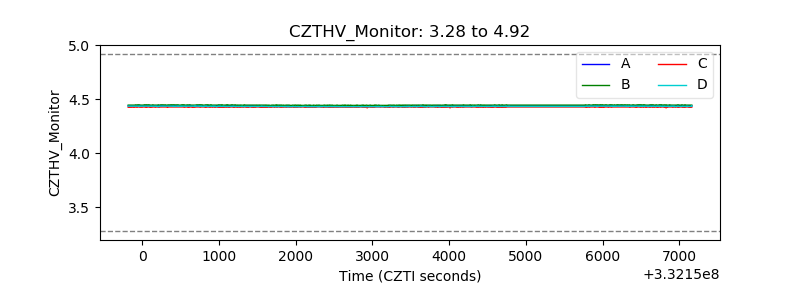 |
| D_VDD | 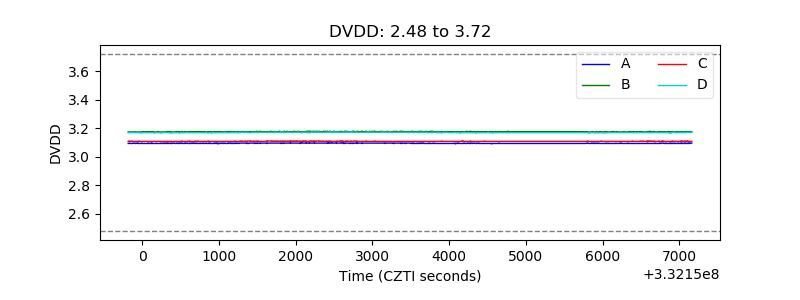 |
| Temperature 1 | 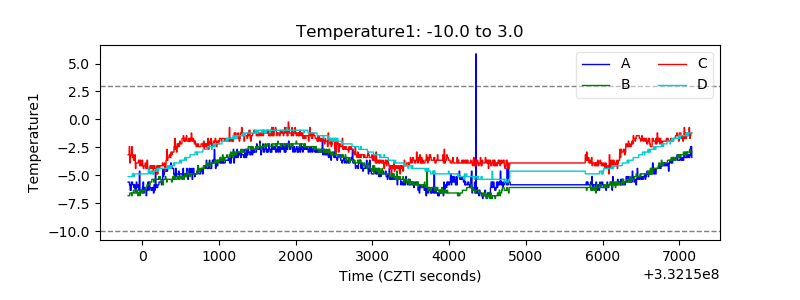 |
| Veto HV Monitor | 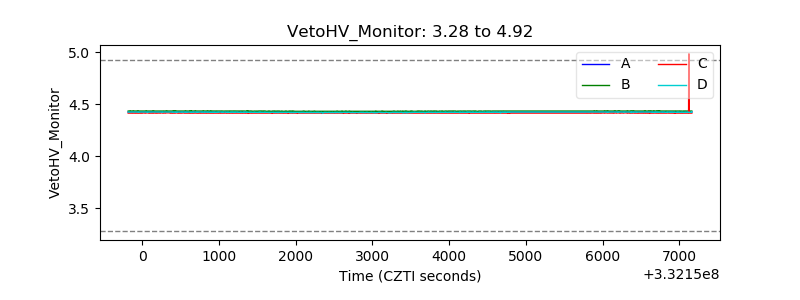 |
| Veto LLD | 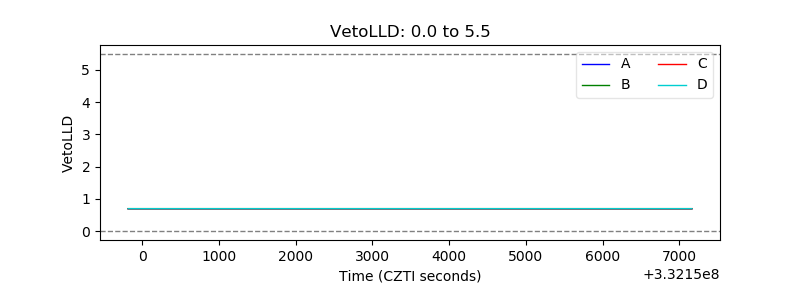 |
| Alpha Counter |  |
| _CPM_Rate |  |
| CZT Counter | 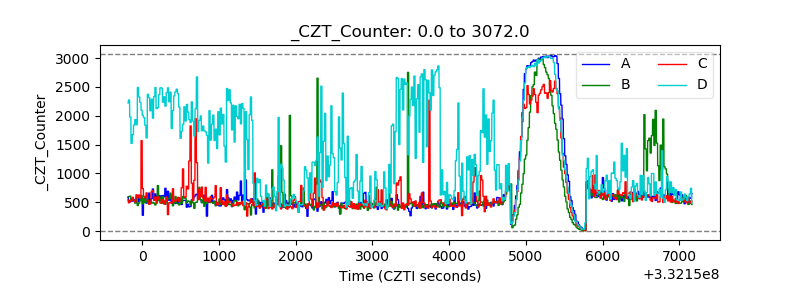 |
| +2.5 Volts monitor |  |
| +5 Volts monitor |  |
| _ROLL_ROT | 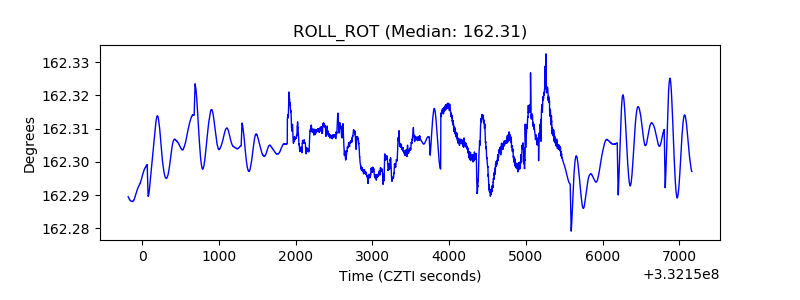 |
| _Roll_DEC | 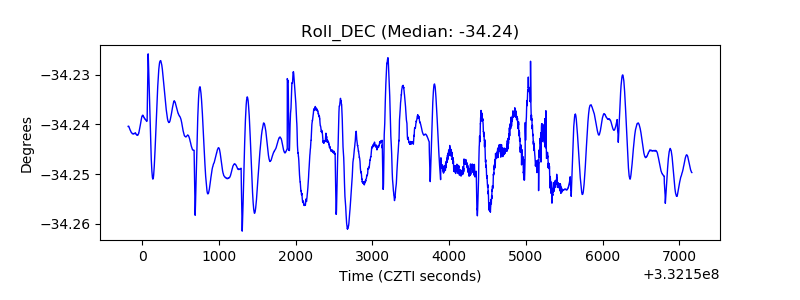 |
| _Roll_RA | 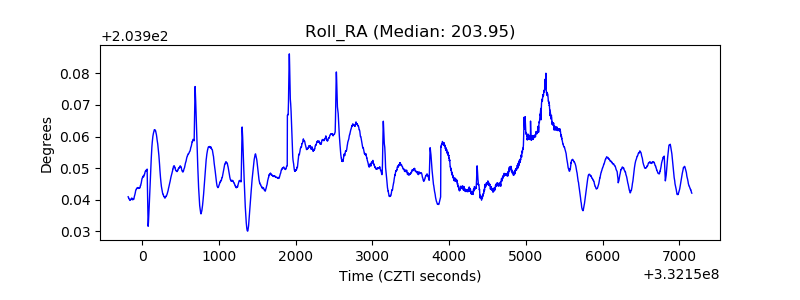 |
| Veto Counter | 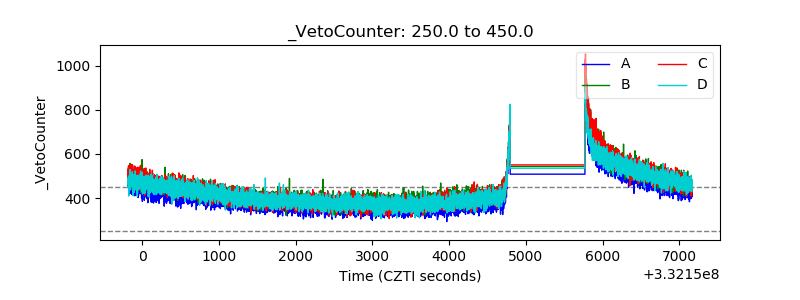 |