| Param | Original file | Final file |
|---|---|---|
| Filename | modeM0/AS1A07_068T01_9000003756_25878cztM0_level2.evt | modeM0/AS1A07_068T01_9000003756_25878cztM0_level2_quad_clean.evt |
| Size (bytes) | 605,658,240 | 111,018,240 |
| Size | 577.6 MB | 105.9 MB |
| Events in quadrant A | 5,534,144 | 705,736 |
| Events in quadrant B | 3,645,887 | 769,861 |
| Events in quadrant C | 3,401,092 | 731,115 |
| Events in quadrant D | 5,333,101 | 713,685 |
| Mode M0 | |||
|---|---|---|---|
| Quadrant | BADHDUFLAG | Total packets | Discarded packets |
| A | 0 | 20615 | 0 |
| B | 0 | 14928 | 0 |
| C | 0 | 14184 | 0 |
| D | 0 | 20355 | 0 |
| Mode M9 | |||
|---|---|---|---|
| Quadrant | BADHDUFLAG | Total packets | Discarded packets |
| A | 0 | 12 | 0 |
| B | 0 | 12 | 0 |
| C | 0 | 12 | 0 |
| D | 0 | 12 | 0 |
| Quadrant | Total seconds | Saturated seconds | Saturation percentage |
|---|---|---|---|
| A | 6328 | 759 | 11.994311% |
| B | 6329 | 145 | 2.291041% |
| C | 6328 | 121 | 1.912137% |
| D | 6326 | 457 | 7.224154% |
Noise dominated data is calculated using 1-second bins in cleaned event files. If a bin has >2000 counts, and if more than 50% of those come from <1% of pixels, then it is considered to be noise-dominated and hence unusable.
| Quadrant | # 1 sec bins | Bins with >0 counts | Bins with >2000 counts | High rate bins dominated by noise | Noise dominated (total time) | Noise dominated (detector-on time) | Marked lightcurve |
|---|---|---|---|---|---|---|---|
| A | 7465 | 6330 | 555 | 555 | 7.43% | 8.77% | 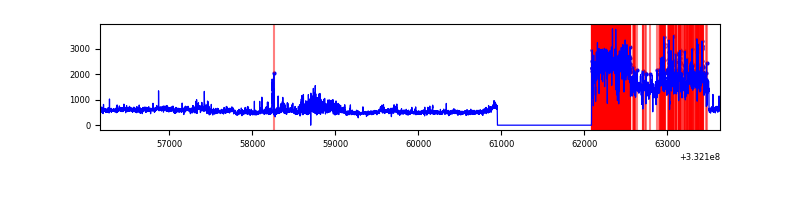 |
| B | 7465 | 6331 | 43 | 43 | 0.58% | 0.68% | 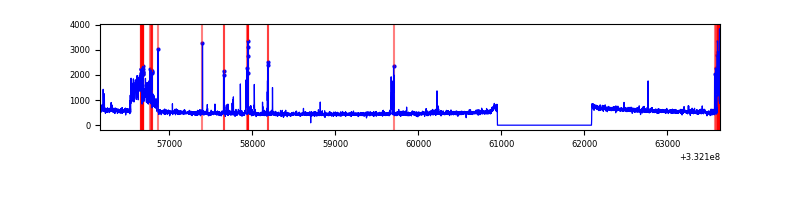 |
| C | 7465 | 6330 | 2 | 2 | 0.03% | 0.03% | 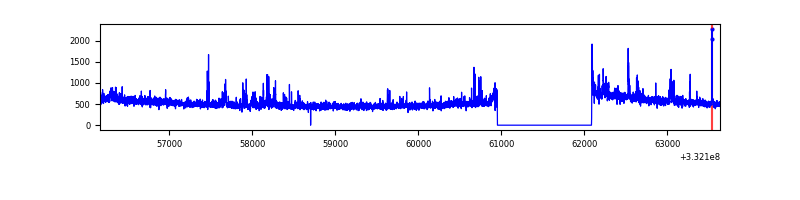 |
| D | 7465 | 6329 | 379 | 379 | 5.08% | 5.99% | 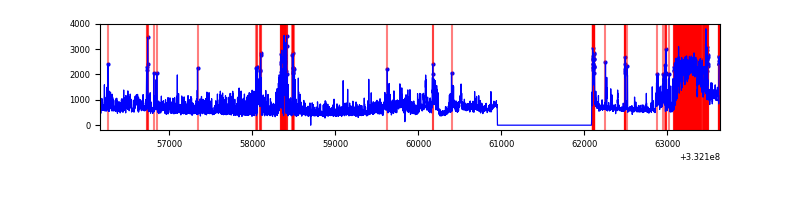 |
Top three noisy pixels from each quadrant. If the there are fewer than three noisy pixels in the level2.evt file, extra rows are filled as -1
| Pixel properties | Quadrant properties | ||||||
|---|---|---|---|---|---|---|---|
| Quadrant | DetID | PixID | Counts | Sigma | Mean | Median | Sigma |
| A | 0 | 13 | 2514516 | 15957.58 | 783 | 769 | 157.5 |
| A | 13 | 254 | 9315 | 54.25 | 783 | 769 | 157.5 |
| A | 3 | 137 | 7033 | 39.76 | 783 | 769 | 157.5 |
| B | 10 | 245 | 437580 | 2829.9 | 809 | 790 | 154.3 |
| B | 12 | 111 | 18595 | 115.35 | 809 | 790 | 154.3 |
| B | 11 | 111 | 16908 | 104.42 | 809 | 790 | 154.3 |
| C | 3 | 233 | 227476 | 1252.5 | 781 | 788 | 181.0 |
| C | 14 | 238 | 129057 | 708.71 | 781 | 788 | 181.0 |
| C | 13 | 61 | 5499 | 26.03 | 781 | 788 | 181.0 |
| D | 7 | 80 | 1392416 | 7393.42 | 787 | 769 | 188.2 |
| D | 7 | 223 | 442474 | 2346.65 | 787 | 769 | 188.2 |
| D | 12 | 233 | 409243 | 2170.1 | 787 | 769 | 188.2 |
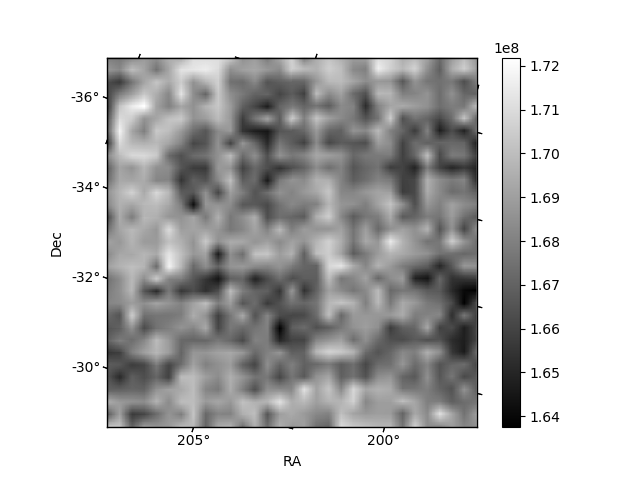
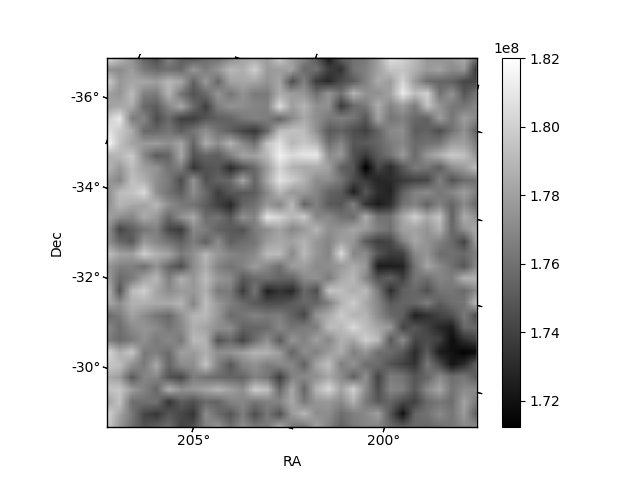
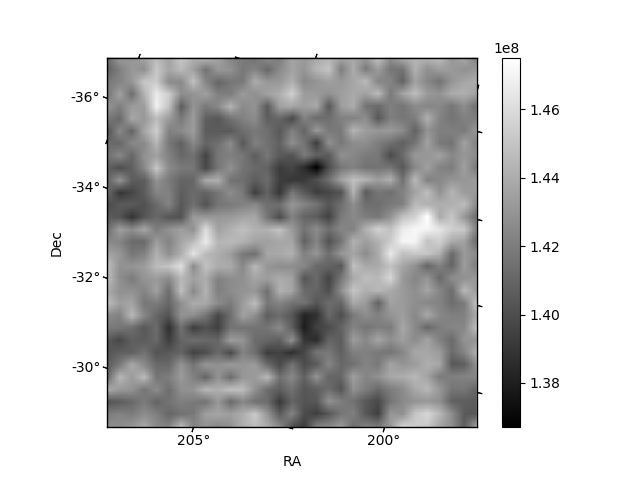
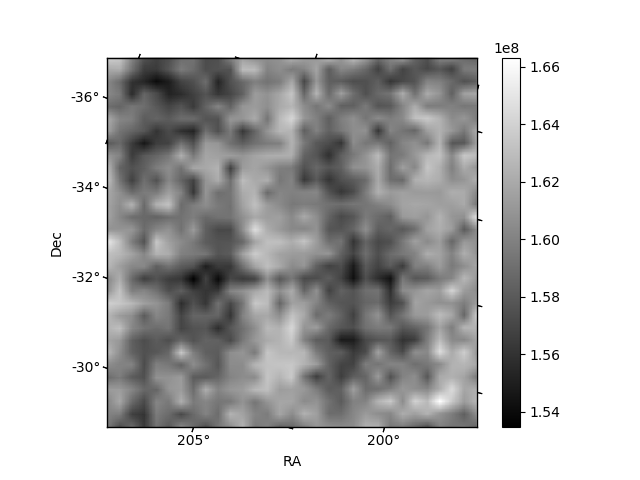
Histogram calculated using DETX and DETY for each event in the final _common_clean file
| Quadrant A | 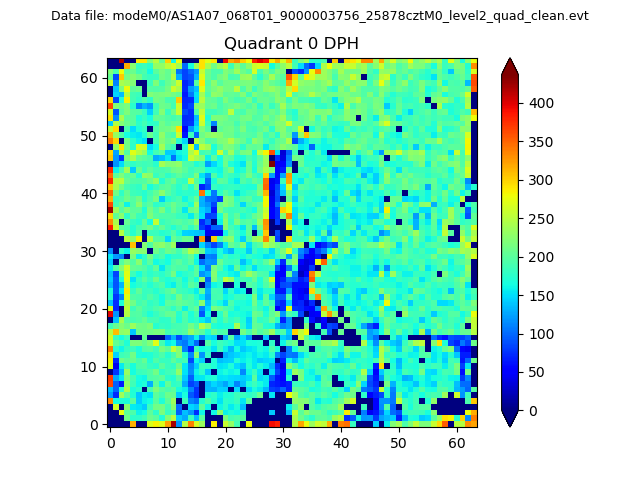 |
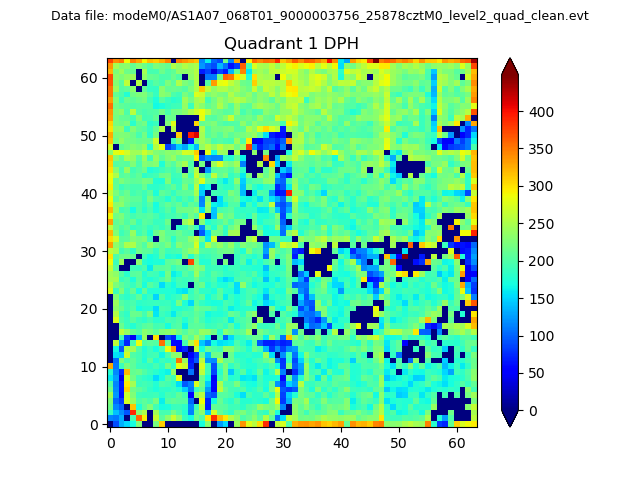 |
Quadrant B |
|---|---|---|---|
| Quadrant D |  |
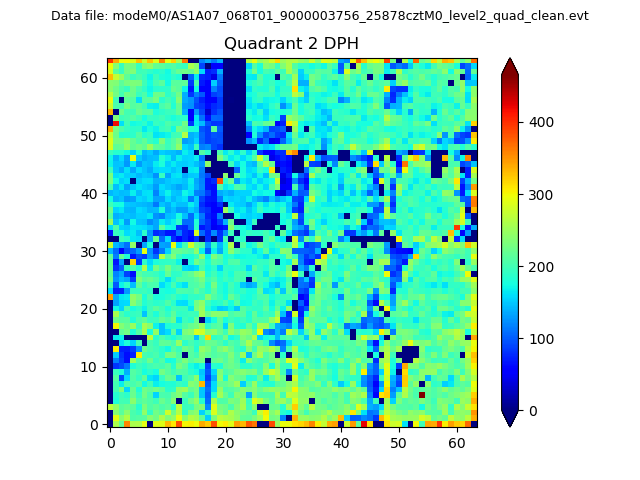 |
Quadrant C |
| Plot type | Count rate plots | Images |
|---|---|---|
| Comparison with Poisson distribution Blue bars denote a histogram of data divided into 1 sec bins. Red curve is a Poisson curve with rate = median count rate of data. |
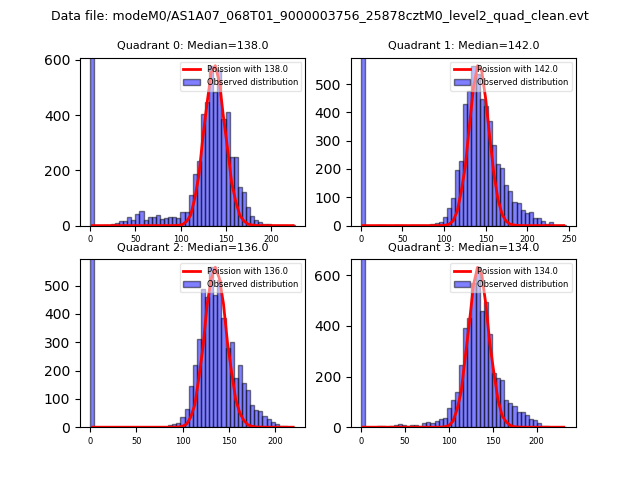 |
 |
| Quadrant-wise count rates Data is divided into 100 sec bins |
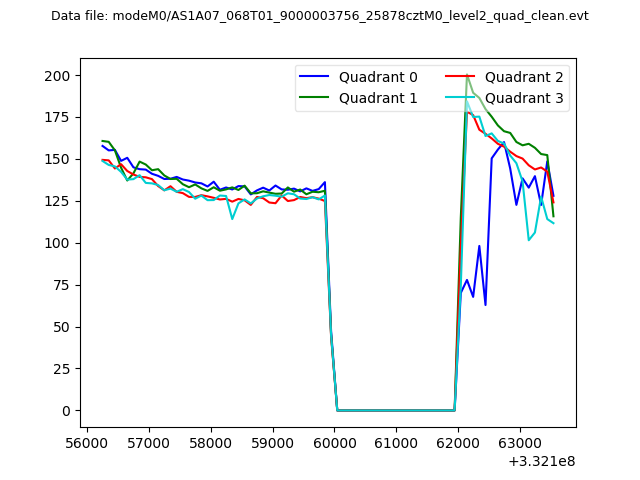 |
|
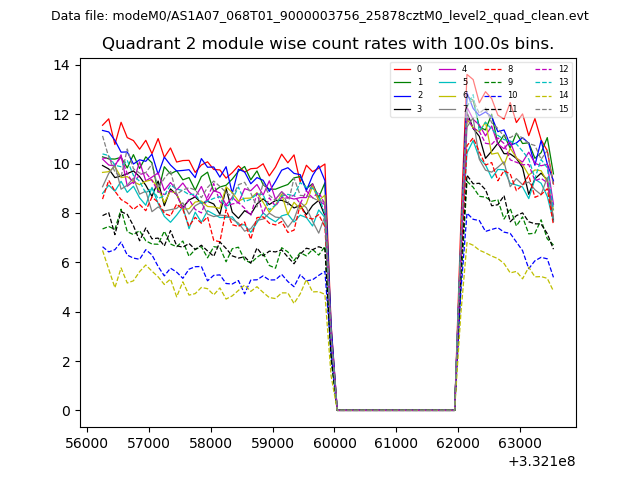
| Module-wise count rates for Quadrant A Data is divided into 100 sec bins |
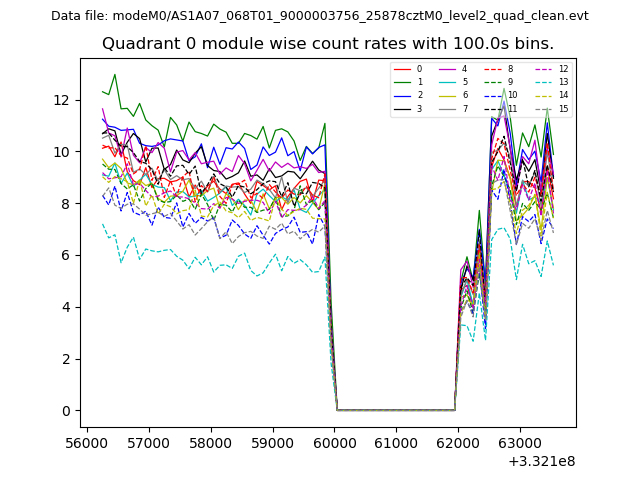 |
 |
| Module-wise count rates for Quadrant B Data is divided into 100 sec bins |
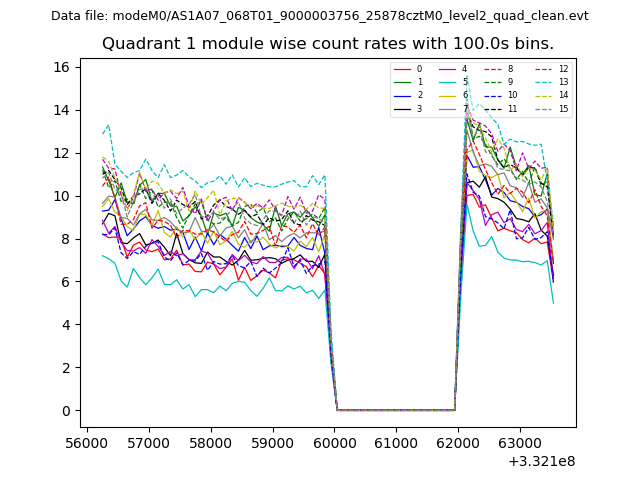 |
 |
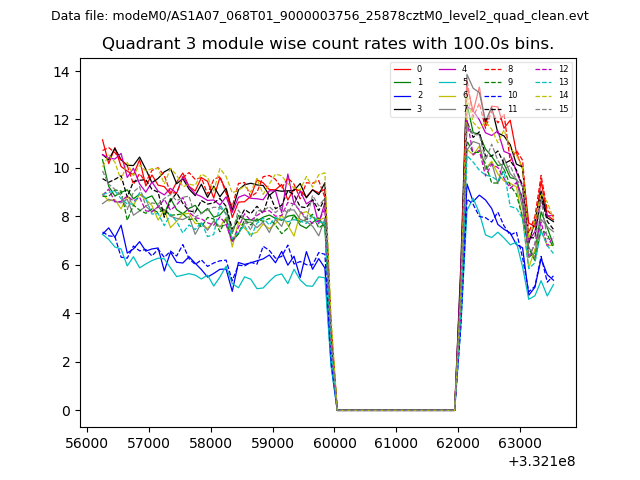
| Module-wise count rates for Quadrant C Data is divided into 100 sec bins |
 |
 |
| Module-wise count rates for Quadrant D Data is divided into 100 sec bins |
 |
 |
| Parameter | Plot |
|---|---|
| CZT HV Monitor | 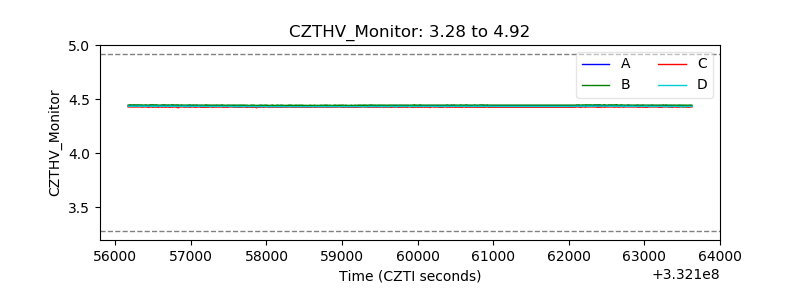 |
| D_VDD | 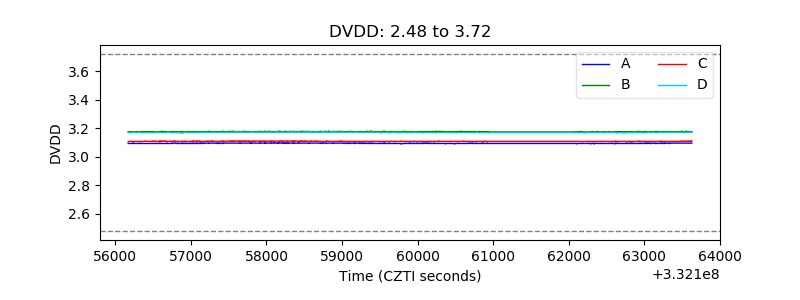 |
| Temperature 1 | 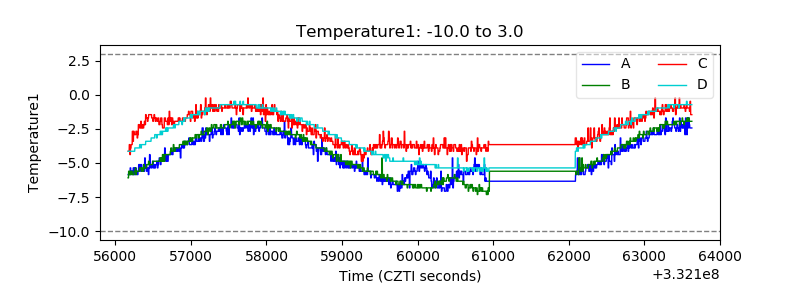 |
| Veto HV Monitor |  |
| Veto LLD | 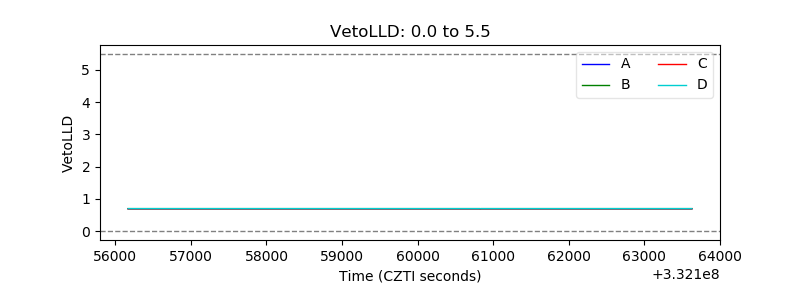 |
| Alpha Counter | 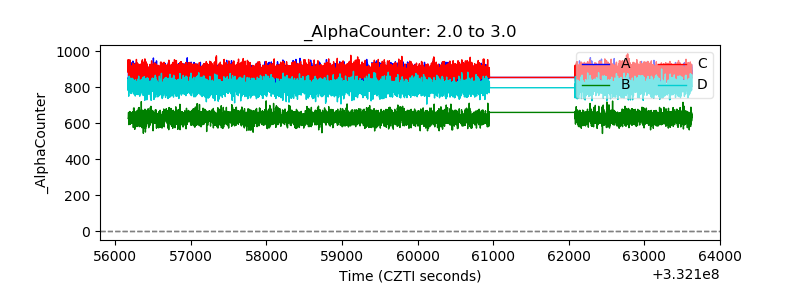 |
| _CPM_Rate | 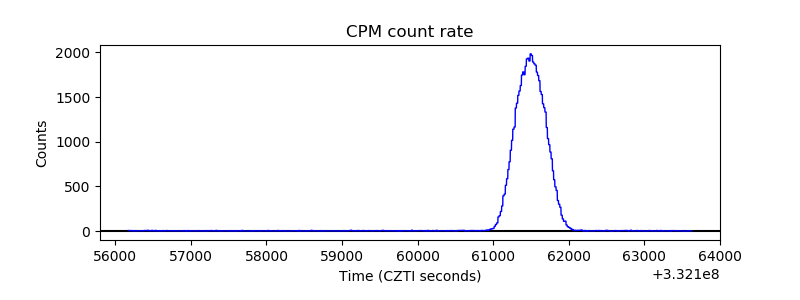 |
| CZT Counter |  |
| +2.5 Volts monitor |  |
| +5 Volts monitor | 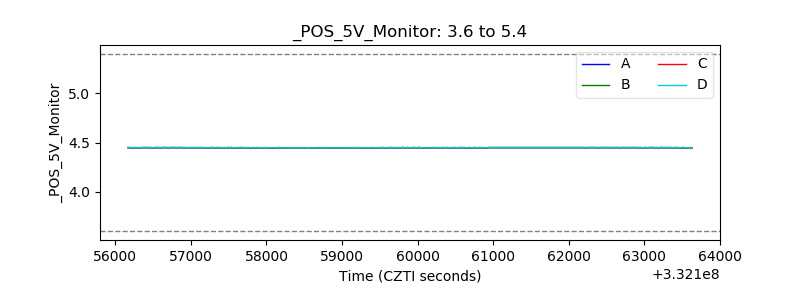 |
| _ROLL_ROT | 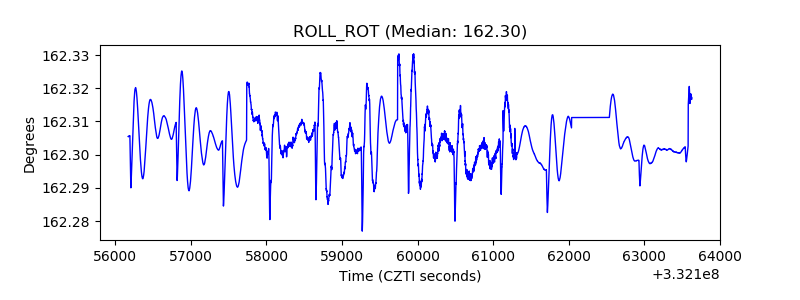 |
| _Roll_DEC | 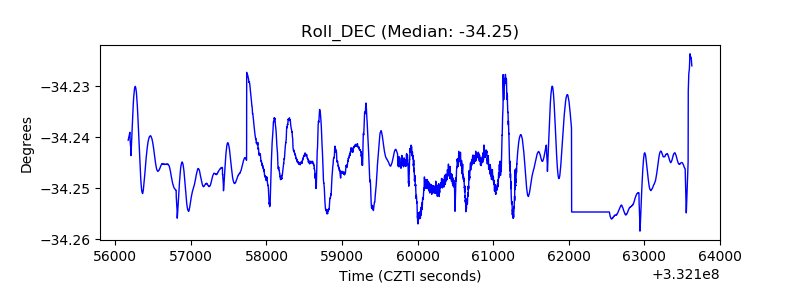 |
| _Roll_RA | 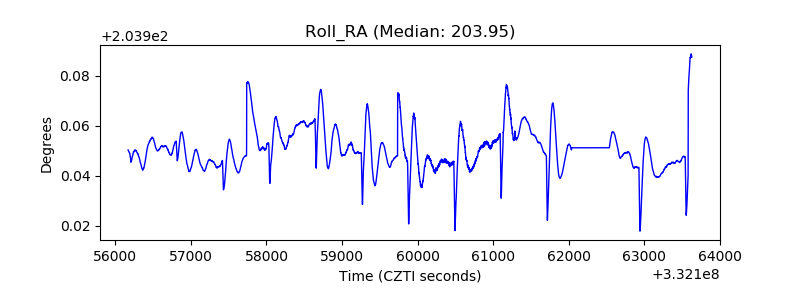 |
| Veto Counter | 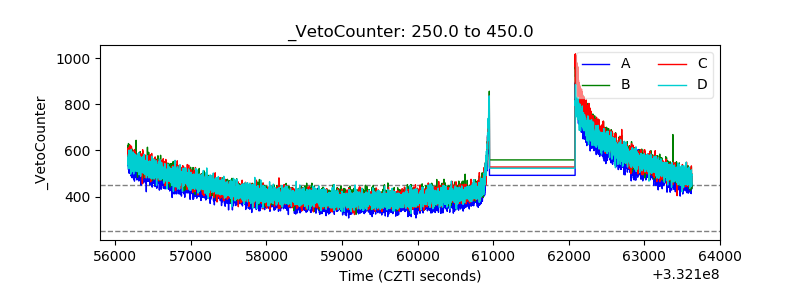 |