| Param | Original file | Final file |
|---|---|---|
| Filename | modeM0/AS1A07_068T01_9000003756_25879cztM0_level2.evt | modeM0/AS1A07_068T01_9000003756_25879cztM0_level2_quad_clean.evt |
| Size (bytes) | 541,512,000 | 108,285,120 |
| Size | 516.4 MB | 103.3 MB |
| Events in quadrant A | 4,798,918 | 721,342 |
| Events in quadrant B | 3,313,909 | 743,499 |
| Events in quadrant C | 3,445,713 | 698,558 |
| Events in quadrant D | 4,429,427 | 691,507 |
| Mode M0 | |||
|---|---|---|---|
| Quadrant | BADHDUFLAG | Total packets | Discarded packets |
| A | 0 | 18321 | 0 |
| B | 0 | 13690 | 0 |
| C | 0 | 14175 | 0 |
| D | 0 | 17220 | 0 |
| Mode M9 | |||
|---|---|---|---|
| Quadrant | BADHDUFLAG | Total packets | Discarded packets |
| A | 0 | 12 | 0 |
| B | 0 | 12 | 0 |
| C | 0 | 12 | 0 |
| D | 0 | 12 | 0 |
| Quadrant | Total seconds | Saturated seconds | Saturation percentage |
|---|---|---|---|
| A | 6074 | 483 | 7.951926% |
| B | 6075 | 114 | 1.876543% |
| C | 6075 | 122 | 2.008230% |
| D | 6075 | 463 | 7.621399% |
Noise dominated data is calculated using 1-second bins in cleaned event files. If a bin has >2000 counts, and if more than 50% of those come from <1% of pixels, then it is considered to be noise-dominated and hence unusable.
| Quadrant | # 1 sec bins | Bins with >0 counts | Bins with >2000 counts | High rate bins dominated by noise | Noise dominated (total time) | Noise dominated (detector-on time) | Marked lightcurve |
|---|---|---|---|---|---|---|---|
| A | 7304 | 6075 | 291 | 291 | 3.98% | 4.79% | 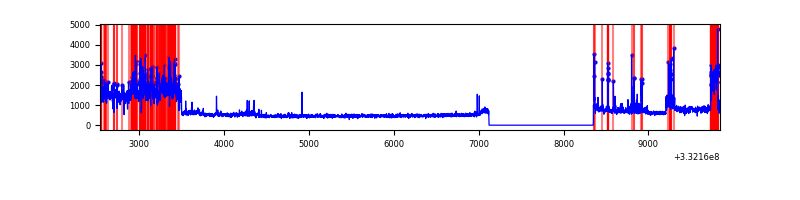 |
| B | 7305 | 6076 | 44 | 44 | 0.60% | 0.72% | 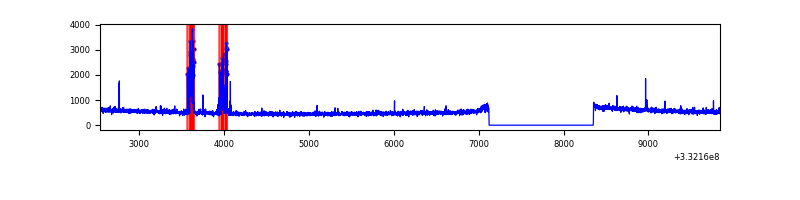 |
| C | 7305 | 6076 | 15 | 15 | 0.21% | 0.25% | 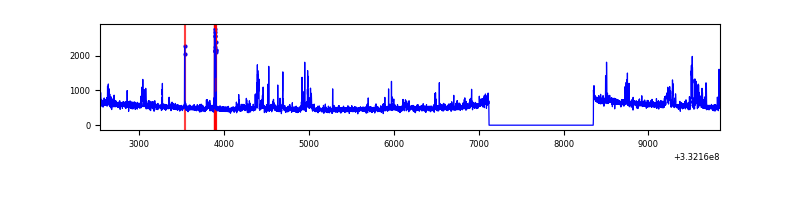 |
| D | 7305 | 6076 | 387 | 387 | 5.30% | 6.37% | 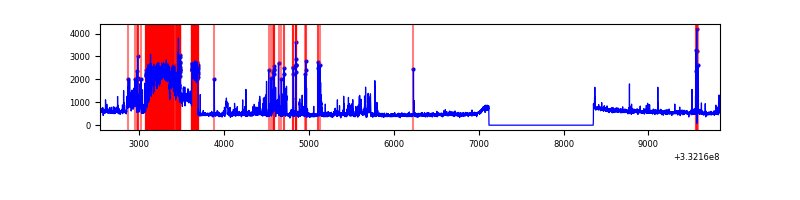 |
Top three noisy pixels from each quadrant. If the there are fewer than three noisy pixels in the level2.evt file, extra rows are filled as -1
| Pixel properties | Quadrant properties | ||||||
|---|---|---|---|---|---|---|---|
| Quadrant | DetID | PixID | Counts | Sigma | Mean | Median | Sigma |
| A | 0 | 13 | 1699407 | 10692.21 | 802 | 789 | 158.9 |
| A | 13 | 254 | 9261 | 53.33 | 802 | 789 | 158.9 |
| A | 12 | 96 | 8206 | 46.69 | 802 | 789 | 158.9 |
| B | 10 | 245 | 184066 | 1215.96 | 795 | 778 | 150.7 |
| B | 12 | 111 | 17560 | 111.33 | 795 | 778 | 150.7 |
| B | 11 | 111 | 16094 | 101.61 | 795 | 778 | 150.7 |
| C | 3 | 233 | 285198 | 1622.45 | 762 | 769 | 175.3 |
| C | 14 | 238 | 125212 | 709.85 | 762 | 769 | 175.3 |
| C | 7 | 238 | 64168 | 361.64 | 762 | 769 | 175.3 |
| D | 7 | 80 | 1189932 | 6420.02 | 776 | 761 | 185.2 |
| D | 12 | 233 | 175999 | 946.06 | 776 | 761 | 185.2 |
| D | 1 | 52 | 86081 | 460.62 | 776 | 761 | 185.2 |
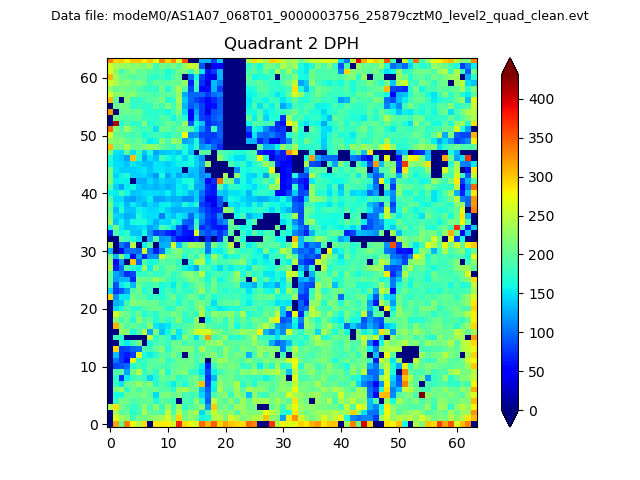
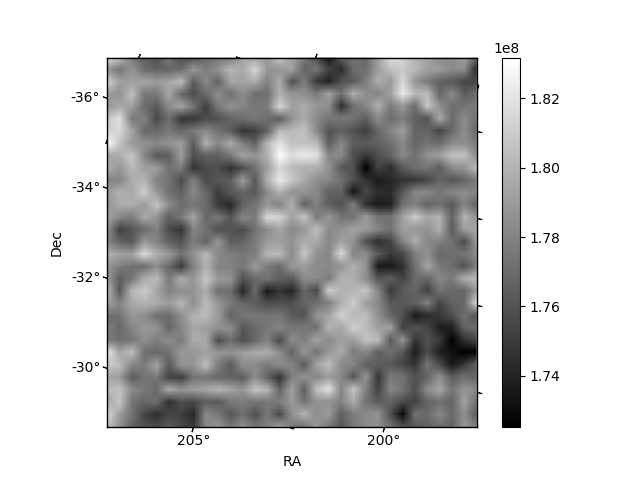
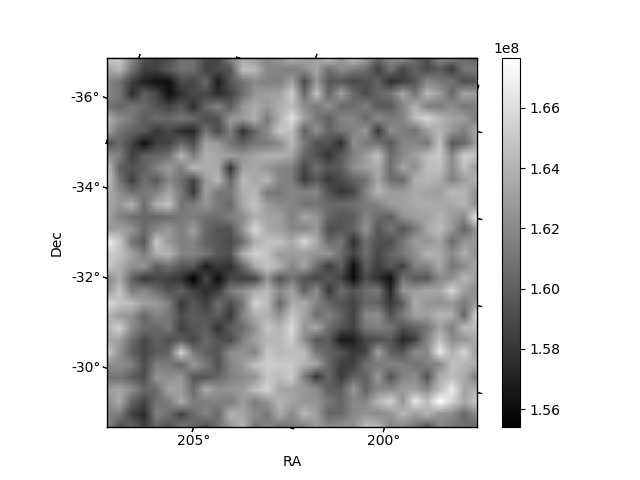
Histogram calculated using DETX and DETY for each event in the final _common_clean file
| Quadrant A | 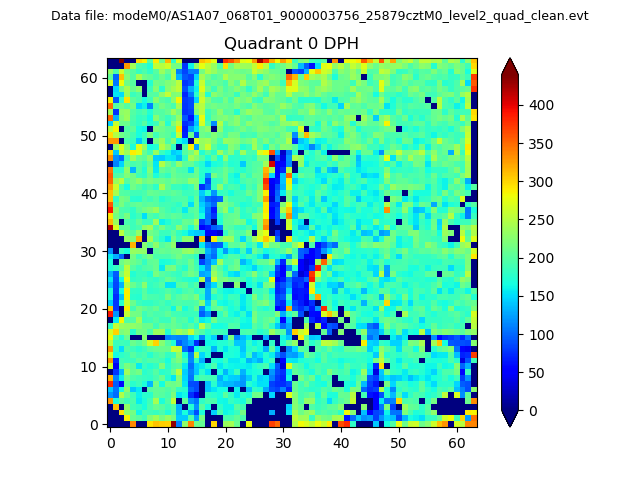 |
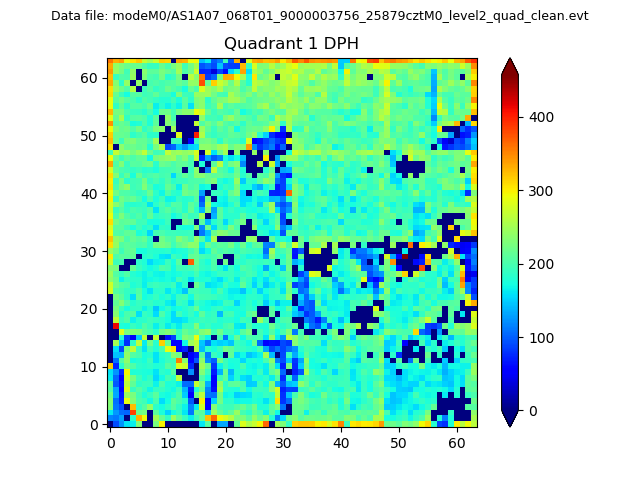 |
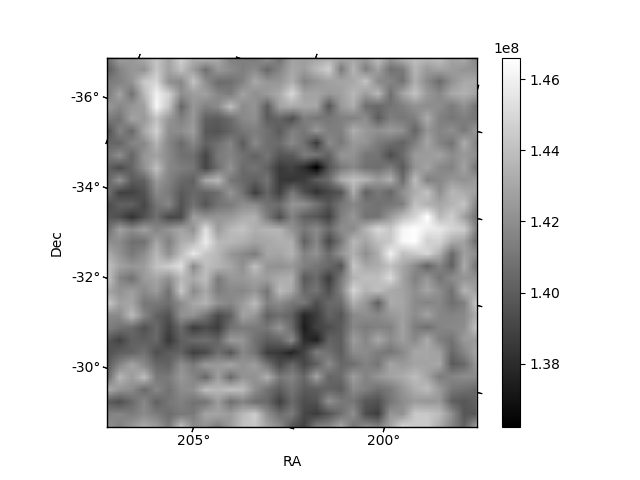
Quadrant B |
|---|---|---|---|
| Quadrant D | 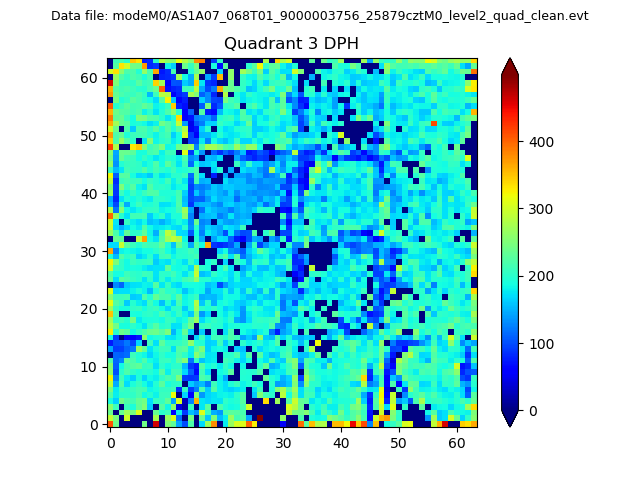 |
 |
Quadrant C |
| Plot type | Count rate plots | Images |
|---|---|---|
| Comparison with Poisson distribution Blue bars denote a histogram of data divided into 1 sec bins. Red curve is a Poisson curve with rate = median count rate of data. |
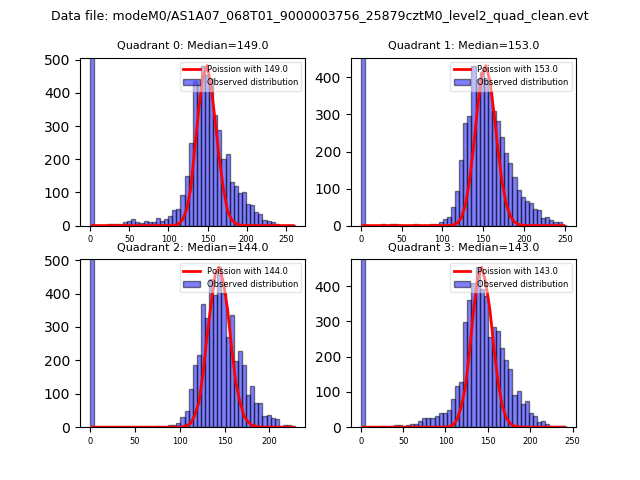 |
 |
| Quadrant-wise count rates Data is divided into 100 sec bins |
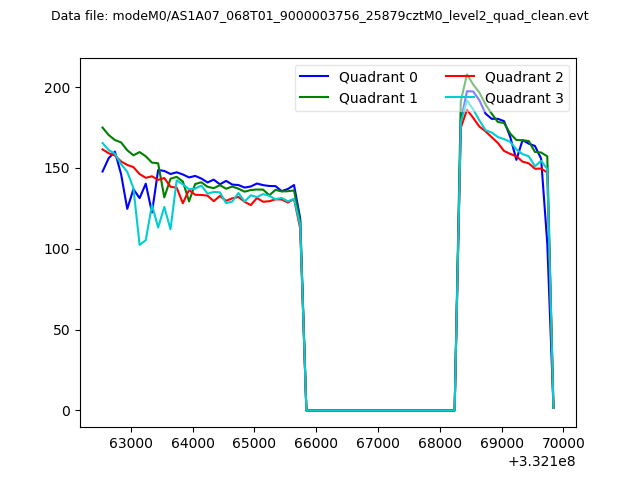 |
|
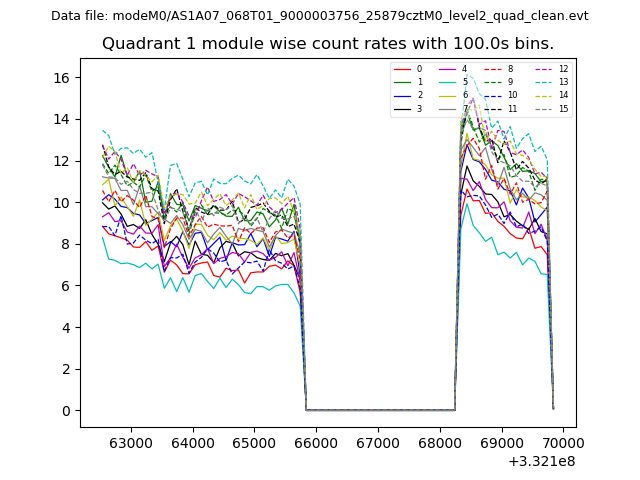
| Module-wise count rates for Quadrant A Data is divided into 100 sec bins |
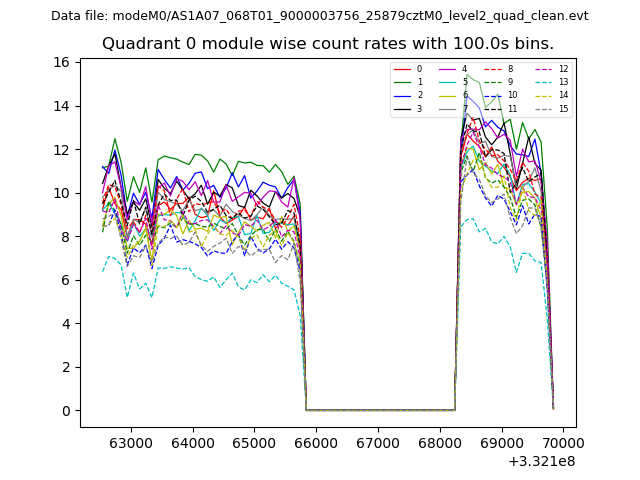 |
 |
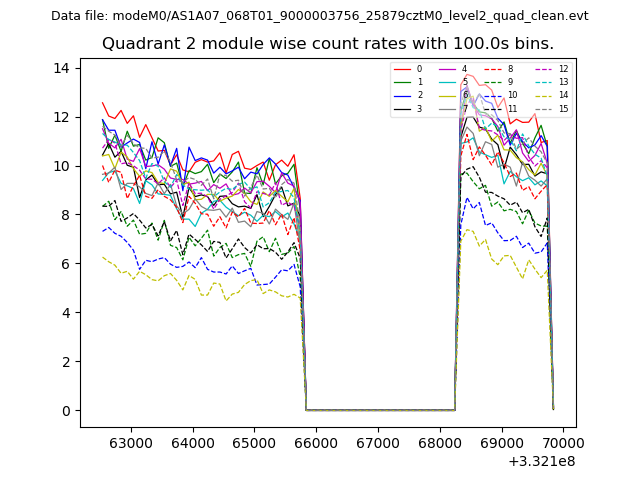
| Module-wise count rates for Quadrant B Data is divided into 100 sec bins |
 |
 |
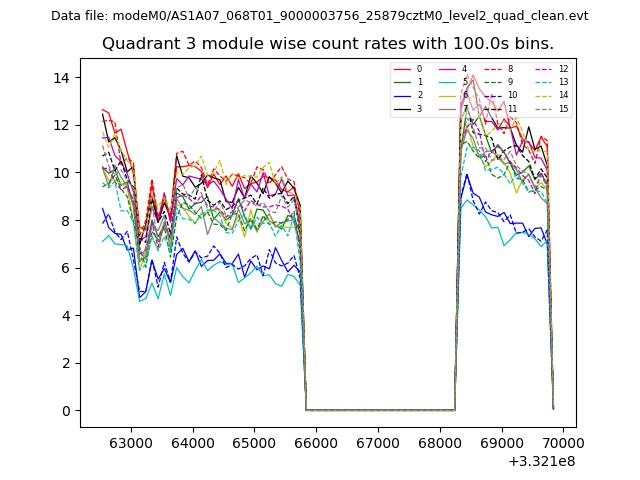
| Module-wise count rates for Quadrant C Data is divided into 100 sec bins |
 |
 |
| Module-wise count rates for Quadrant D Data is divided into 100 sec bins |
 |
 |
| Parameter | Plot |
|---|---|
| CZT HV Monitor | 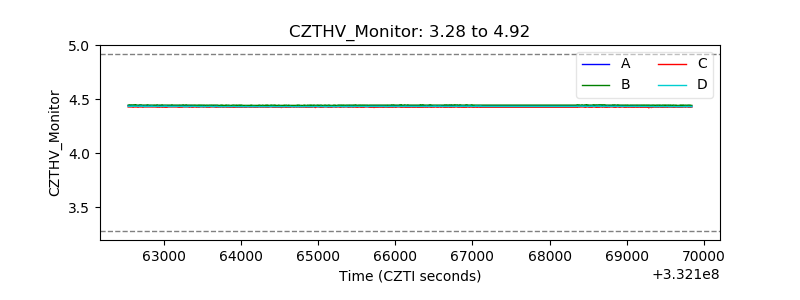 |
| D_VDD | 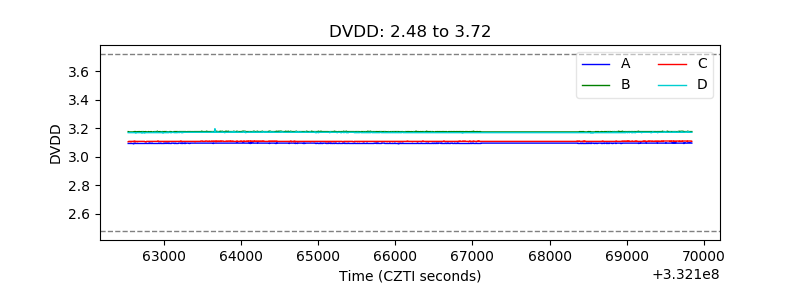 |
| Temperature 1 | 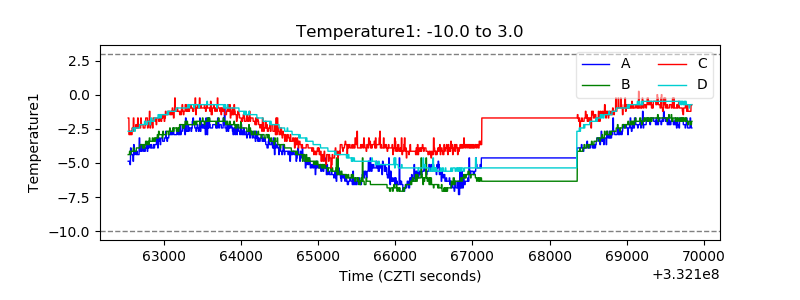 |
| Veto HV Monitor | 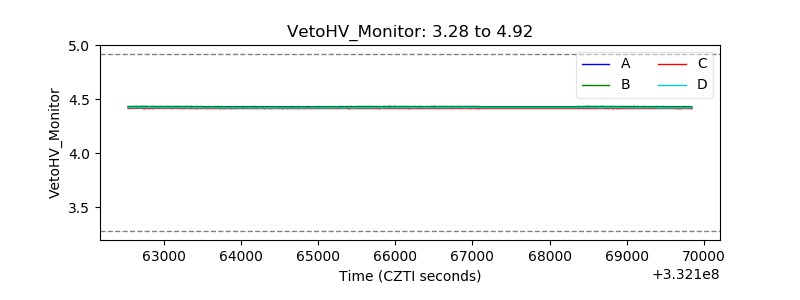 |
| Veto LLD | 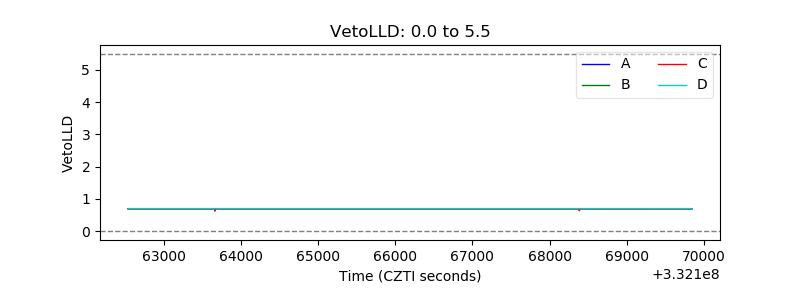 |
| Alpha Counter | 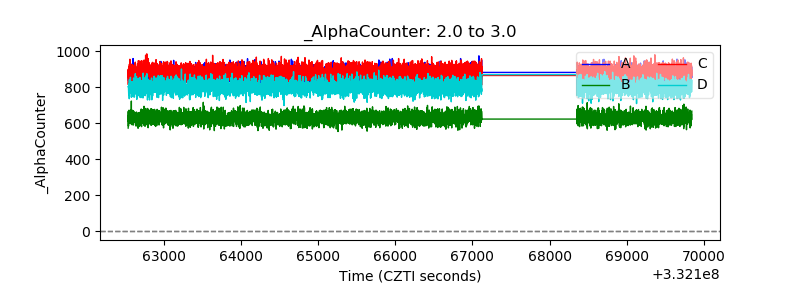 |
| _CPM_Rate |  |
| CZT Counter | 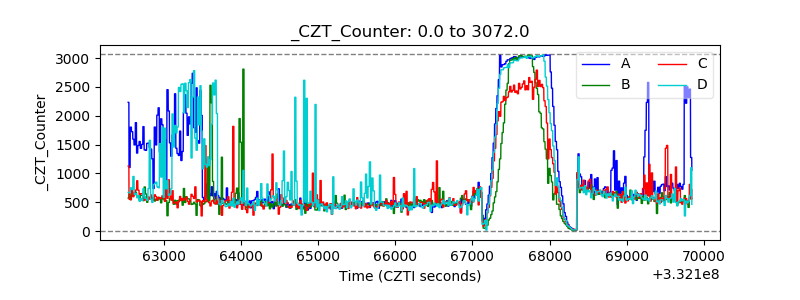 |
| +2.5 Volts monitor |  |
| +5 Volts monitor |  |
| _ROLL_ROT | 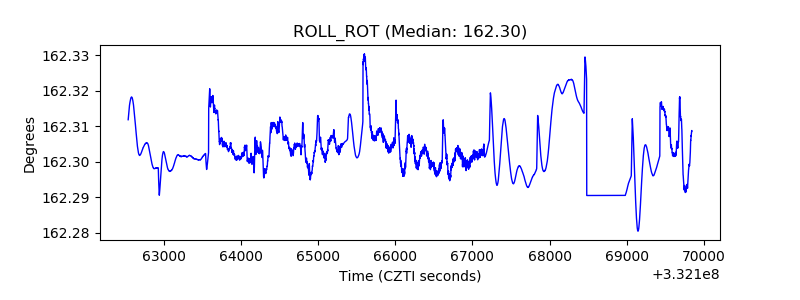 |
| _Roll_DEC | 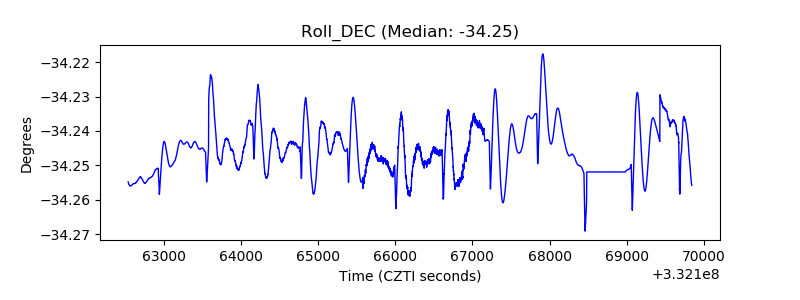 |
| _Roll_RA |  |
| Veto Counter | 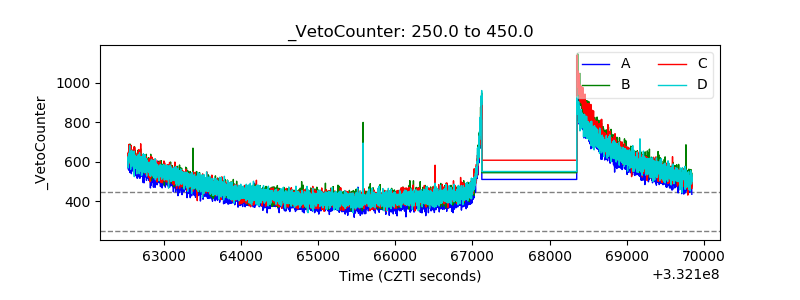 |