| Param | Original file | Final file |
|---|---|---|
| Filename | modeM0/AS1A07_068T01_9000003756_25880cztM0_level2.evt | modeM0/AS1A07_068T01_9000003756_25880cztM0_level2_quad_clean.evt |
| Size (bytes) | 485,225,280 | 99,668,160 |
| Size | 462.7 MB | 95.1 MB |
| Events in quadrant A | 4,214,099 | 667,239 |
| Events in quadrant B | 3,153,340 | 674,998 |
| Events in quadrant C | 3,806,883 | 622,124 |
| Events in quadrant D | 3,125,179 | 646,449 |
| Mode M0 | |||
|---|---|---|---|
| Quadrant | BADHDUFLAG | Total packets | Discarded packets |
| A | 0 | 16264 | 0 |
| B | 0 | 12951 | 0 |
| C | 0 | 15127 | 0 |
| D | 0 | 12950 | 0 |
| Mode M9 | |||
|---|---|---|---|
| Quadrant | BADHDUFLAG | Total packets | Discarded packets |
| A | 0 | 13 | 0 |
| B | 0 | 13 | 0 |
| C | 0 | 13 | 0 |
| D | 0 | 13 | 0 |
| Quadrant | Total seconds | Saturated seconds | Saturation percentage |
|---|---|---|---|
| A | 5834 | 255 | 4.370929% |
| B | 5835 | 73 | 1.251071% |
| C | 5835 | 215 | 3.684662% |
| D | 5835 | 82 | 1.405313% |
Noise dominated data is calculated using 1-second bins in cleaned event files. If a bin has >2000 counts, and if more than 50% of those come from <1% of pixels, then it is considered to be noise-dominated and hence unusable.
| Quadrant | # 1 sec bins | Bins with >0 counts | Bins with >2000 counts | High rate bins dominated by noise | Noise dominated (total time) | Noise dominated (detector-on time) | Marked lightcurve |
|---|---|---|---|---|---|---|---|
| A | 7124 | 5835 | 155 | 155 | 2.18% | 2.66% | 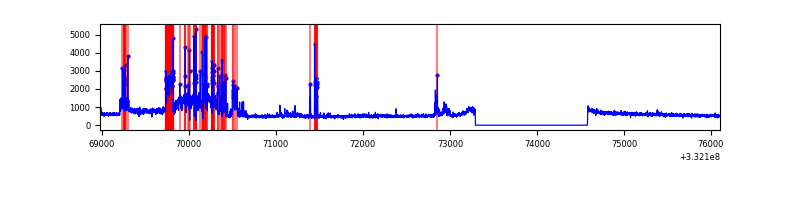 |
| B | 7125 | 5836 | 0 | 0 | 0.00% | 0.00% | 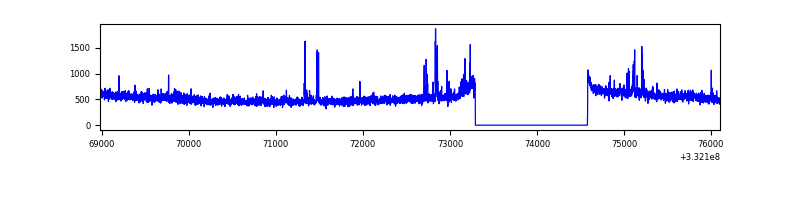 |
| C | 7125 | 5836 | 64 | 64 | 0.90% | 1.10% | 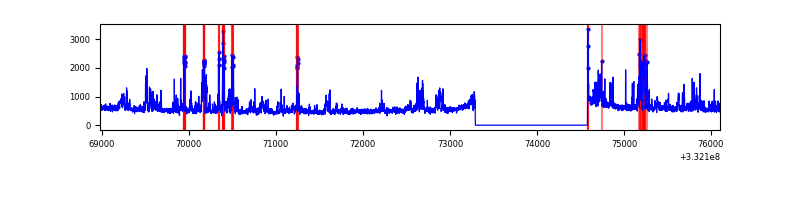 |
| D | 7125 | 5836 | 16 | 16 | 0.22% | 0.27% | 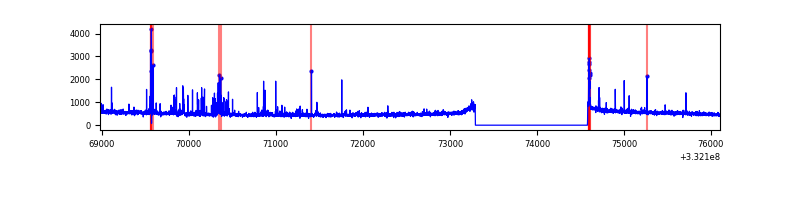 |
Top three noisy pixels from each quadrant. If the there are fewer than three noisy pixels in the level2.evt file, extra rows are filled as -1
| Pixel properties | Quadrant properties | ||||||
|---|---|---|---|---|---|---|---|
| Quadrant | DetID | PixID | Counts | Sigma | Mean | Median | Sigma |
| A | 0 | 13 | 1174998 | 7524.23 | 786 | 774 | 156.1 |
| A | 13 | 254 | 9692 | 57.15 | 786 | 774 | 156.1 |
| A | 0 | 226 | 6835 | 38.84 | 786 | 774 | 156.1 |
| B | 10 | 245 | 59973 | 403.73 | 773 | 756 | 146.7 |
| B | 0 | 190 | 38957 | 260.44 | 773 | 756 | 146.7 |
| B | 0 | 219 | 24022 | 158.62 | 773 | 756 | 146.7 |
| C | 3 | 233 | 763746 | 4550.67 | 728 | 733 | 167.7 |
| C | 14 | 238 | 119326 | 707.3 | 728 | 733 | 167.7 |
| C | 7 | 238 | 80463 | 475.51 | 728 | 733 | 167.7 |
| D | 7 | 80 | 109409 | 598.78 | 759 | 741 | 181.5 |
| D | 1 | 52 | 55453 | 301.47 | 759 | 741 | 181.5 |
| D | 12 | 233 | 34943 | 188.46 | 759 | 741 | 181.5 |
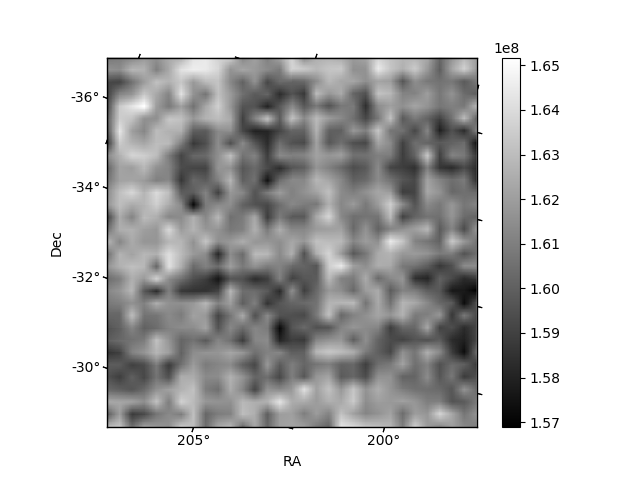
Histogram calculated using DETX and DETY for each event in the final _common_clean file
| Quadrant A | 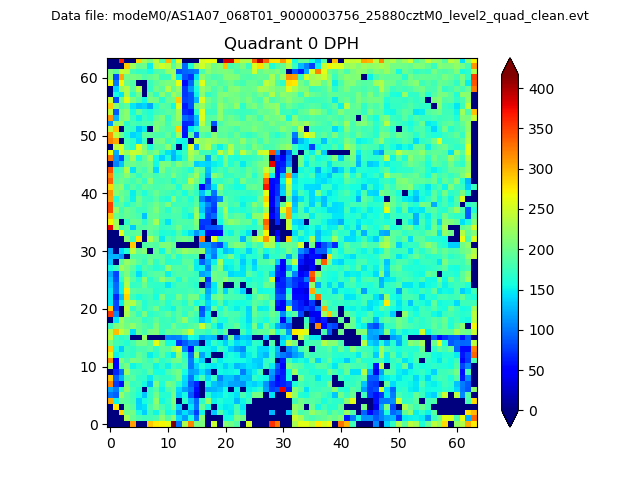 |
 |
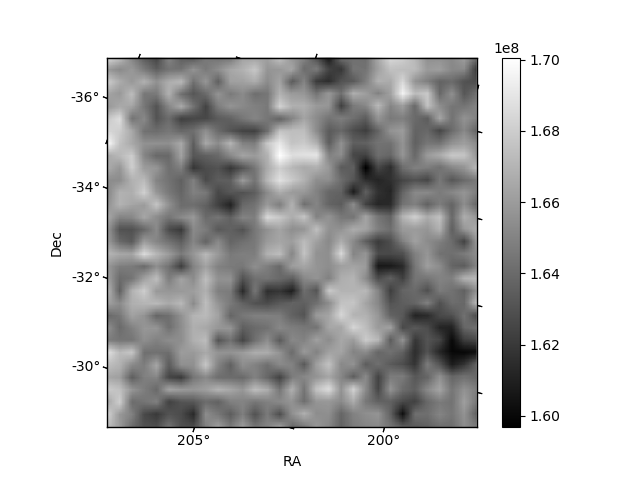
Quadrant B |
|---|---|---|---|
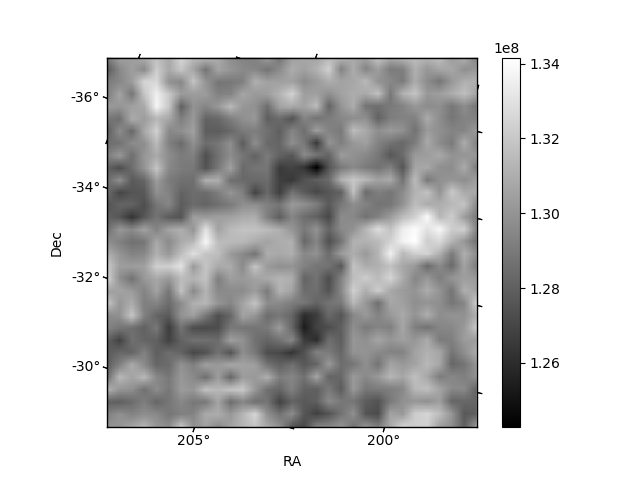
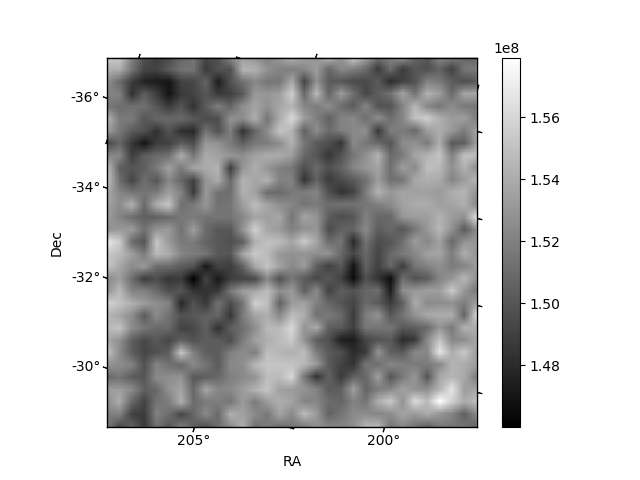
| Quadrant D | 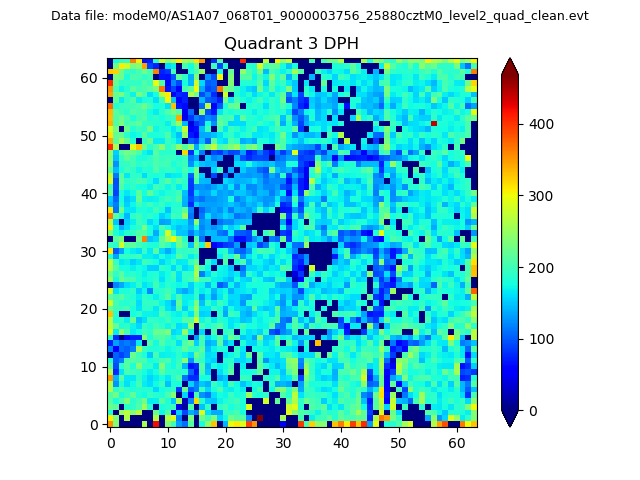 |
 |
Quadrant C |
| Plot type | Count rate plots | Images |
|---|---|---|
| Comparison with Poisson distribution Blue bars denote a histogram of data divided into 1 sec bins. Red curve is a Poisson curve with rate = median count rate of data. |
 |
 |
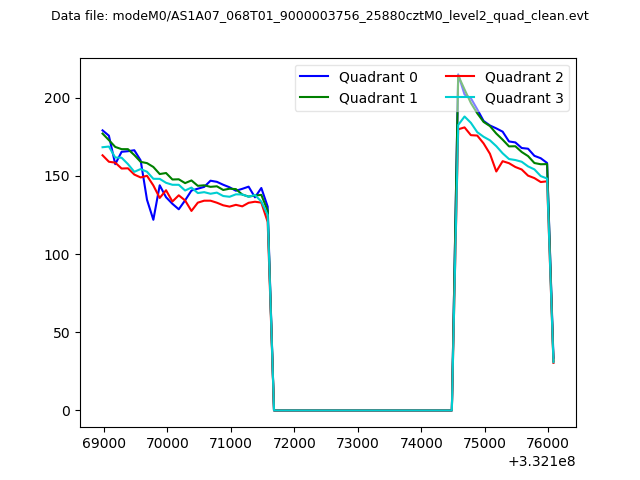
| Quadrant-wise count rates Data is divided into 100 sec bins |
 |
|
| Module-wise count rates for Quadrant A Data is divided into 100 sec bins |
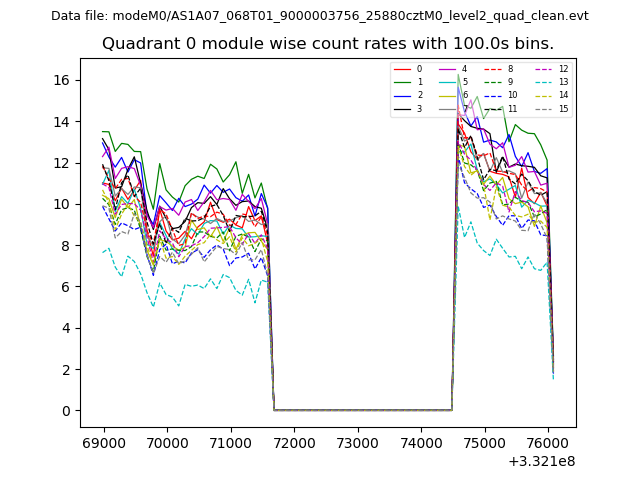 |
 |
| Module-wise count rates for Quadrant B Data is divided into 100 sec bins |
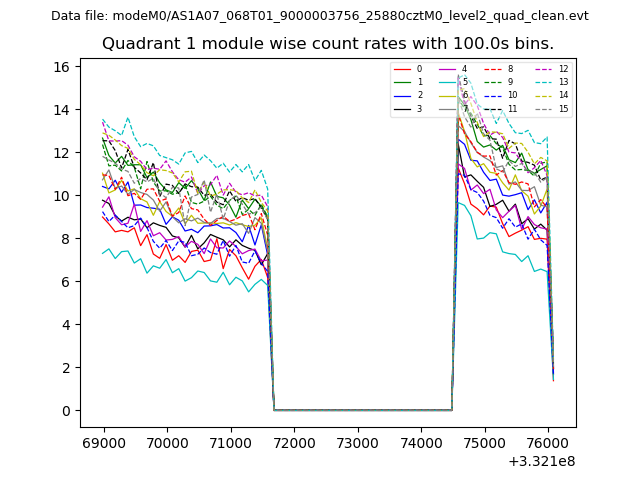 |
 |
| Module-wise count rates for Quadrant C Data is divided into 100 sec bins |
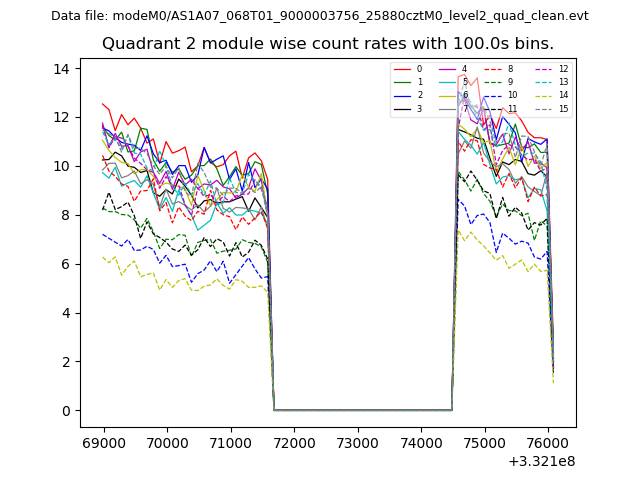 |
 |
| Module-wise count rates for Quadrant D Data is divided into 100 sec bins |
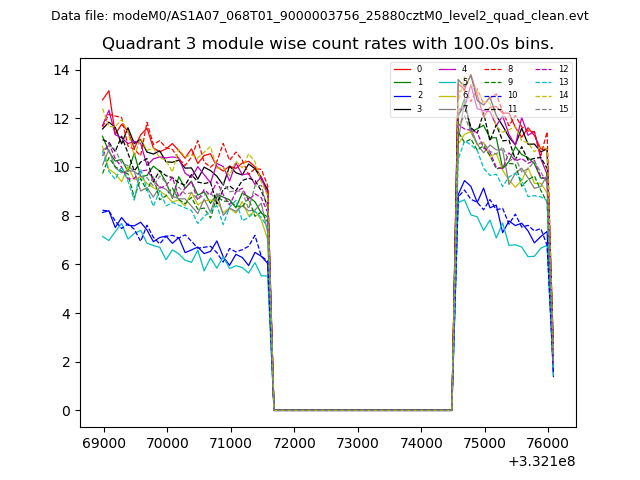 |
 |
| Parameter | Plot |
|---|---|
| CZT HV Monitor | 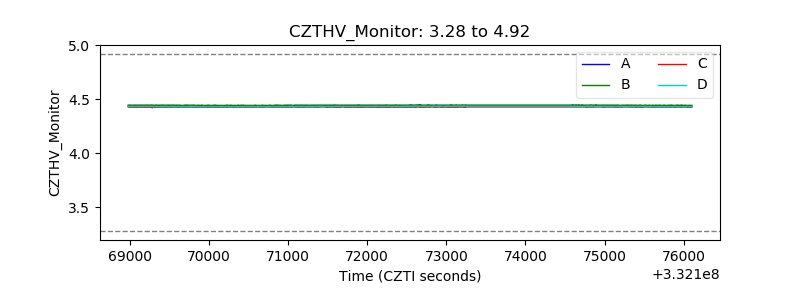 |
| D_VDD | 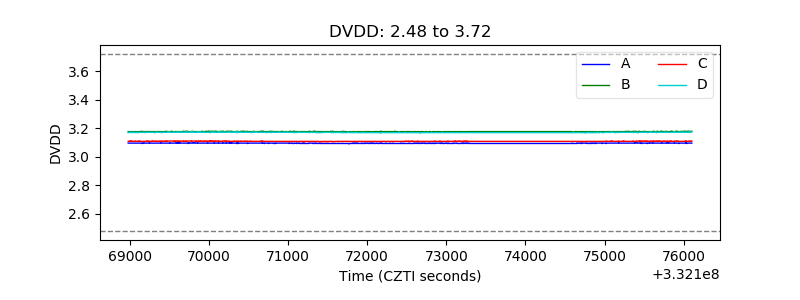 |
| Temperature 1 | 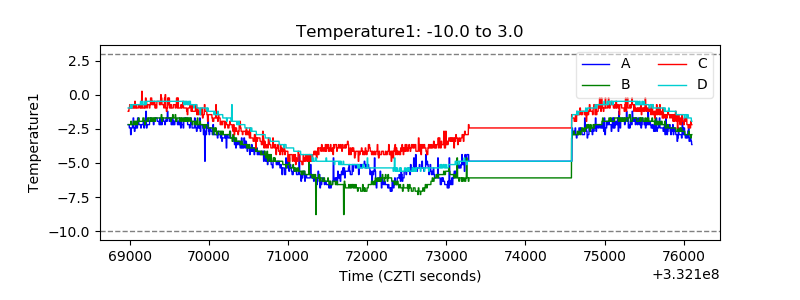 |
| Veto HV Monitor | 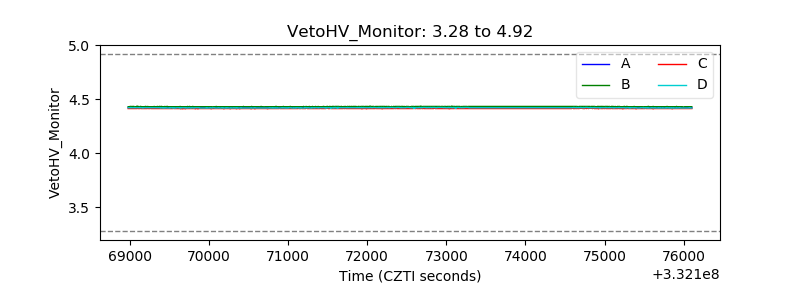 |
| Veto LLD | 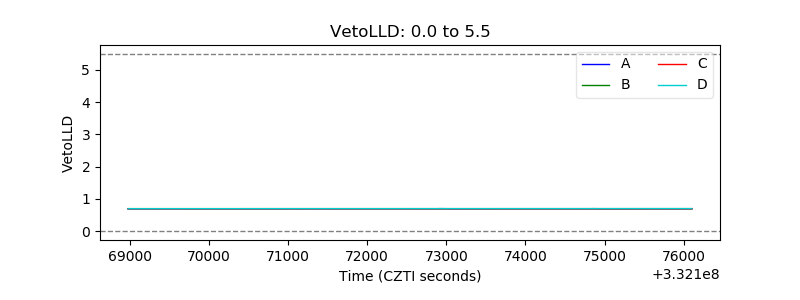 |
| Alpha Counter |  |
| _CPM_Rate | 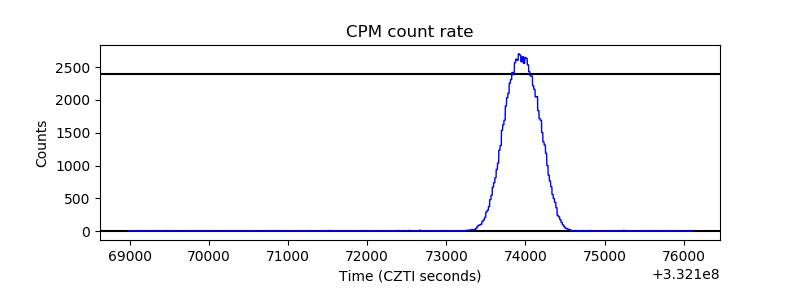 |
| CZT Counter | 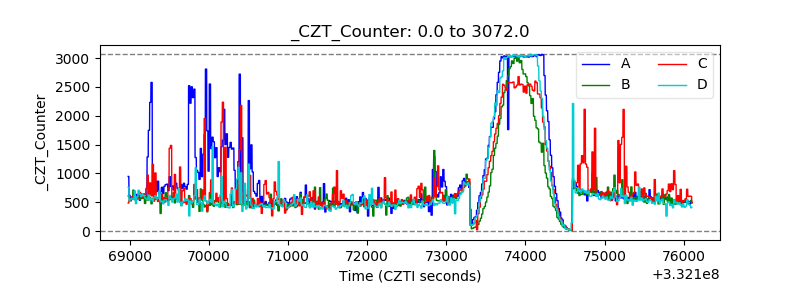 |
| +2.5 Volts monitor |  |
| +5 Volts monitor | 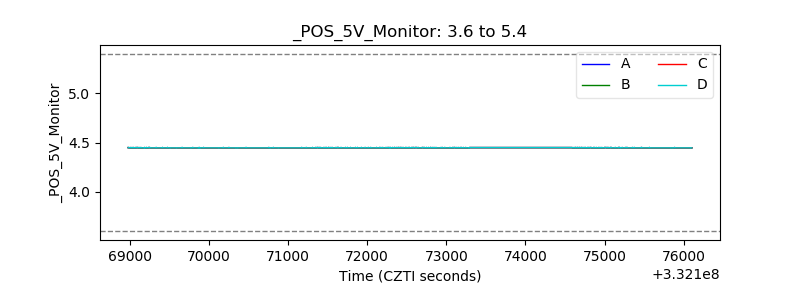 |
| _ROLL_ROT | 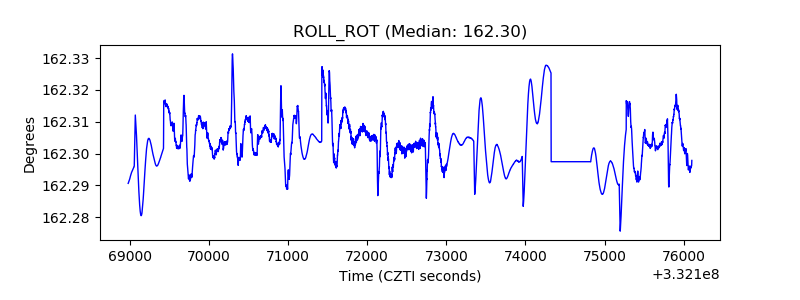 |
| _Roll_DEC | 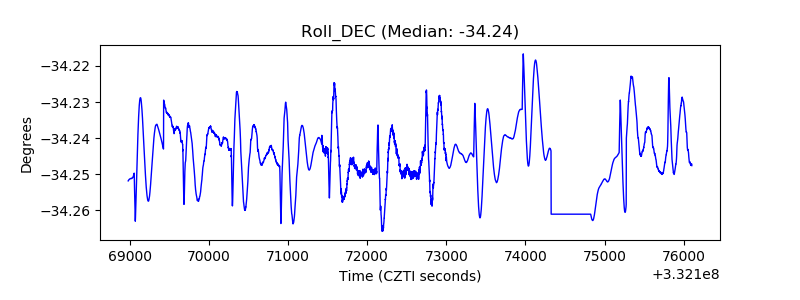 |
| _Roll_RA | 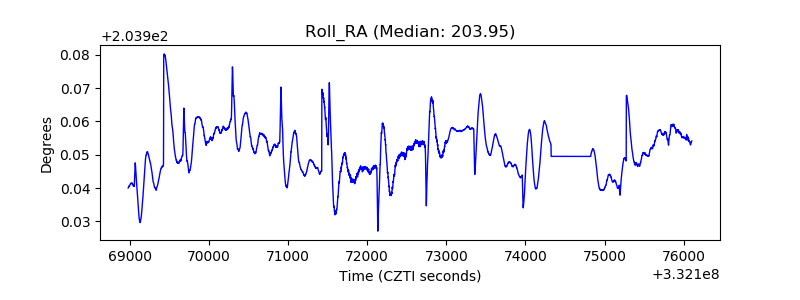 |
| Veto Counter | 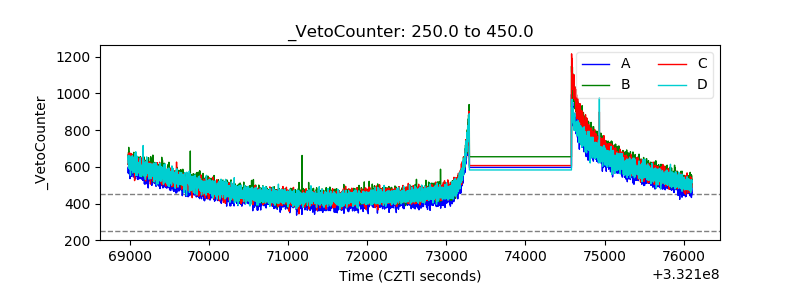 |