| Param | Original file | Final file |
|---|---|---|
| Filename | modeM0/AS1A07_068T01_9000003756_25883cztM0_level2.evt | modeM0/AS1A07_068T01_9000003756_25883cztM0_level2_quad_clean.evt |
| Size (bytes) | 581,532,480 | 91,768,320 |
| Size | 554.6 MB | 87.5 MB |
| Events in quadrant A | 5,850,029 | 559,630 |
| Events in quadrant B | 3,192,672 | 625,724 |
| Events in quadrant C | 3,724,313 | 574,809 |
| Events in quadrant D | 4,410,157 | 571,087 |
| Mode M0 | |||
|---|---|---|---|
| Quadrant | BADHDUFLAG | Total packets | Discarded packets |
| A | 0 | 21405 | 0 |
| B | 0 | 13511 | 0 |
| C | 0 | 15217 | 0 |
| D | 0 | 17375 | 0 |
| Mode M9 | |||
|---|---|---|---|
| Quadrant | BADHDUFLAG | Total packets | Discarded packets |
| A | 0 | 17 | 0 |
| B | 0 | 18 | 0 |
| C | 0 | 18 | 0 |
| D | 0 | 18 | 0 |
| Quadrant | Total seconds | Saturated seconds | Saturation percentage |
|---|---|---|---|
| A | 6411 | 1139 | 17.766339% |
| B | 6411 | 36 | 0.561535% |
| C | 6411 | 233 | 3.634378% |
| D | 6411 | 201 | 3.135236% |
Noise dominated data is calculated using 1-second bins in cleaned event files. If a bin has >2000 counts, and if more than 50% of those come from <1% of pixels, then it is considered to be noise-dominated and hence unusable.
| Quadrant | # 1 sec bins | Bins with >0 counts | Bins with >2000 counts | High rate bins dominated by noise | Noise dominated (total time) | Noise dominated (detector-on time) | Marked lightcurve |
|---|---|---|---|---|---|---|---|
| A | 7506 | 6412 | 871 | 871 | 11.60% | 13.58% | 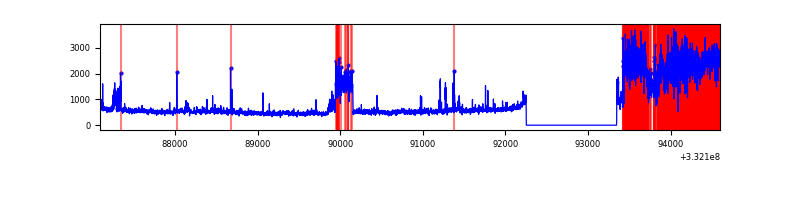 |
| B | 7506 | 6412 | 1 | 1 | 0.01% | 0.02% | 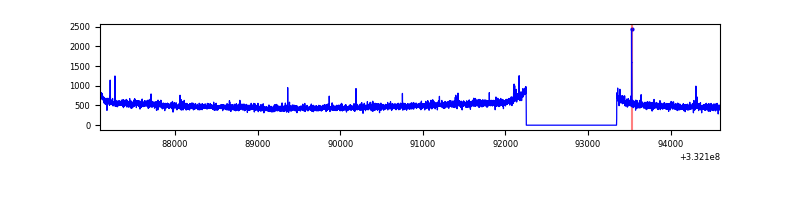 |
| C | 7506 | 6412 | 92 | 92 | 1.23% | 1.43% | 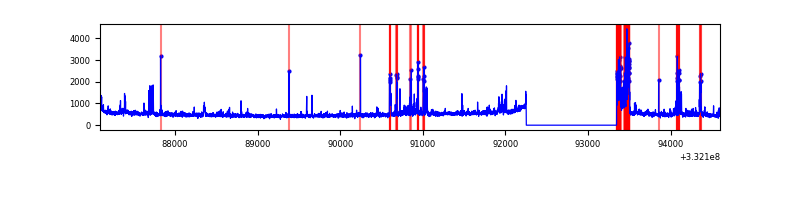 |
| D | 7506 | 6412 | 139 | 139 | 1.85% | 2.17% | 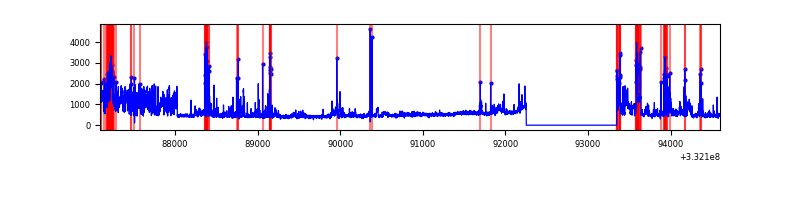 |
Top three noisy pixels from each quadrant. If the there are fewer than three noisy pixels in the level2.evt file, extra rows are filled as -1
| Pixel properties | Quadrant properties | ||||||
|---|---|---|---|---|---|---|---|
| Quadrant | DetID | PixID | Counts | Sigma | Mean | Median | Sigma |
| A | 0 | 13 | 2909768 | 19089.46 | 760 | 745 | 152.4 |
| A | 13 | 254 | 9919 | 60.2 | 760 | 745 | 152.4 |
| A | 3 | 137 | 7043 | 41.33 | 760 | 745 | 152.4 |
| B | 0 | 219 | 22536 | 140.56 | 802 | 781 | 154.8 |
| B | 12 | 111 | 18167 | 112.33 | 802 | 781 | 154.8 |
| B | 11 | 111 | 16577 | 102.06 | 802 | 781 | 154.8 |
| C | 3 | 233 | 638111 | 3624.38 | 753 | 754 | 175.9 |
| C | 14 | 238 | 121371 | 685.9 | 753 | 754 | 175.9 |
| C | 7 | 238 | 18494 | 100.88 | 753 | 754 | 175.9 |
| D | 1 | 52 | 1261455 | 6865.89 | 764 | 745 | 183.6 |
| D | 5 | 223 | 167618 | 908.8 | 764 | 745 | 183.6 |
| D | 12 | 2 | 55044 | 295.71 | 764 | 745 | 183.6 |
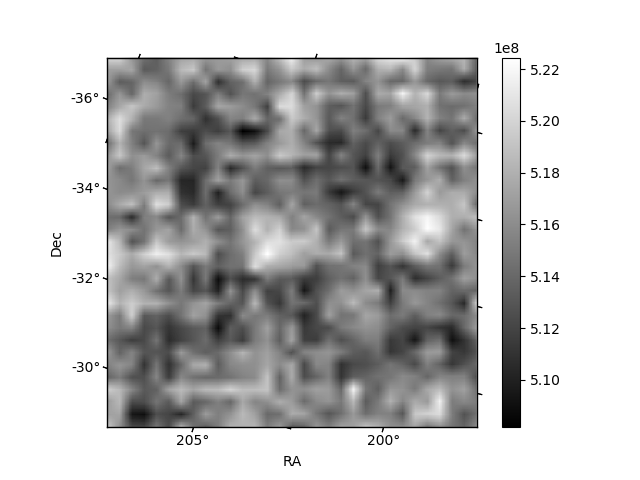
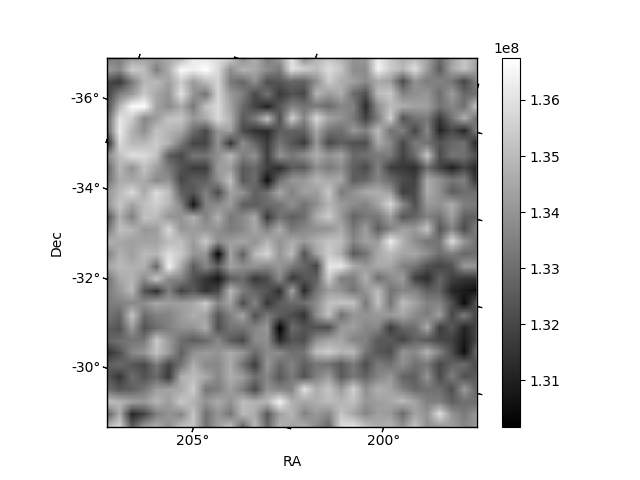
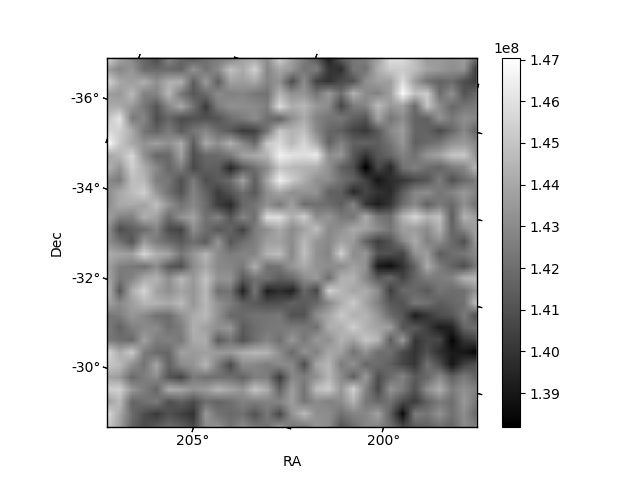
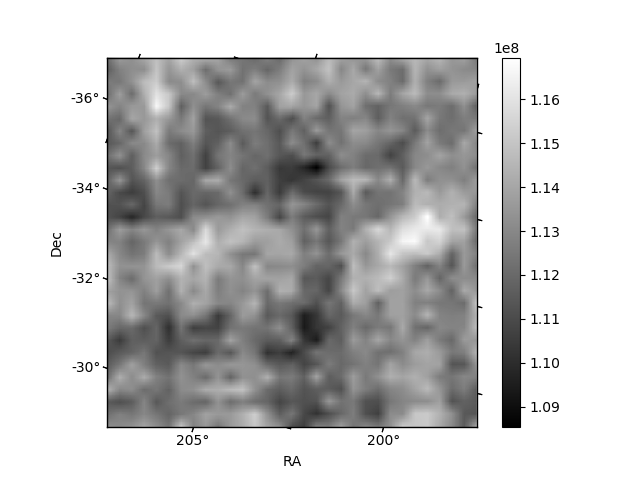
Histogram calculated using DETX and DETY for each event in the final _common_clean file
| Quadrant A | 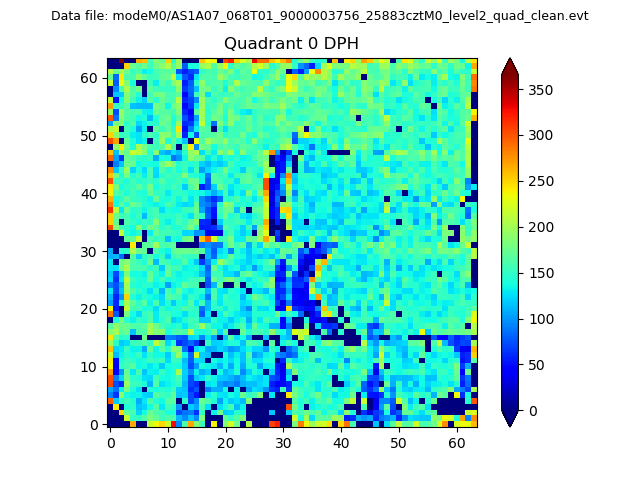 |
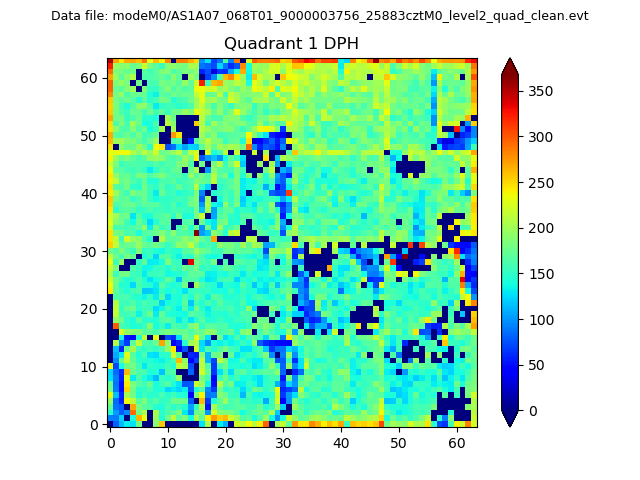 |
Quadrant B |
|---|---|---|---|
| Quadrant D | 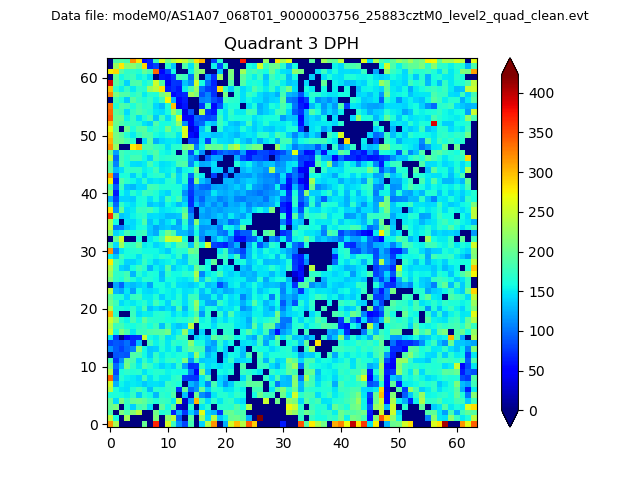 |
 |
Quadrant C |
| Plot type | Count rate plots | Images |
|---|---|---|
| Comparison with Poisson distribution Blue bars denote a histogram of data divided into 1 sec bins. Red curve is a Poisson curve with rate = median count rate of data. |
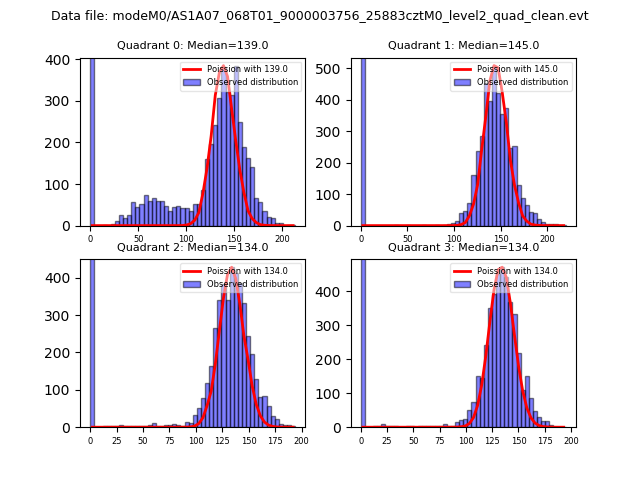 |
 |
| Quadrant-wise count rates Data is divided into 100 sec bins |
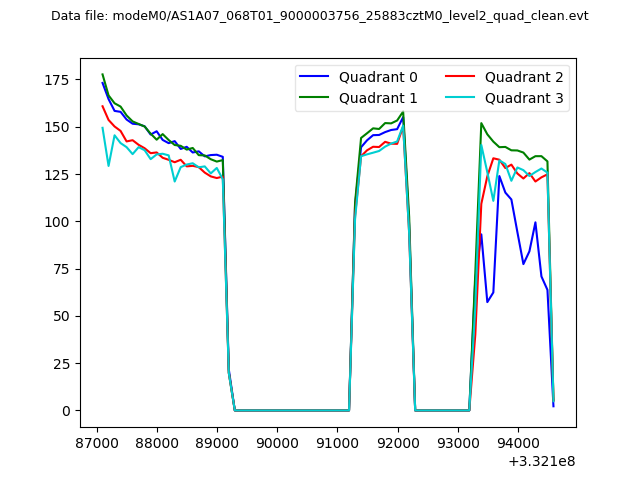 |
|
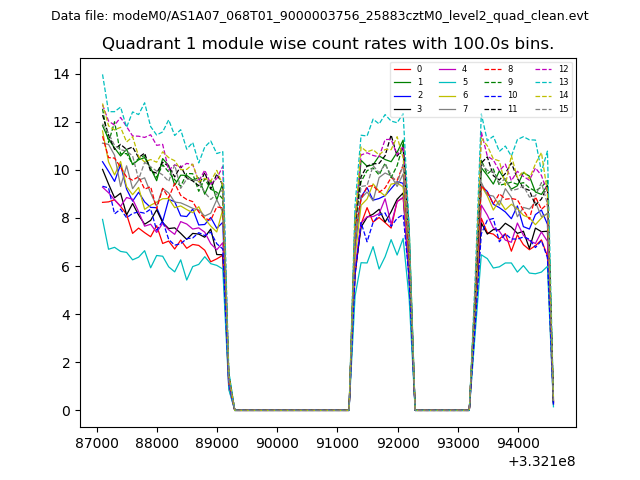
| Module-wise count rates for Quadrant A Data is divided into 100 sec bins |
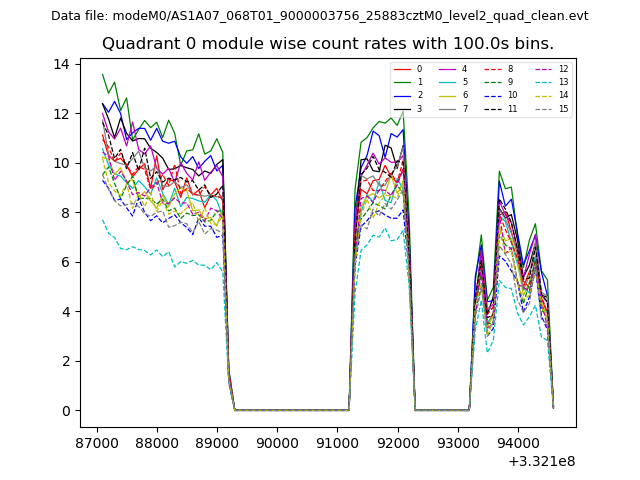 |
 |
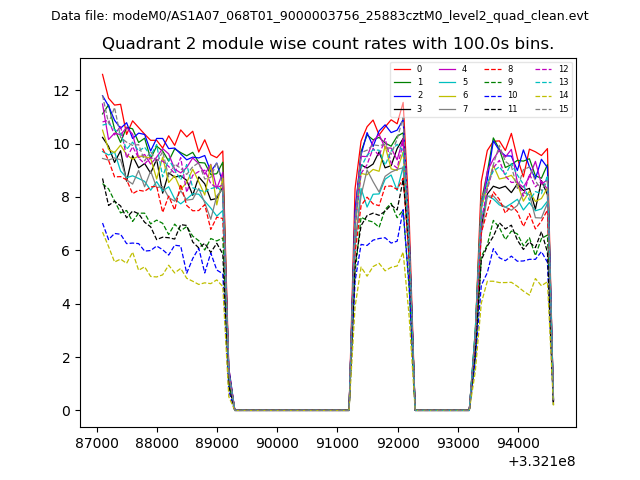
| Module-wise count rates for Quadrant B Data is divided into 100 sec bins |
 |
 |
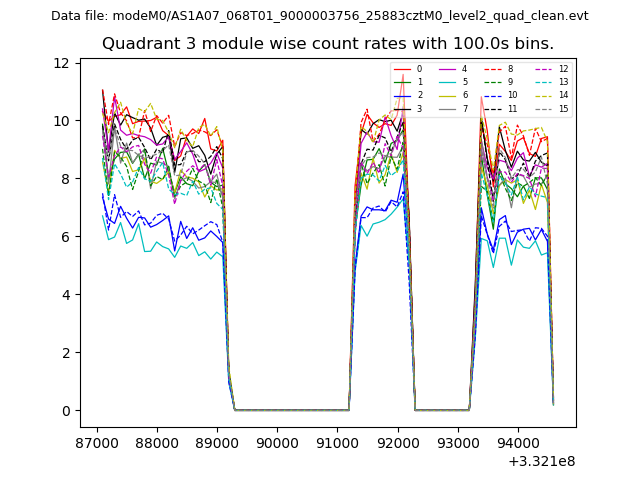
| Module-wise count rates for Quadrant C Data is divided into 100 sec bins |
 |
 |
| Module-wise count rates for Quadrant D Data is divided into 100 sec bins |
 |
 |
| Parameter | Plot |
|---|---|
| CZT HV Monitor | 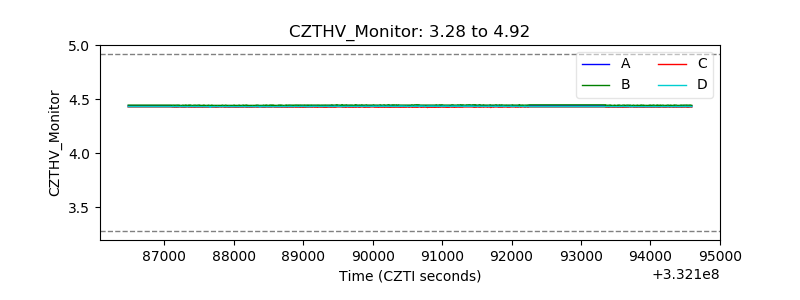 |
| D_VDD | 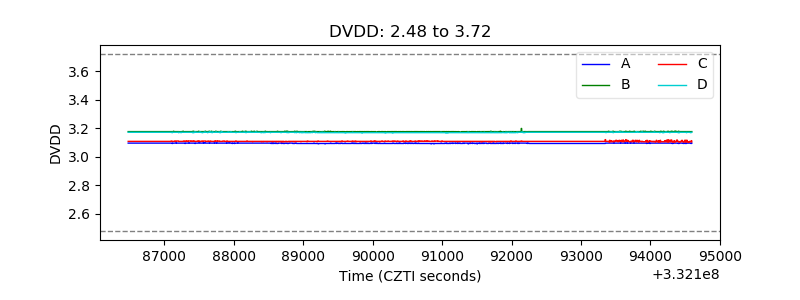 |
| Temperature 1 | 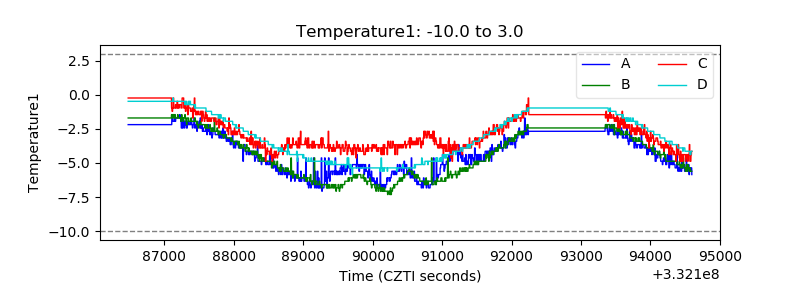 |
| Veto HV Monitor | 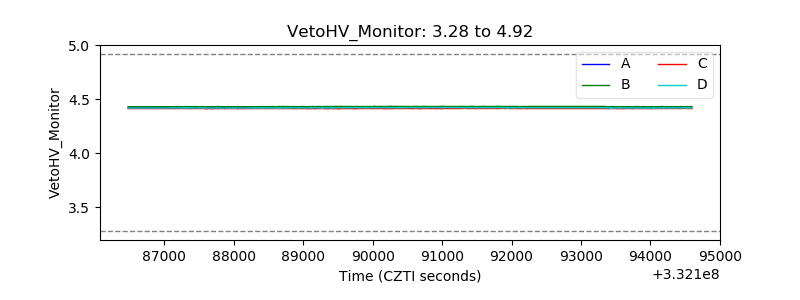 |
| Veto LLD | 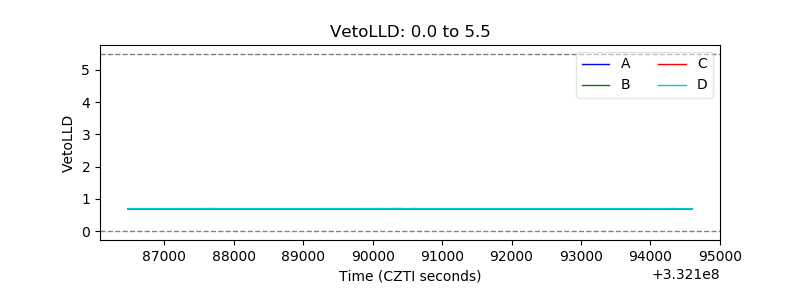 |
| Alpha Counter | 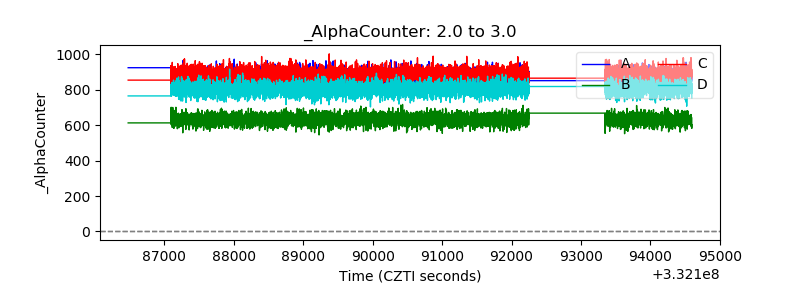 |
| _CPM_Rate | 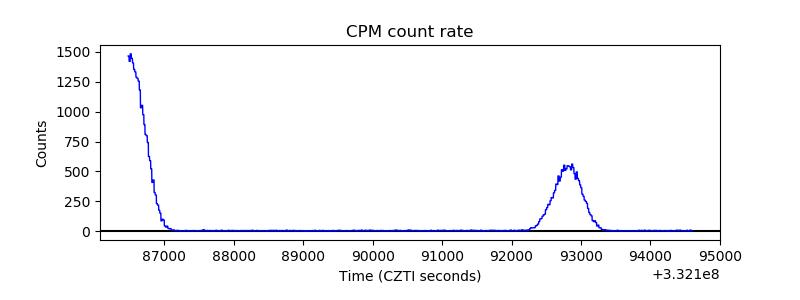 |
| CZT Counter | 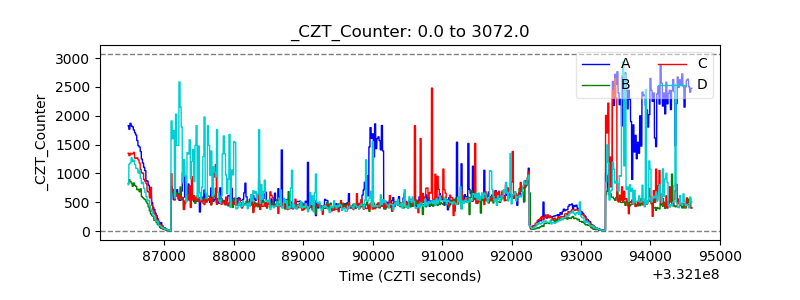 |
| +2.5 Volts monitor |  |
| +5 Volts monitor | 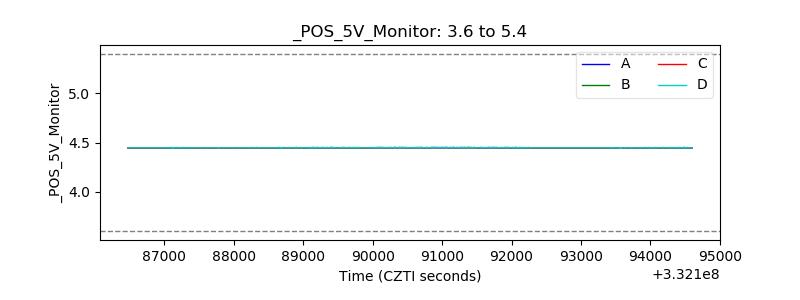 |
| _ROLL_ROT | 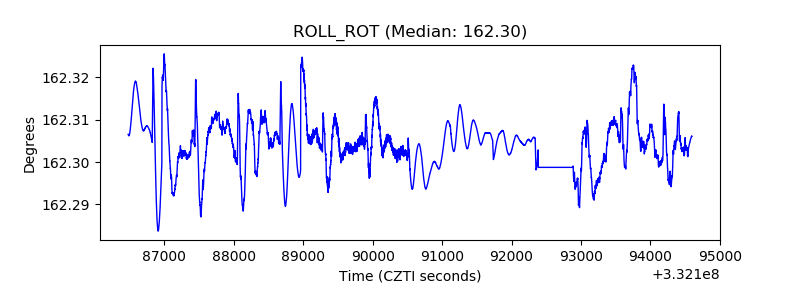 |
| _Roll_DEC |  |
| _Roll_RA | 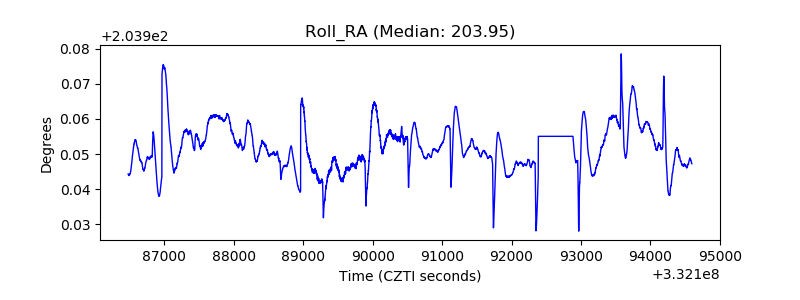 |
| Veto Counter | 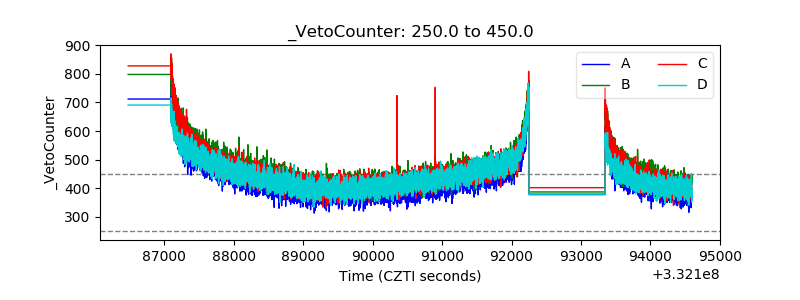 |