| Param | Original file | Final file |
|---|---|---|
| Filename | modeM0/AS1A07_068T01_9000003756_25884cztM0_level2.evt | modeM0/AS1A07_068T01_9000003756_25884cztM0_level2_quad_clean.evt |
| Size (bytes) | 620,576,640 | 94,881,600 |
| Size | 591.8 MB | 90.5 MB |
| Events in quadrant A | 7,323,299 | 558,776 |
| Events in quadrant B | 3,331,802 | 641,360 |
| Events in quadrant C | 3,918,490 | 593,605 |
| Events in quadrant D | 3,755,972 | 601,154 |
| Mode M0 | |||
|---|---|---|---|
| Quadrant | BADHDUFLAG | Total packets | Discarded packets |
| A | 0 | 26140 | 0 |
| B | 0 | 14260 | 0 |
| C | 0 | 16027 | 0 |
| D | 0 | 15725 | 0 |
| Mode M9 | |||
|---|---|---|---|
| Quadrant | BADHDUFLAG | Total packets | Discarded packets |
| A | 0 | 10 | 0 |
| B | 0 | 11 | 0 |
| C | 0 | 11 | 0 |
| D | 0 | 11 | 0 |
| Quadrant | Total seconds | Saturated seconds | Saturation percentage |
|---|---|---|---|
| A | 6855 | 1439 | 20.991977% |
| B | 6855 | 27 | 0.393873% |
| C | 6855 | 216 | 3.150985% |
| D | 6855 | 86 | 1.254559% |
Noise dominated data is calculated using 1-second bins in cleaned event files. If a bin has >2000 counts, and if more than 50% of those come from <1% of pixels, then it is considered to be noise-dominated and hence unusable.
| Quadrant | # 1 sec bins | Bins with >0 counts | Bins with >2000 counts | High rate bins dominated by noise | Noise dominated (total time) | Noise dominated (detector-on time) | Marked lightcurve |
|---|---|---|---|---|---|---|---|
| A | 7620 | 6856 | 1429 | 1429 | 18.75% | 20.84% | 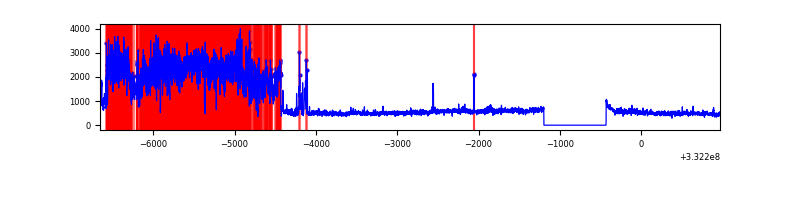 |
| B | 7620 | 6856 | 1 | 1 | 0.01% | 0.01% | 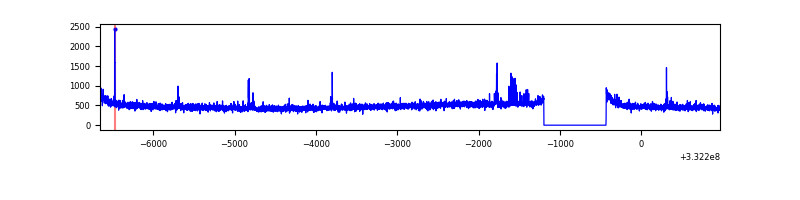 |
| C | 7620 | 6856 | 106 | 106 | 1.39% | 1.55% | 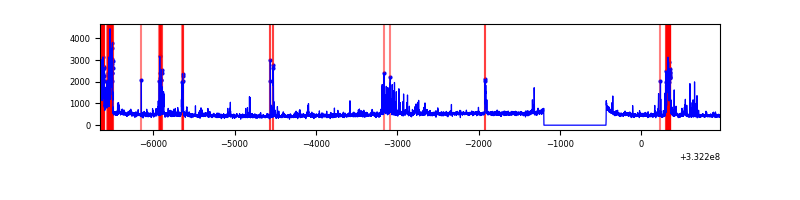 |
| D | 7620 | 6856 | 57 | 57 | 0.75% | 0.83% | 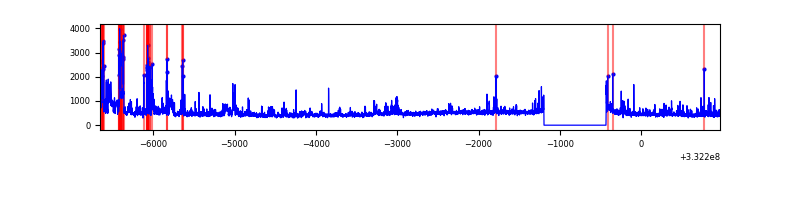 |
Top three noisy pixels from each quadrant. If the there are fewer than three noisy pixels in the level2.evt file, extra rows are filled as -1
| Pixel properties | Quadrant properties | ||||||
|---|---|---|---|---|---|---|---|
| Quadrant | DetID | PixID | Counts | Sigma | Mean | Median | Sigma |
| A | 0 | 13 | 4330849 | 27759.47 | 776 | 761 | 156.0 |
| A | 13 | 254 | 10033 | 59.44 | 776 | 761 | 156.0 |
| A | 3 | 137 | 7422 | 42.7 | 776 | 761 | 156.0 |
| B | 0 | 190 | 31020 | 190.59 | 828 | 806 | 158.5 |
| B | 12 | 111 | 19082 | 115.28 | 828 | 806 | 158.5 |
| B | 11 | 111 | 17181 | 103.29 | 828 | 806 | 158.5 |
| C | 3 | 233 | 644540 | 3504.44 | 777 | 779 | 183.7 |
| C | 14 | 238 | 126698 | 685.46 | 777 | 779 | 183.7 |
| C | 7 | 238 | 101813 | 550.0 | 777 | 779 | 183.7 |
| D | 1 | 52 | 538970 | 2822.67 | 794 | 775 | 190.7 |
| D | 5 | 223 | 161869 | 844.89 | 794 | 775 | 190.7 |
| D | 2 | 234 | 28461 | 145.2 | 794 | 775 | 190.7 |
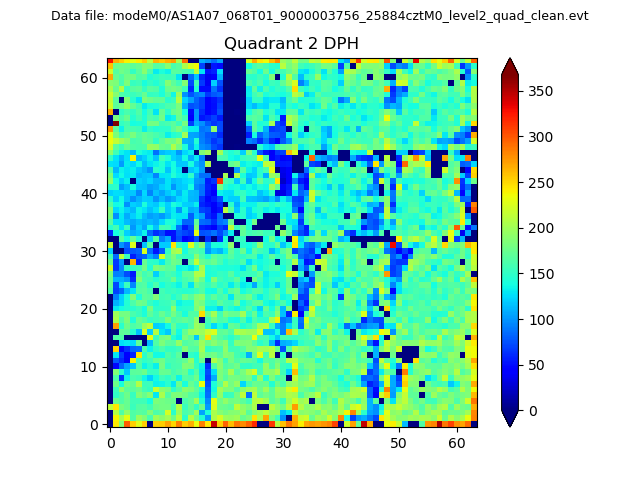
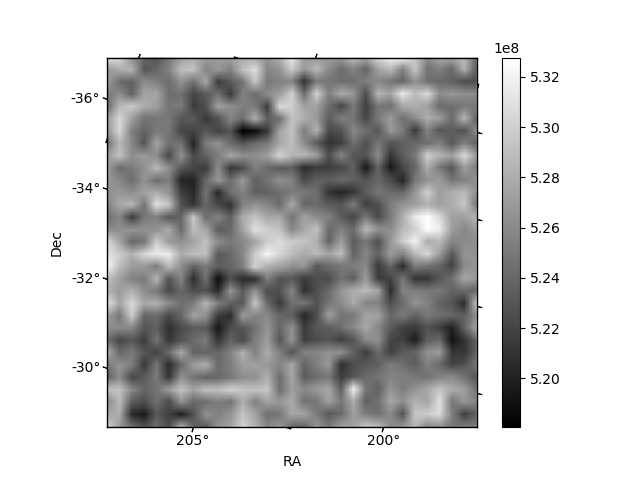
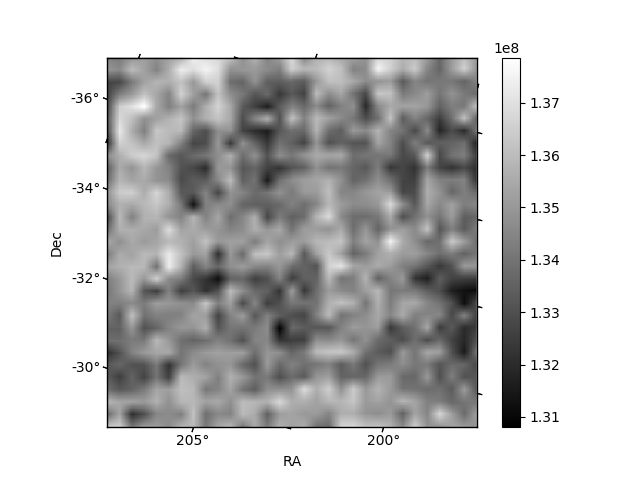
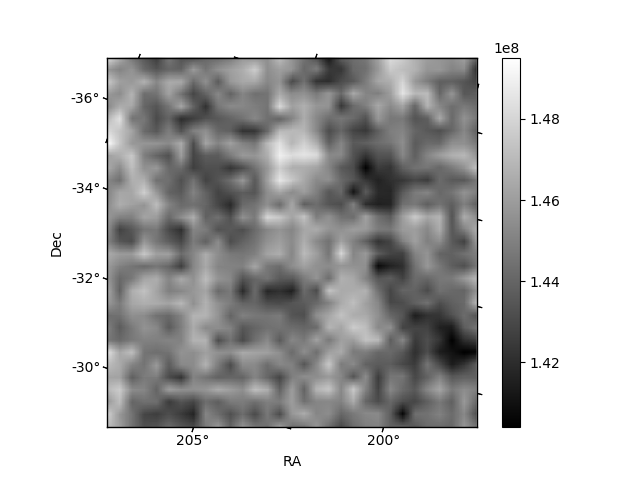
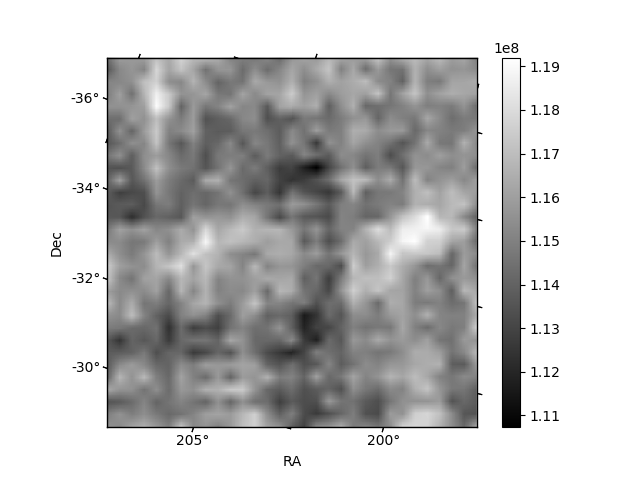
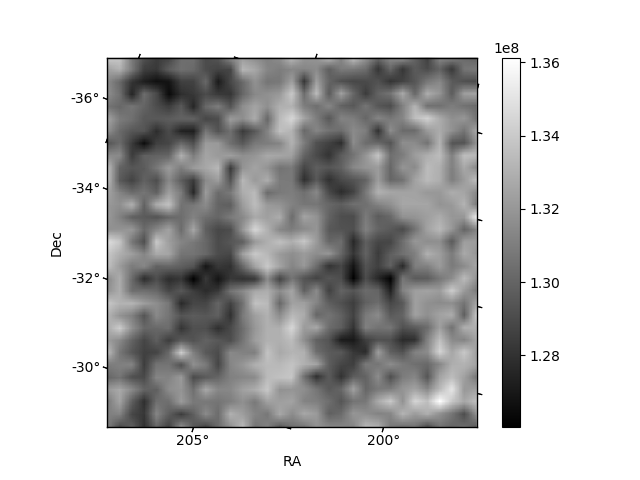
Histogram calculated using DETX and DETY for each event in the final _common_clean file
| Quadrant A | 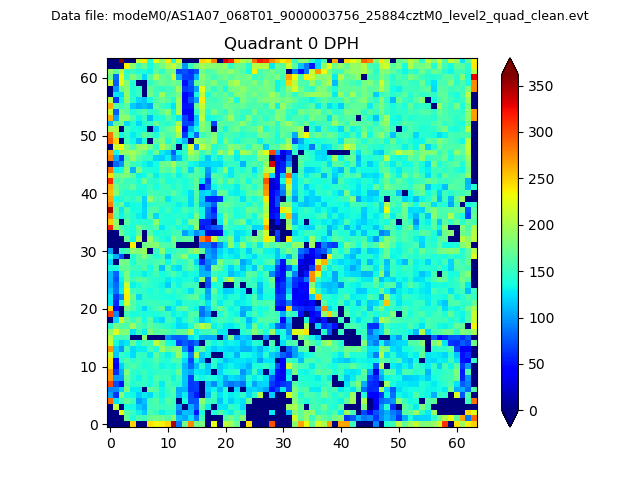 |
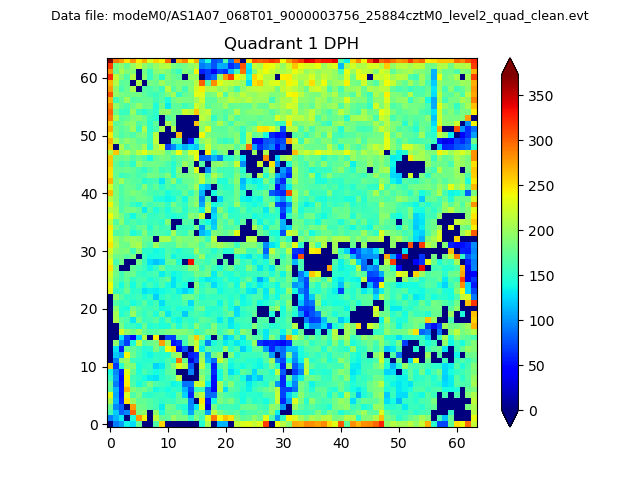 |
Quadrant B |
|---|---|---|---|
| Quadrant D | 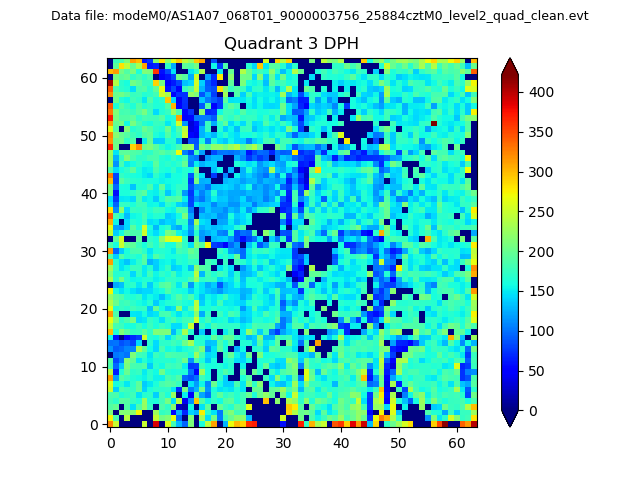 |
 |
Quadrant C |
| Plot type | Count rate plots | Images |
|---|---|---|
| Comparison with Poisson distribution Blue bars denote a histogram of data divided into 1 sec bins. Red curve is a Poisson curve with rate = median count rate of data. |
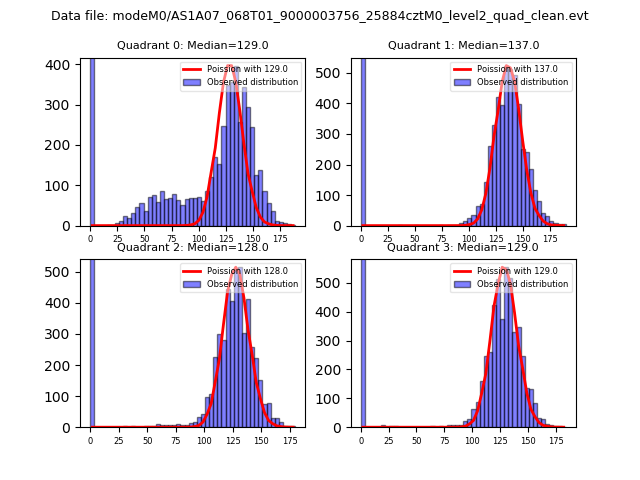 |
 |
| Quadrant-wise count rates Data is divided into 100 sec bins |
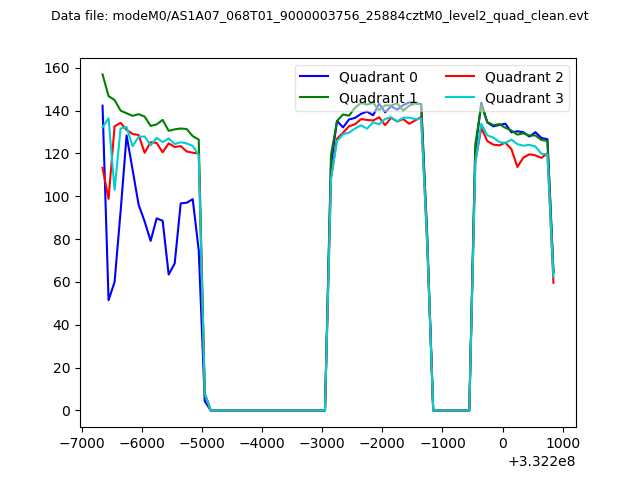 |
|
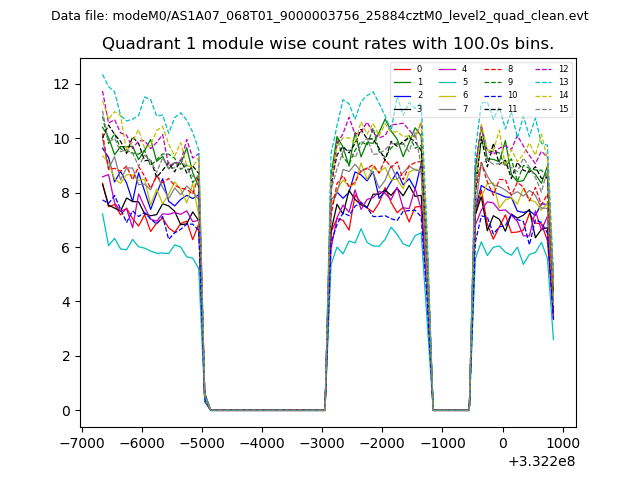
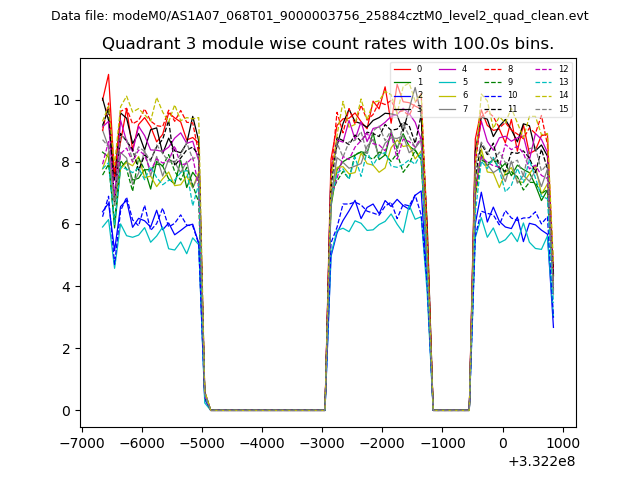
| Module-wise count rates for Quadrant A Data is divided into 100 sec bins |
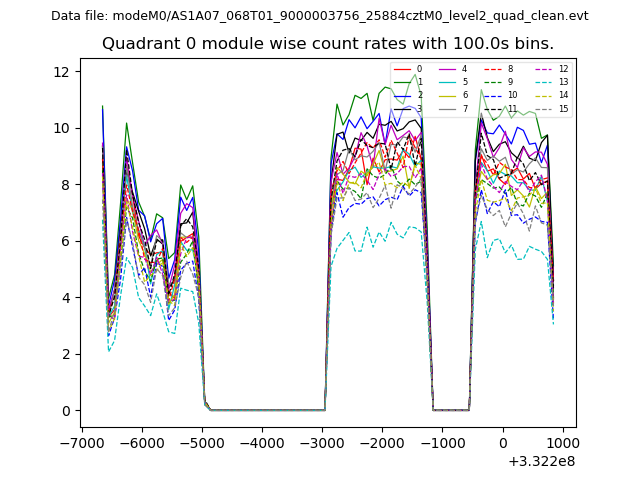 |
 |
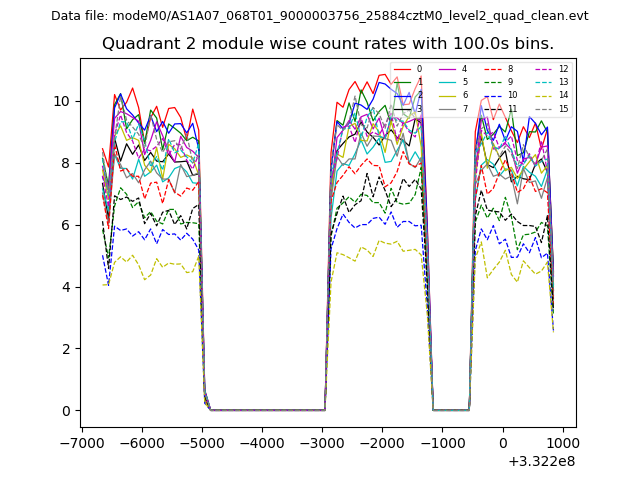
| Module-wise count rates for Quadrant B Data is divided into 100 sec bins |
 |
 |
| Module-wise count rates for Quadrant C Data is divided into 100 sec bins |
 |
 |
| Module-wise count rates for Quadrant D Data is divided into 100 sec bins |
 |
 |
| Parameter | Plot |
|---|---|
| CZT HV Monitor | 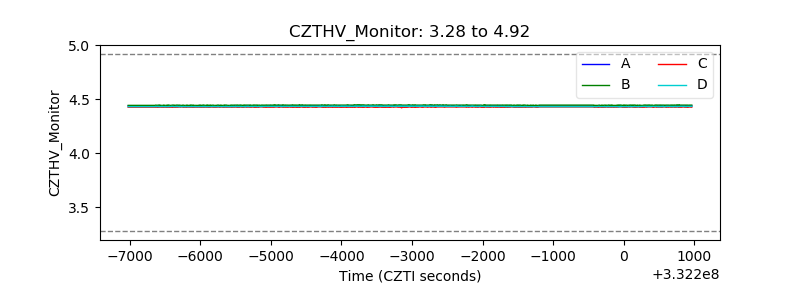 |
| D_VDD | 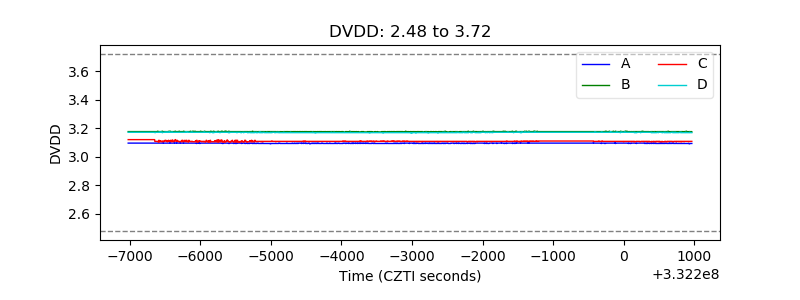 |
| Temperature 1 | 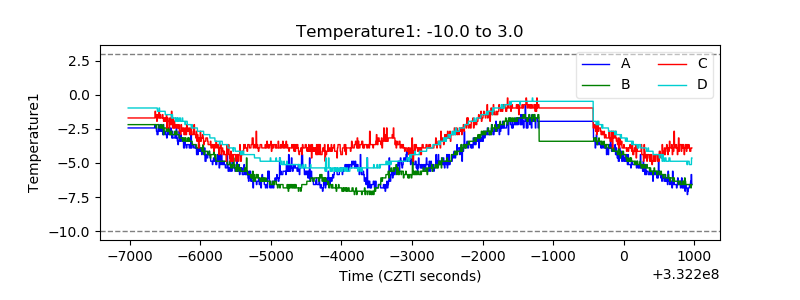 |
| Veto HV Monitor | 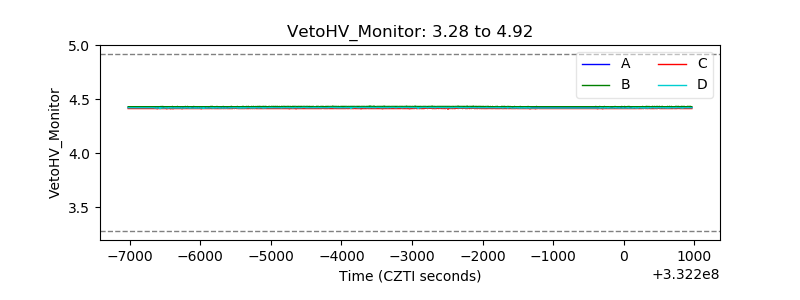 |
| Veto LLD | 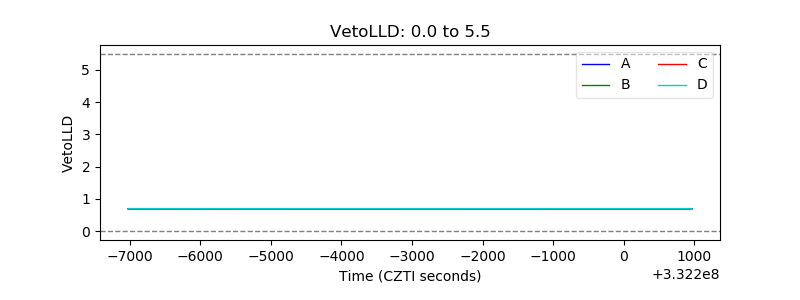 |
| Alpha Counter | 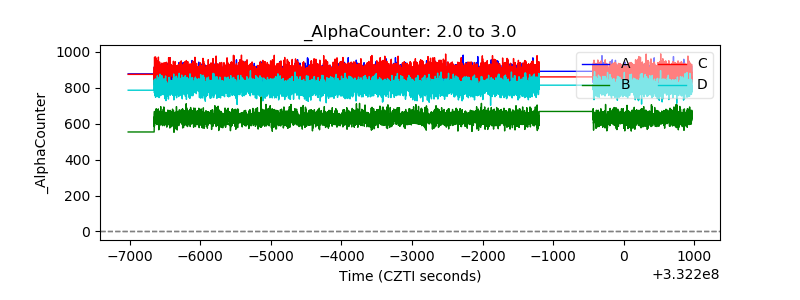 |
| _CPM_Rate | 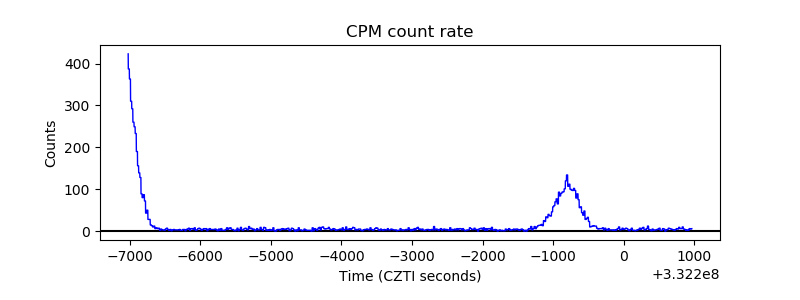 |
| CZT Counter | 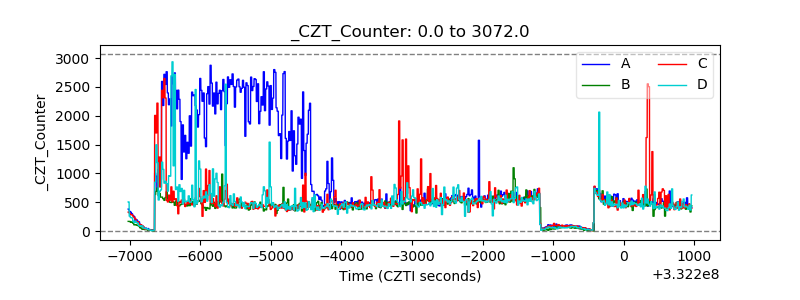 |
| +2.5 Volts monitor |  |
| +5 Volts monitor |  |
| _ROLL_ROT | 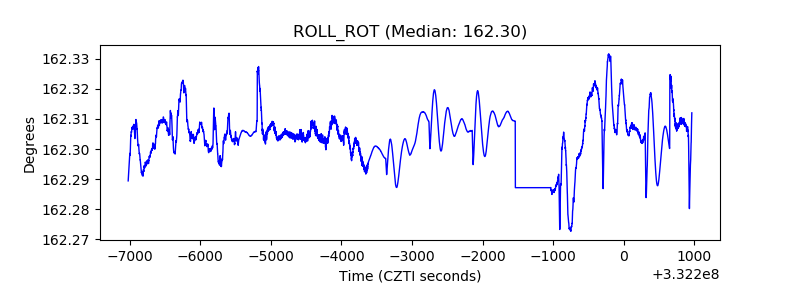 |
| _Roll_DEC | 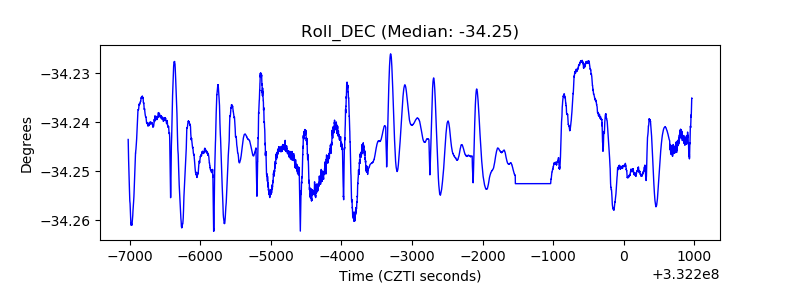 |
| _Roll_RA | 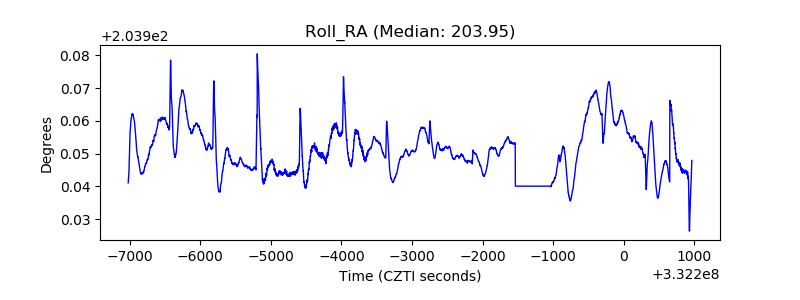 |
| Veto Counter | 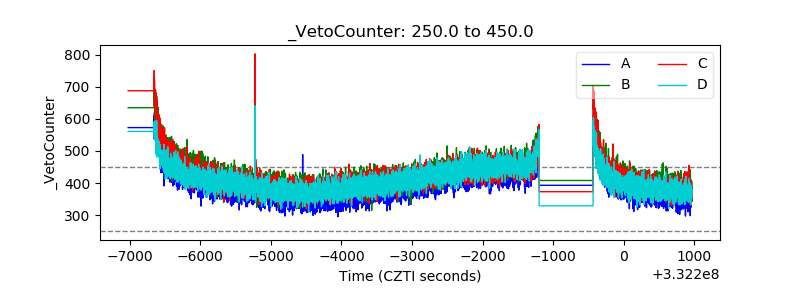 |