| Param | Original file | Final file |
|---|---|---|
| Filename | modeM0/AS1A07_068T01_9000003756_25885cztM0_level2.evt | modeM0/AS1A07_068T01_9000003756_25885cztM0_level2_quad_clean.evt |
| Size (bytes) | 536,693,760 | 96,220,800 |
| Size | 511.8 MB | 91.8 MB |
| Events in quadrant A | 3,909,546 | 616,579 |
| Events in quadrant B | 3,472,459 | 626,316 |
| Events in quadrant C | 4,427,759 | 575,306 |
| Events in quadrant D | 3,951,089 | 589,681 |
| Mode M0 | |||
|---|---|---|---|
| Quadrant | BADHDUFLAG | Total packets | Discarded packets |
| A | 0 | 16142 | 0 |
| B | 0 | 14989 | 0 |
| C | 0 | 18079 | 0 |
| D | 0 | 16839 | 0 |
| Mode M9 | |||
|---|---|---|---|
| Quadrant | BADHDUFLAG | Total packets | Discarded packets |
| A | 0 | 10 | 0 |
| B | 0 | 11 | 0 |
| C | 0 | 11 | 0 |
| D | 0 | 11 | 0 |
| Quadrant | Total seconds | Saturated seconds | Saturation percentage |
|---|---|---|---|
| A | 7271 | 92 | 1.265301% |
| B | 7271 | 53 | 0.728923% |
| C | 7271 | 323 | 4.442305% |
| D | 7271 | 64 | 0.880209% |
Noise dominated data is calculated using 1-second bins in cleaned event files. If a bin has >2000 counts, and if more than 50% of those come from <1% of pixels, then it is considered to be noise-dominated and hence unusable.
| Quadrant | # 1 sec bins | Bins with >0 counts | Bins with >2000 counts | High rate bins dominated by noise | Noise dominated (total time) | Noise dominated (detector-on time) | Marked lightcurve |
|---|---|---|---|---|---|---|---|
| A | 7696 | 7272 | 28 | 28 | 0.36% | 0.39% | 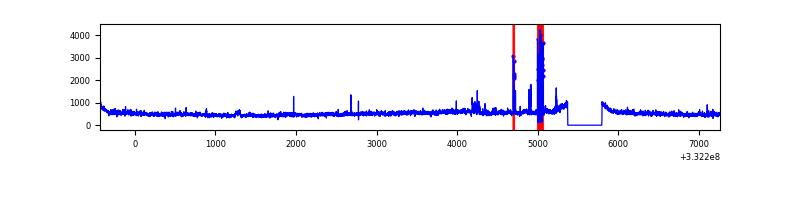 |
| B | 7696 | 7272 | 0 | 0 | 0.00% | 0.00% | 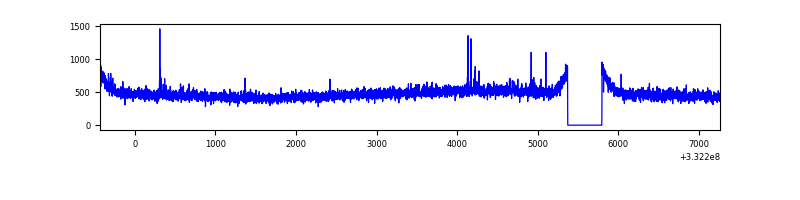 |
| C | 7696 | 7272 | 151 | 151 | 1.96% | 2.08% | 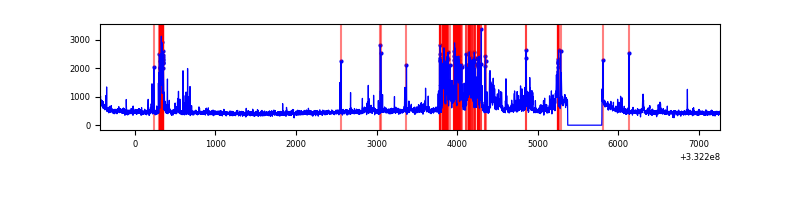 |
| D | 7696 | 7272 | 34 | 34 | 0.44% | 0.47% | 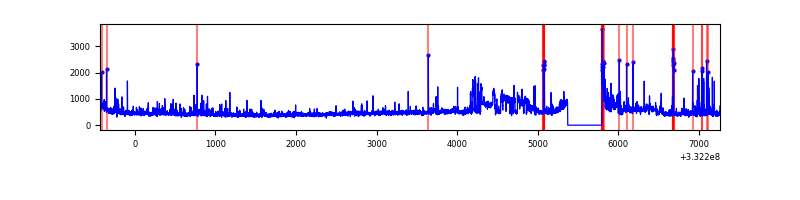 |
Top three noisy pixels from each quadrant. If the there are fewer than three noisy pixels in the level2.evt file, extra rows are filled as -1
| Pixel properties | Quadrant properties | ||||||
|---|---|---|---|---|---|---|---|
| Quadrant | DetID | PixID | Counts | Sigma | Mean | Median | Sigma |
| A | 0 | 13 | 517360 | 2920.32 | 879 | 862 | 176.9 |
| A | 13 | 254 | 11561 | 60.49 | 879 | 862 | 176.9 |
| A | 3 | 137 | 8263 | 41.84 | 879 | 862 | 176.9 |
| B | 12 | 111 | 20956 | 119.73 | 873 | 849 | 167.9 |
| B | 11 | 111 | 18829 | 107.06 | 873 | 849 | 167.9 |
| B | 0 | 219 | 17556 | 99.48 | 873 | 849 | 167.9 |
| C | 3 | 233 | 955034 | 4940.34 | 822 | 824 | 193.1 |
| C | 14 | 238 | 131605 | 677.11 | 822 | 824 | 193.1 |
| C | 7 | 238 | 123481 | 635.04 | 822 | 824 | 193.1 |
| D | 1 | 52 | 536005 | 2655.72 | 843 | 820 | 201.5 |
| D | 5 | 223 | 101301 | 498.61 | 843 | 820 | 201.5 |
| D | 7 | 80 | 92925 | 457.05 | 843 | 820 | 201.5 |
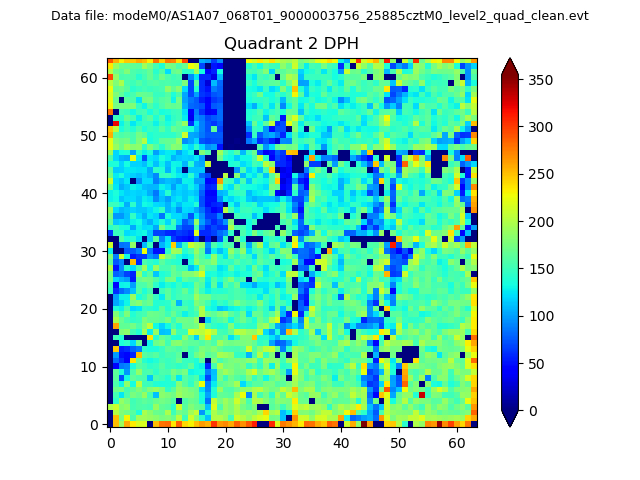
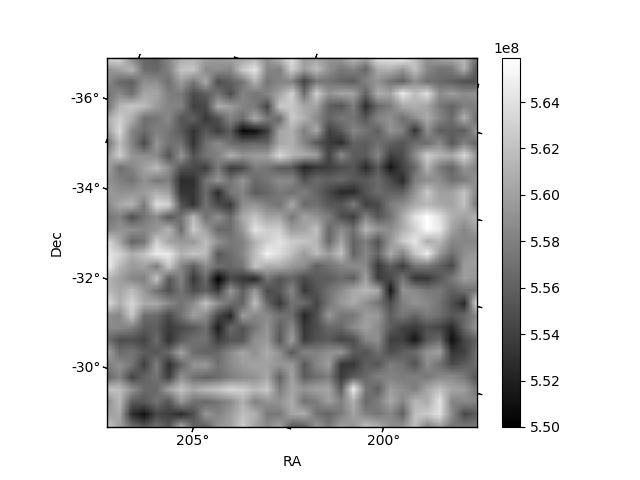
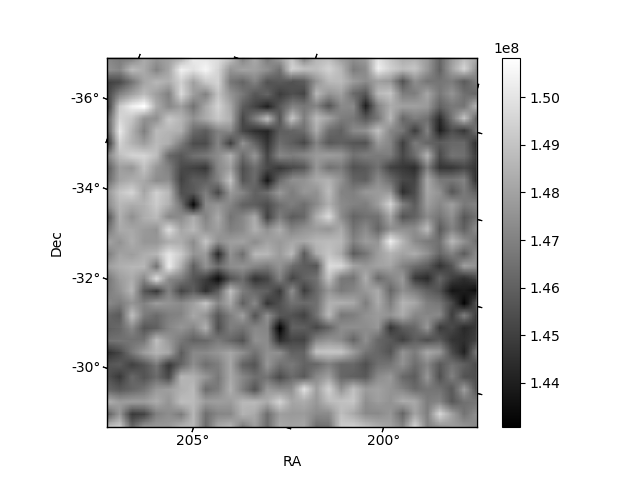
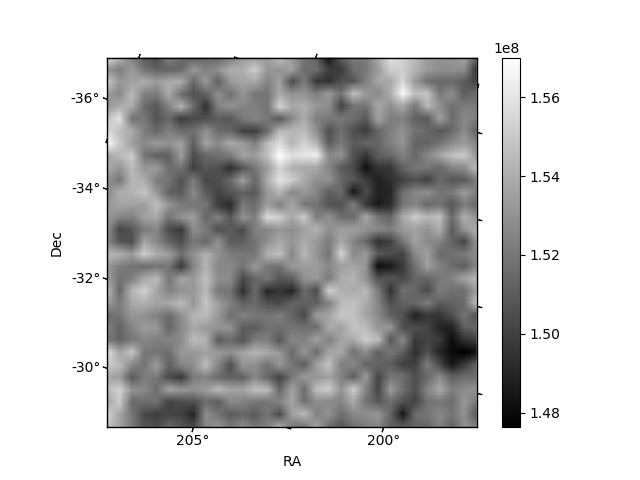
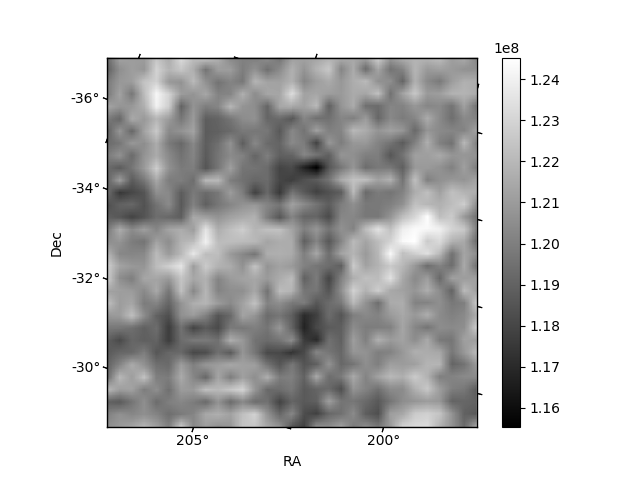
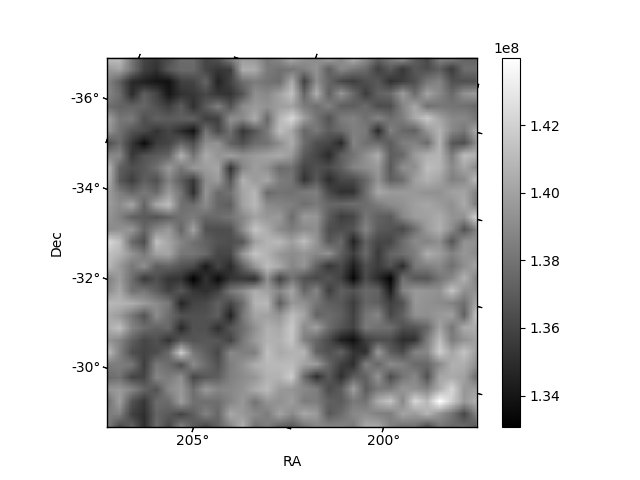
Histogram calculated using DETX and DETY for each event in the final _common_clean file
| Quadrant A | 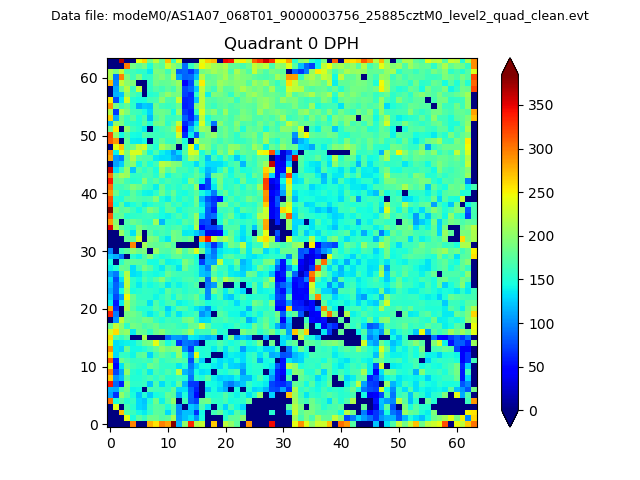 |
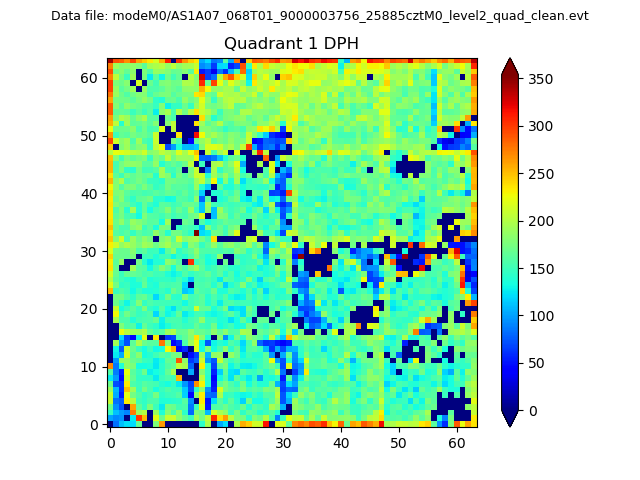 |
Quadrant B |
|---|---|---|---|
| Quadrant D | 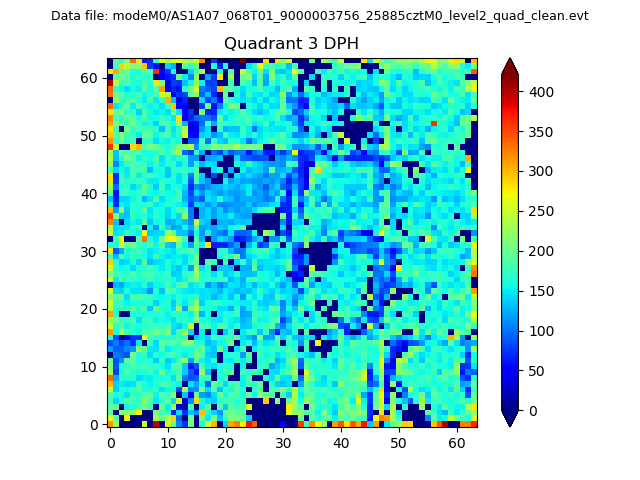 |
 |
Quadrant C |
| Plot type | Count rate plots | Images |
|---|---|---|
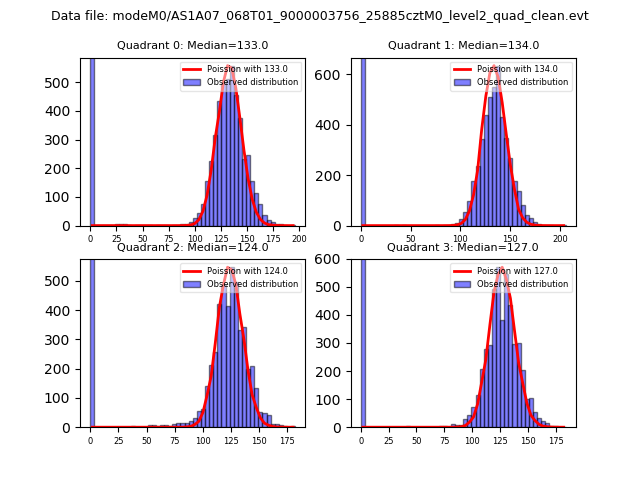
| Comparison with Poisson distribution Blue bars denote a histogram of data divided into 1 sec bins. Red curve is a Poisson curve with rate = median count rate of data. |
 |
 |
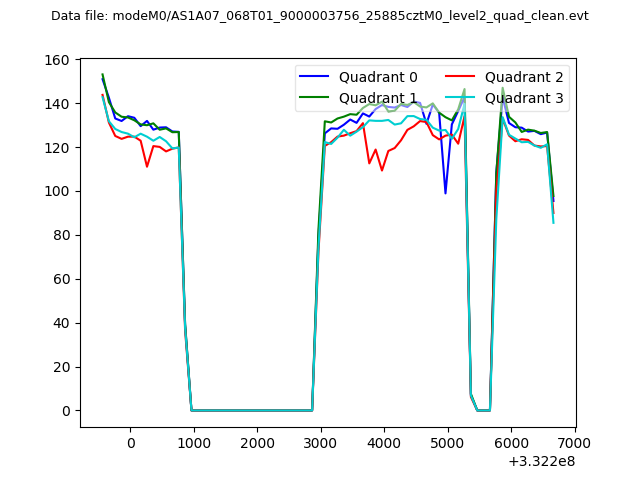
| Quadrant-wise count rates Data is divided into 100 sec bins |
 |
|
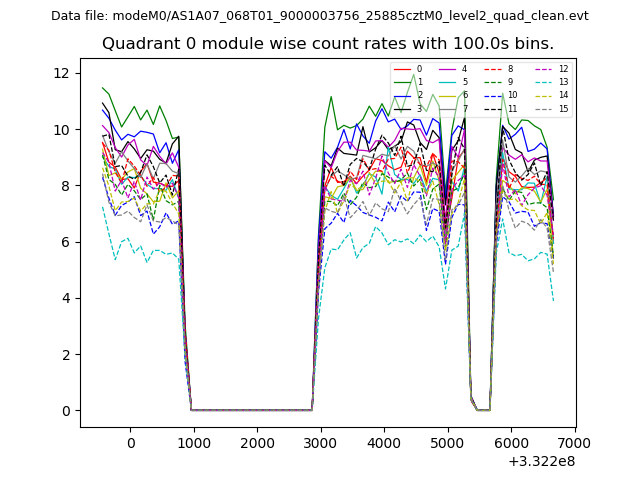
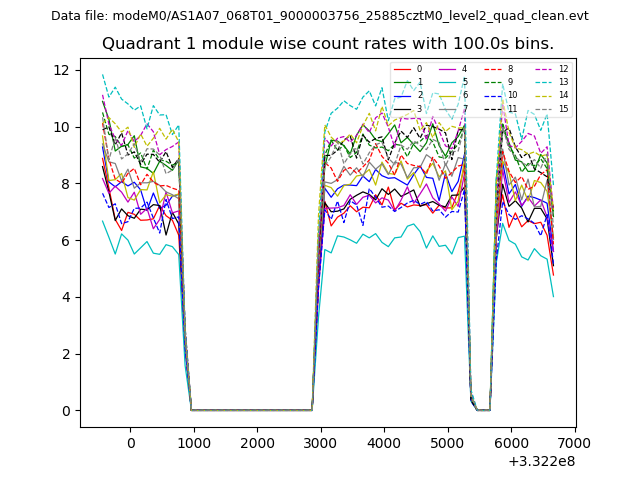
| Module-wise count rates for Quadrant A Data is divided into 100 sec bins |
 |
 |
| Module-wise count rates for Quadrant B Data is divided into 100 sec bins |
 |
 |
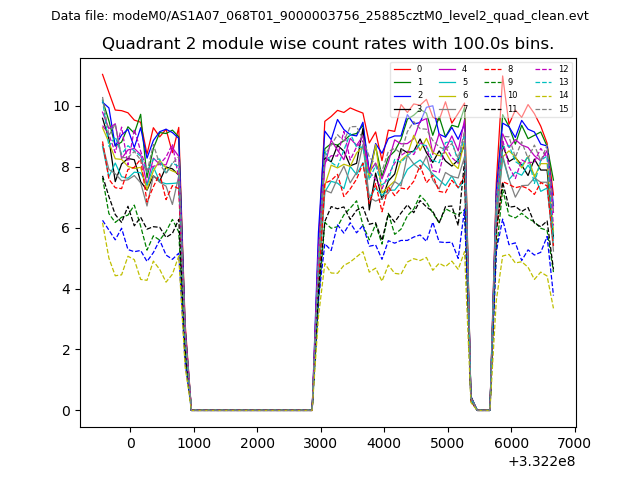
| Module-wise count rates for Quadrant C Data is divided into 100 sec bins |
 |
 |
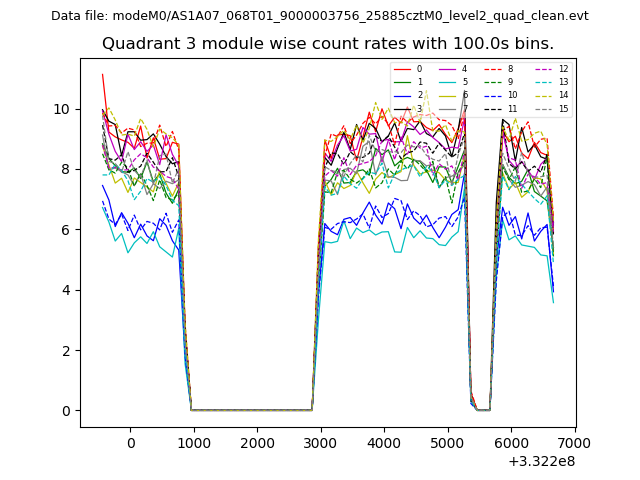
| Module-wise count rates for Quadrant D Data is divided into 100 sec bins |
 |
 |
| Parameter | Plot |
|---|---|
| CZT HV Monitor | 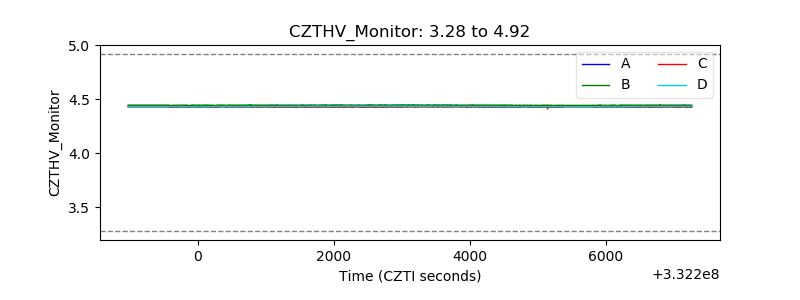 |
| D_VDD | 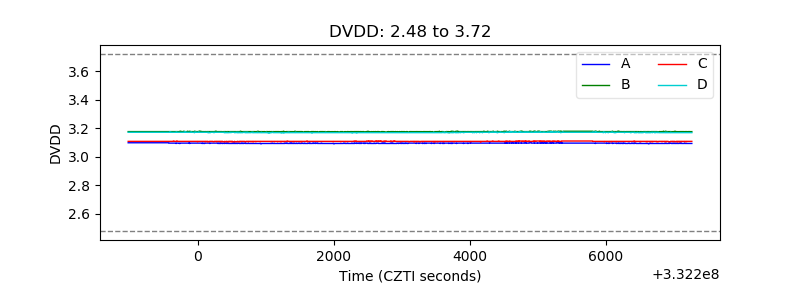 |
| Temperature 1 | 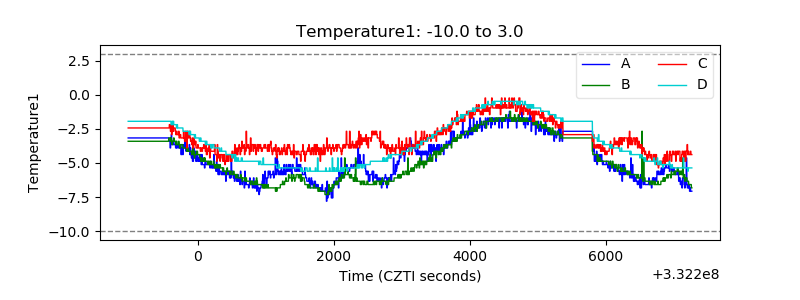 |
| Veto HV Monitor | 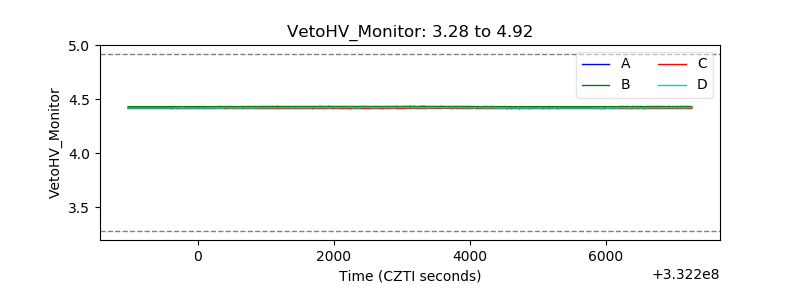 |
| Veto LLD | 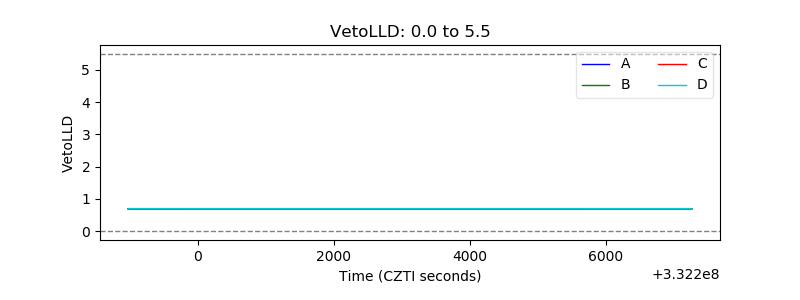 |
| Alpha Counter | 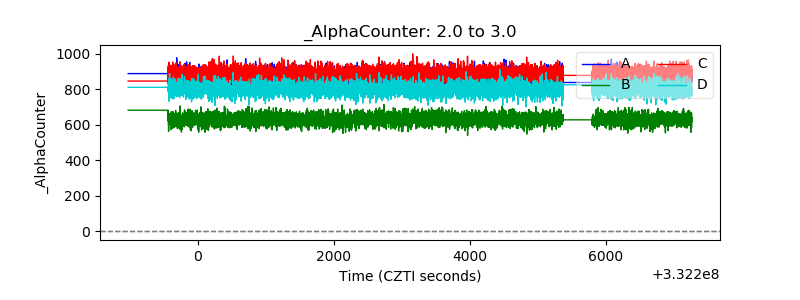 |
| _CPM_Rate | 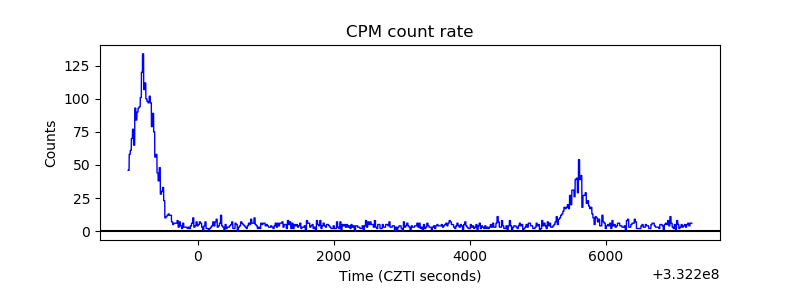 |
| CZT Counter | 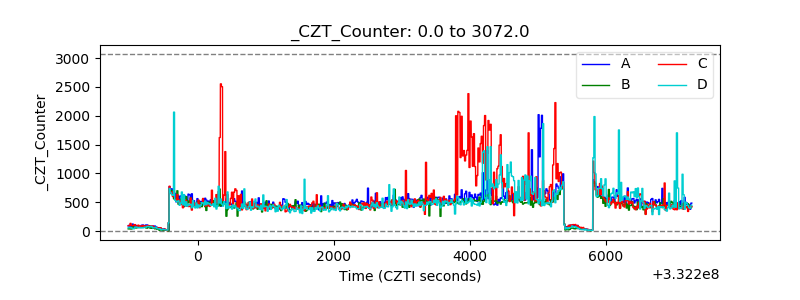 |
| +2.5 Volts monitor | 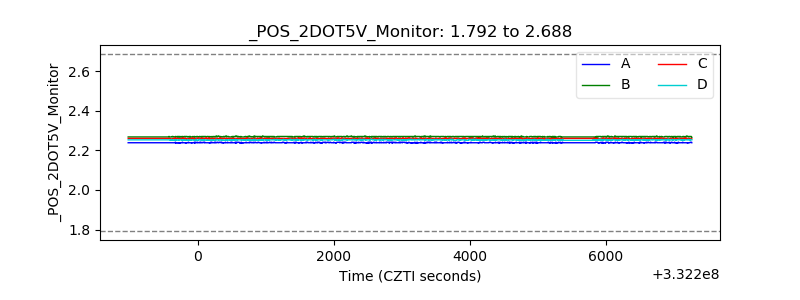 |
| +5 Volts monitor | 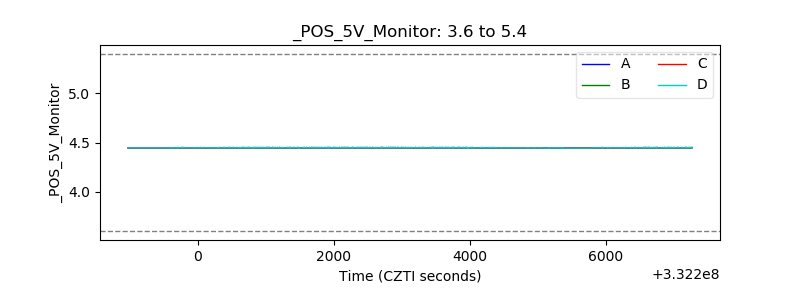 |
| _ROLL_ROT | 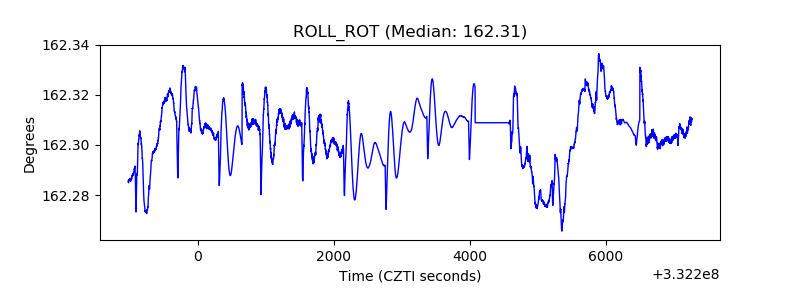 |
| _Roll_DEC |  |
| _Roll_RA | 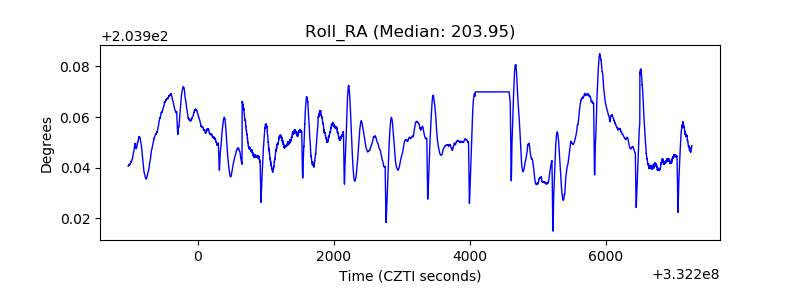 |
| Veto Counter | 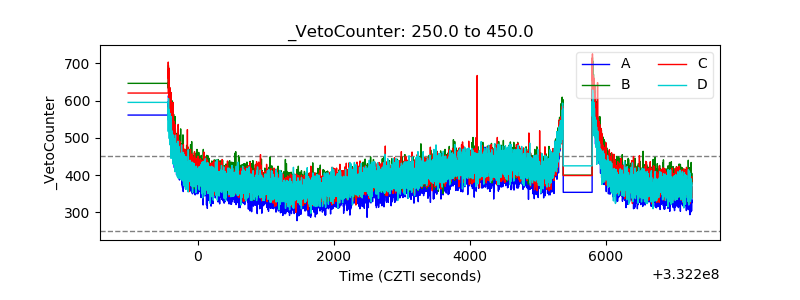 |