| Param | Original file | Final file |
|---|---|---|
| Filename | modeM0/AS1A07_068T01_9000003756_25886cztM0_level2.evt | modeM0/AS1A07_068T01_9000003756_25886cztM0_level2_quad_clean.evt |
| Size (bytes) | 597,934,080 | 105,661,440 |
| Size | 570.2 MB | 100.8 MB |
| Events in quadrant A | 4,563,959 | 668,252 |
| Events in quadrant B | 4,424,955 | 671,938 |
| Events in quadrant C | 4,130,724 | 640,262 |
| Events in quadrant D | 4,426,939 | 643,705 |
| Mode M0 | |||
|---|---|---|---|
| Quadrant | BADHDUFLAG | Total packets | Discarded packets |
| A | 0 | 18547 | 0 |
| B | 0 | 18434 | 0 |
| C | 0 | 17741 | 0 |
| D | 0 | 18778 | 0 |
| Mode M9 | |||
|---|---|---|---|
| Quadrant | BADHDUFLAG | Total packets | Discarded packets |
| A | 0 | 9 | 0 |
| B | 0 | 9 | 0 |
| C | 0 | 9 | 0 |
| D | 0 | 9 | 0 |
| Quadrant | Total seconds | Saturated seconds | Saturation percentage |
|---|---|---|---|
| A | 8284 | 126 | 1.521004% |
| B | 8284 | 183 | 2.209078% |
| C | 8285 | 106 | 1.279421% |
| D | 8285 | 57 | 0.687990% |
Noise dominated data is calculated using 1-second bins in cleaned event files. If a bin has >2000 counts, and if more than 50% of those come from <1% of pixels, then it is considered to be noise-dominated and hence unusable.
| Quadrant | # 1 sec bins | Bins with >0 counts | Bins with >2000 counts | High rate bins dominated by noise | Noise dominated (total time) | Noise dominated (detector-on time) | Marked lightcurve |
|---|---|---|---|---|---|---|---|
| A | 9119 | 8286 | 49 | 49 | 0.54% | 0.59% | 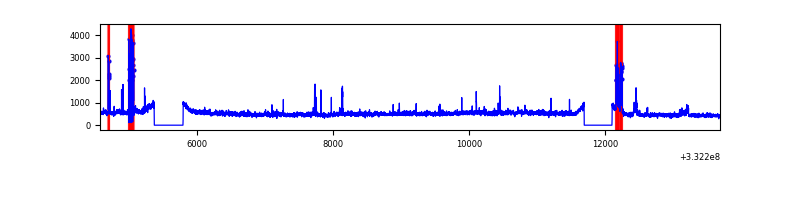 |
| B | 9119 | 8286 | 87 | 87 | 0.95% | 1.05% | 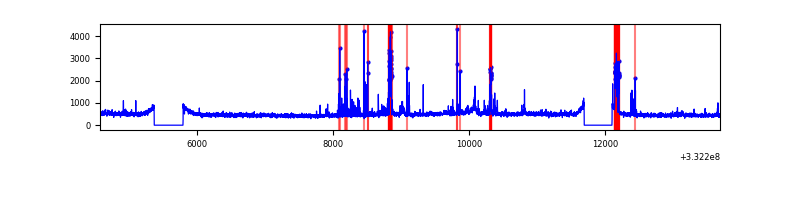 |
| C | 9120 | 8287 | 12 | 12 | 0.13% | 0.14% | 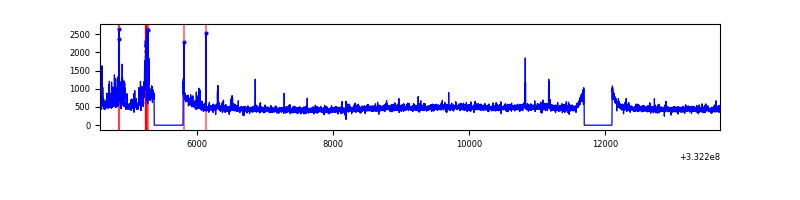 |
| D | 9120 | 8287 | 33 | 33 | 0.36% | 0.40% | 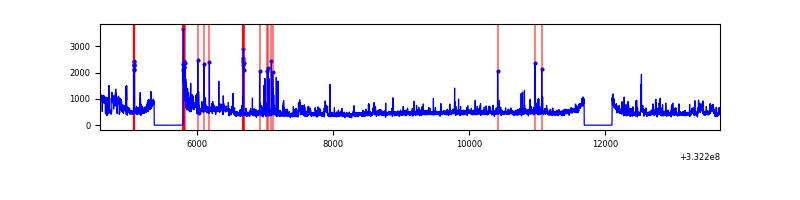 |
Top three noisy pixels from each quadrant. If the there are fewer than three noisy pixels in the level2.evt file, extra rows are filled as -1
| Pixel properties | Quadrant properties | ||||||
|---|---|---|---|---|---|---|---|
| Quadrant | DetID | PixID | Counts | Sigma | Mean | Median | Sigma |
| A | 0 | 13 | 692065 | 3413.36 | 1004 | 983 | 202.5 |
| A | 13 | 254 | 13547 | 62.06 | 1004 | 983 | 202.5 |
| A | 3 | 137 | 9515 | 42.14 | 1004 | 983 | 202.5 |
| B | 10 | 245 | 380143 | 1974.05 | 992 | 967 | 192.1 |
| B | 4 | 171 | 114799 | 592.63 | 992 | 967 | 192.1 |
| B | 12 | 111 | 23956 | 119.68 | 992 | 967 | 192.1 |
| C | 3 | 233 | 264849 | 1176.17 | 952 | 953 | 224.4 |
| C | 14 | 238 | 151307 | 670.12 | 952 | 953 | 224.4 |
| C | 7 | 238 | 7129 | 27.53 | 952 | 953 | 224.4 |
| D | 1 | 52 | 450225 | 1941.49 | 967 | 942 | 231.4 |
| D | 7 | 80 | 177673 | 763.71 | 967 | 942 | 231.4 |
| D | 5 | 223 | 110093 | 471.68 | 967 | 942 | 231.4 |
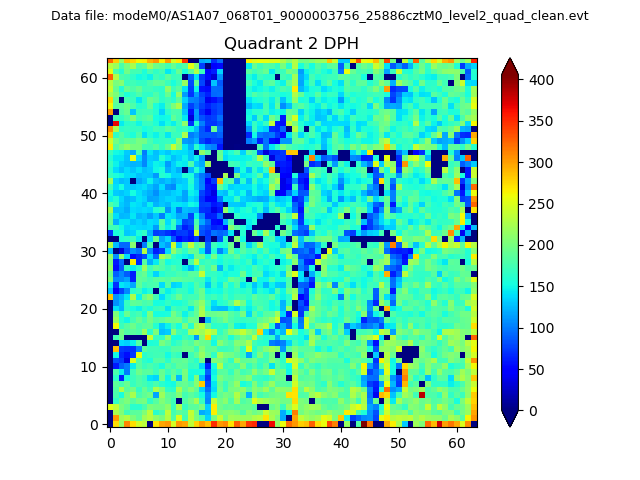
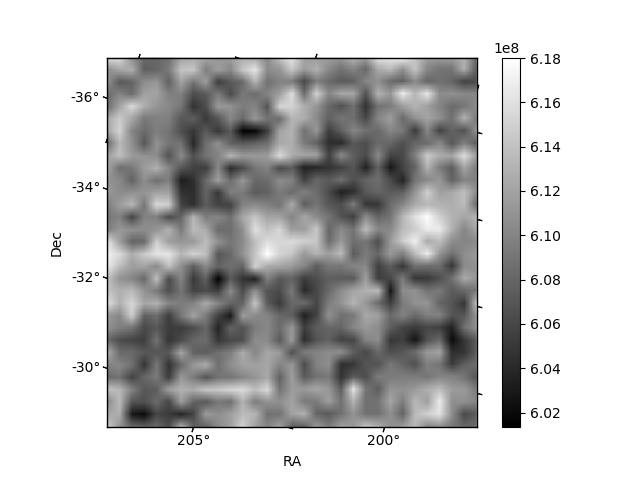
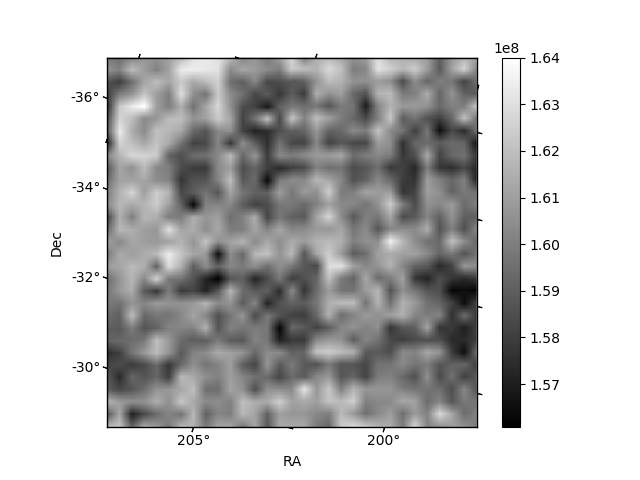
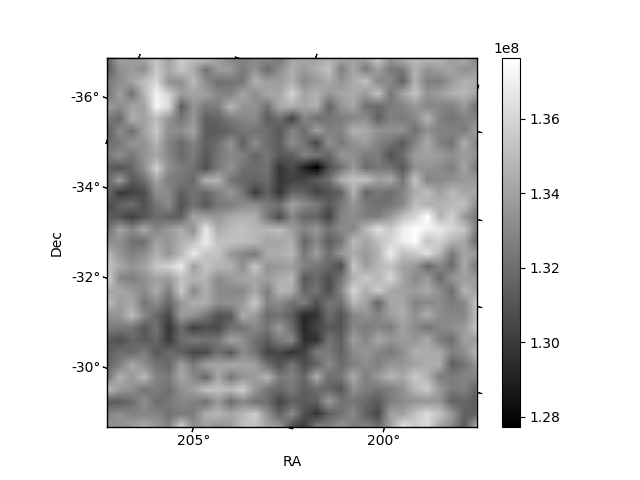
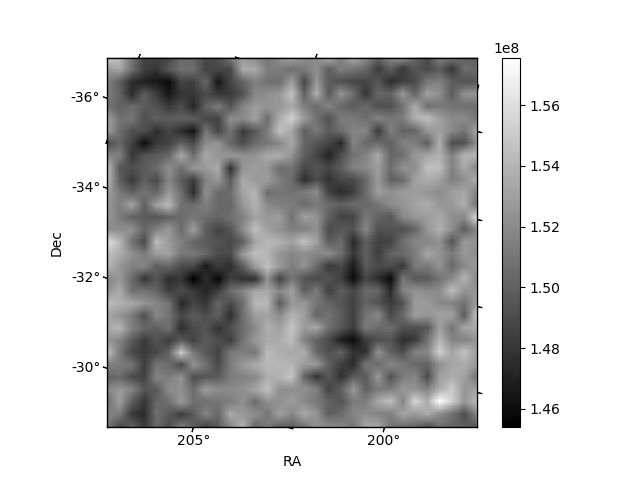
Histogram calculated using DETX and DETY for each event in the final _common_clean file
| Quadrant A | 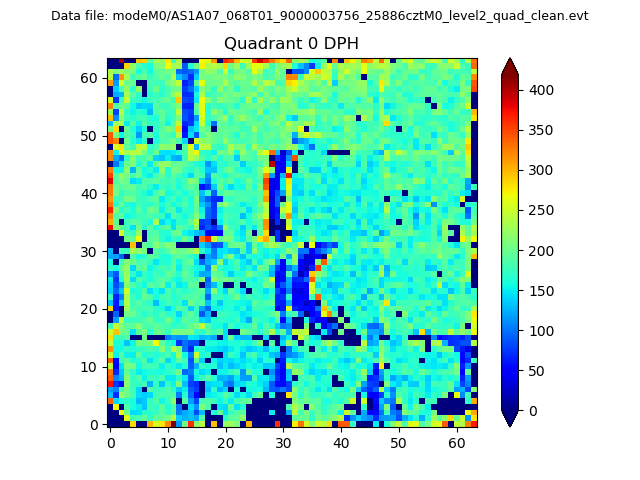 |
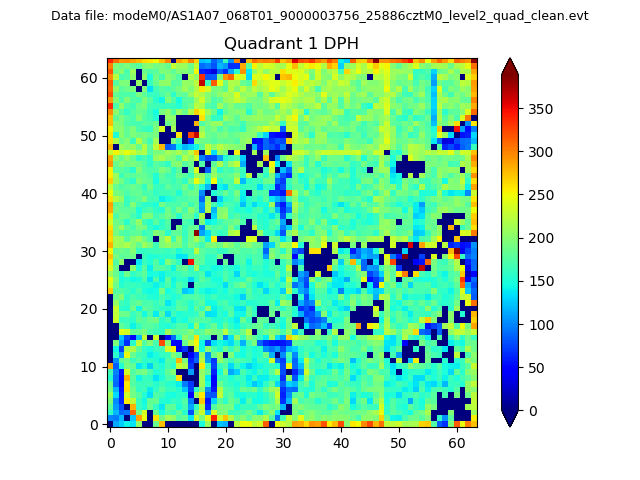 |
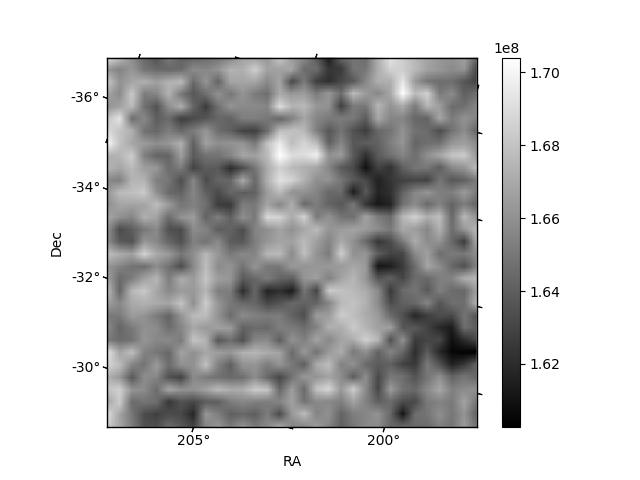
Quadrant B |
|---|---|---|---|
| Quadrant D | 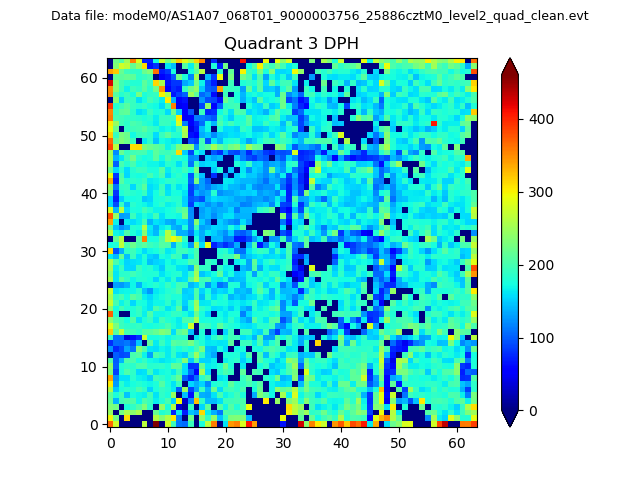 |
 |
Quadrant C |
| Plot type | Count rate plots | Images |
|---|---|---|
| Comparison with Poisson distribution Blue bars denote a histogram of data divided into 1 sec bins. Red curve is a Poisson curve with rate = median count rate of data. |
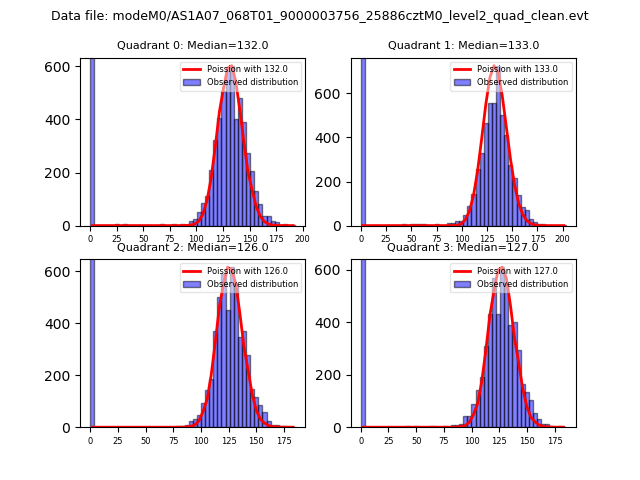 |
 |
| Quadrant-wise count rates Data is divided into 100 sec bins |
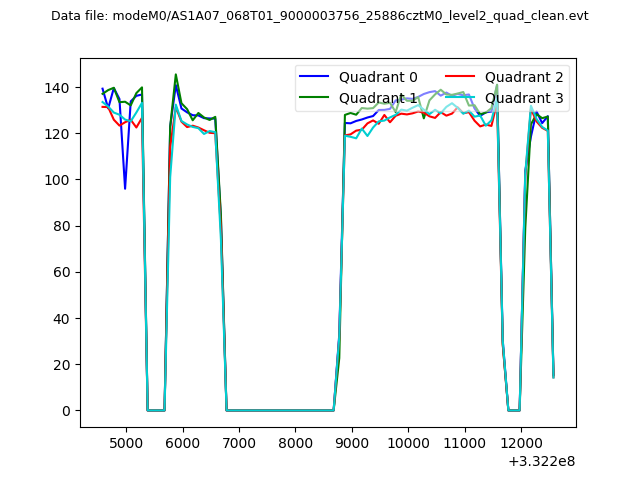 |
|
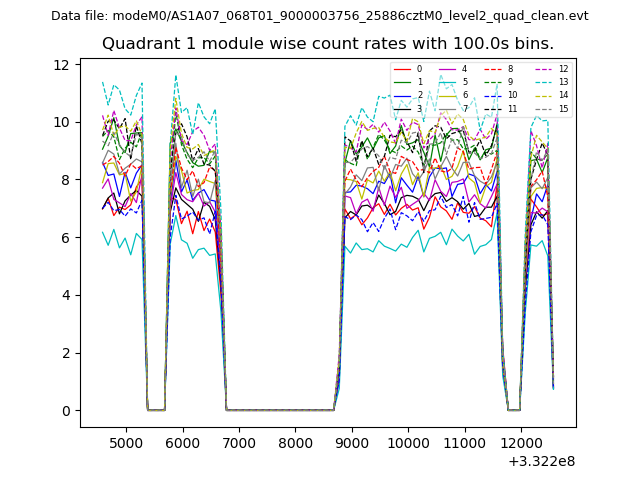
| Module-wise count rates for Quadrant A Data is divided into 100 sec bins |
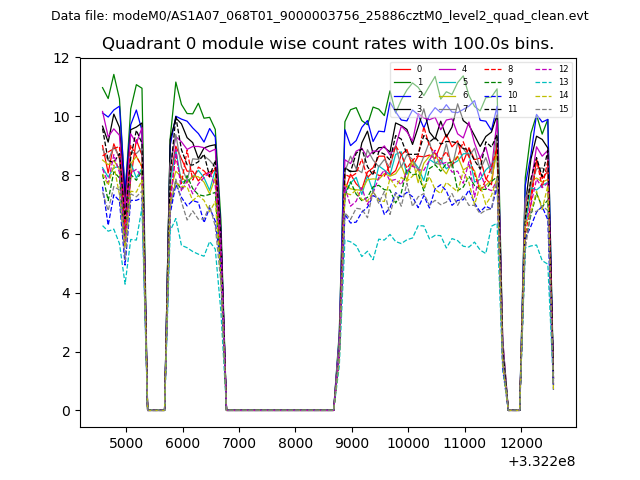 |
 |
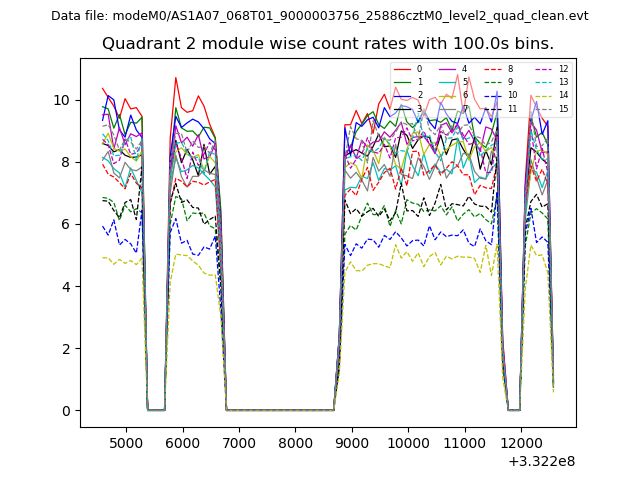
| Module-wise count rates for Quadrant B Data is divided into 100 sec bins |
 |
 |
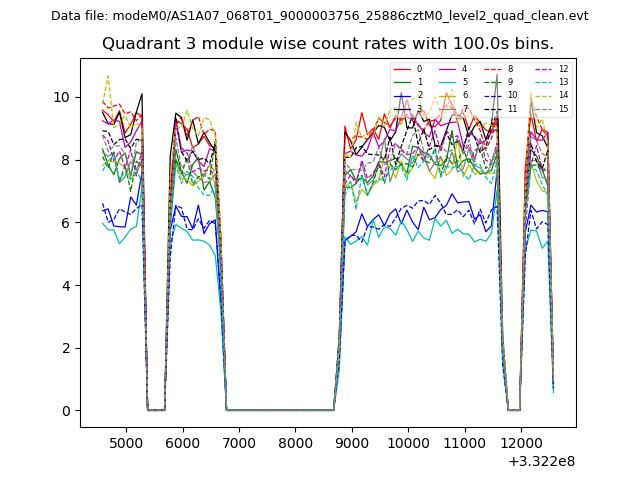
| Module-wise count rates for Quadrant C Data is divided into 100 sec bins |
 |
 |
| Module-wise count rates for Quadrant D Data is divided into 100 sec bins |
 |
 |
| Parameter | Plot |
|---|---|
| CZT HV Monitor | 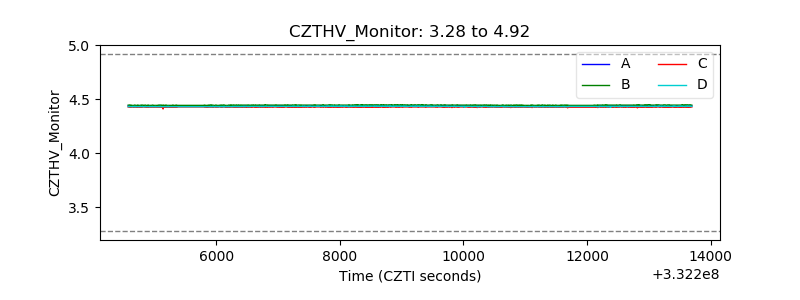 |
| D_VDD | 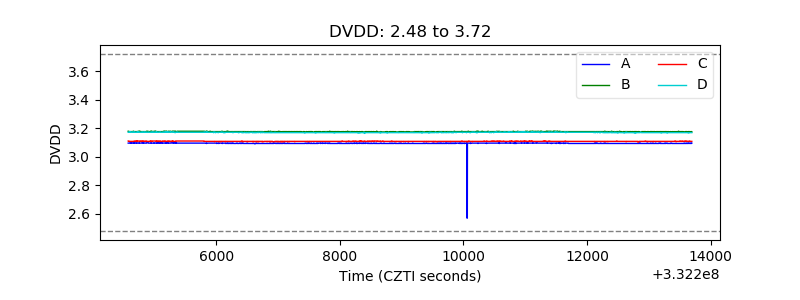 |
| Temperature 1 | 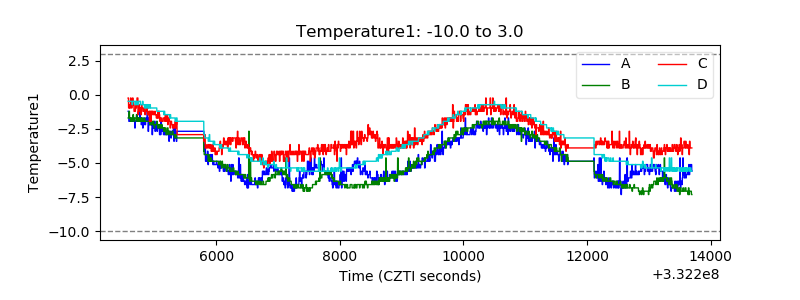 |
| Veto HV Monitor | 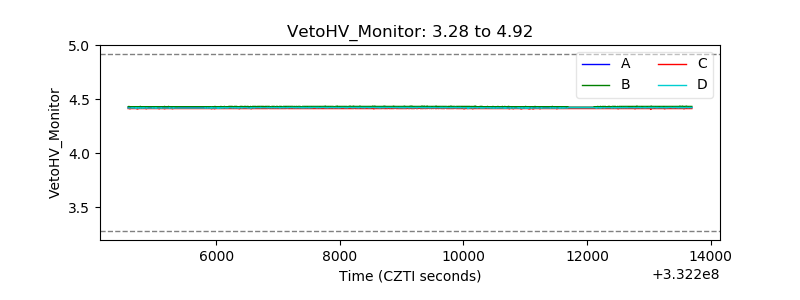 |
| Veto LLD | 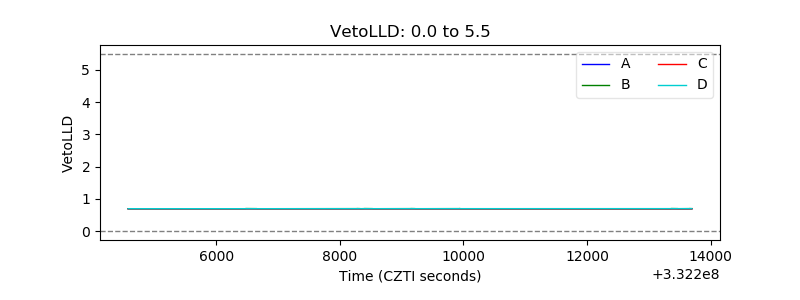 |
| Alpha Counter | 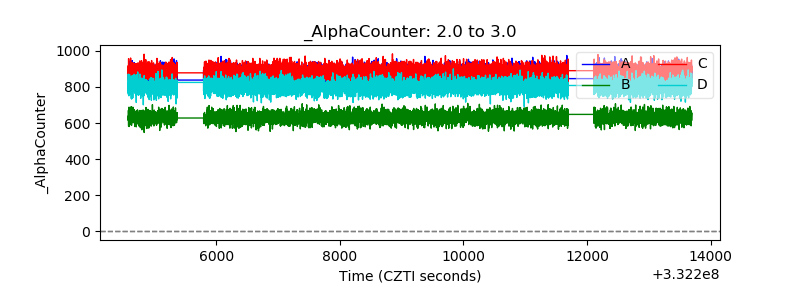 |
| _CPM_Rate | 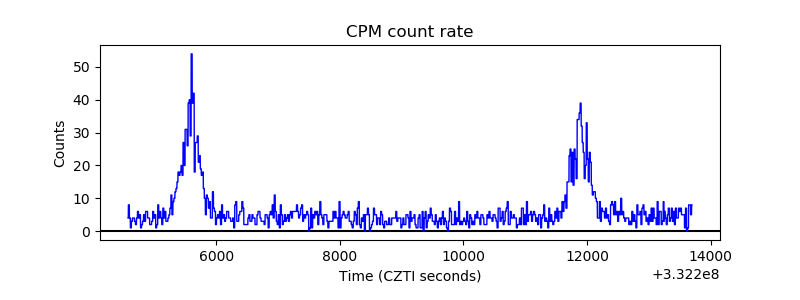 |
| CZT Counter | 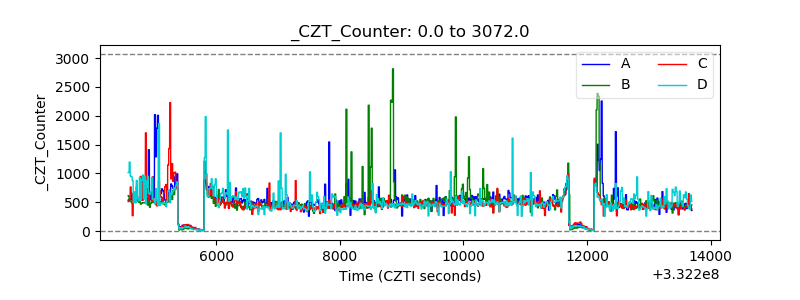 |
| +2.5 Volts monitor |  |
| +5 Volts monitor |  |
| _ROLL_ROT | 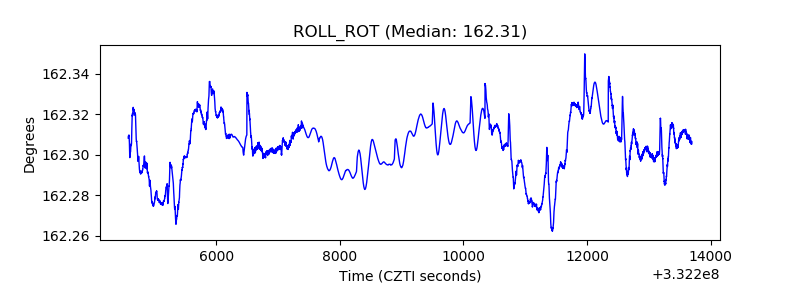 |
| _Roll_DEC | 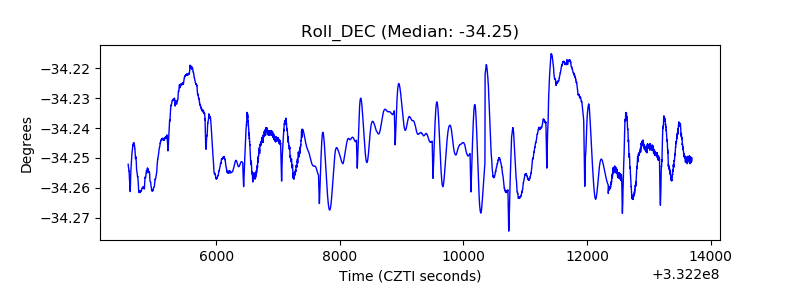 |
| _Roll_RA | 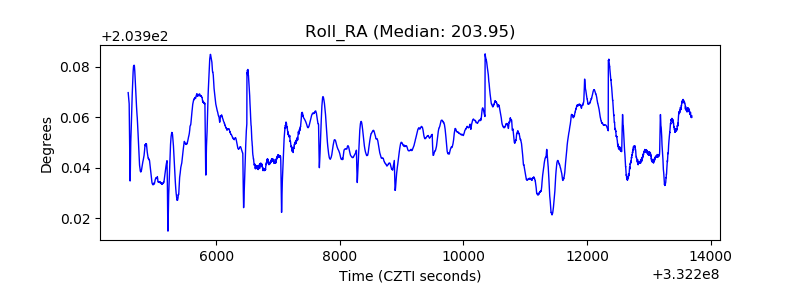 |
| Veto Counter | 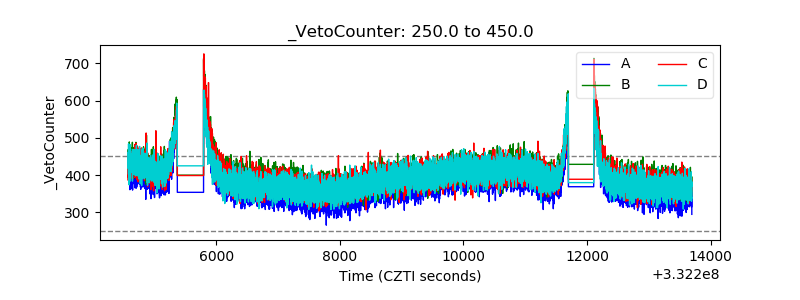 |