| Param | Original file | Final file |
|---|---|---|
| Filename | modeM0/AS1A07_068T01_9000003756_25889cztM0_level2.evt | modeM0/AS1A07_068T01_9000003756_25889cztM0_level2_quad_clean.evt |
| Size (bytes) | 1,408,806,720 | 241,557,120 |
| Size | 1.3 GB | 230.4 MB |
| Events in quadrant A | 10,373,747 | 1,529,487 |
| Events in quadrant B | 10,007,468 | 1,536,584 |
| Events in quadrant C | 9,382,536 | 1,466,591 |
| Events in quadrant D | 11,606,294 | 1,461,593 |
| Mode M0 | |||
|---|---|---|---|
| Quadrant | BADHDUFLAG | Total packets | Discarded packets |
| A | 0 | 42520 | 0 |
| B | 0 | 41798 | 0 |
| C | 0 | 39949 | 0 |
| D | 0 | 47438 | 0 |
| Mode M9 | |||
|---|---|---|---|
| Quadrant | BADHDUFLAG | Total packets | Discarded packets |
| A | 0 | 23 | 0 |
| B | 0 | 23 | 0 |
| C | 0 | 23 | 0 |
| D | 0 | 23 | 0 |
| Quadrant | Total seconds | Saturated seconds | Saturation percentage |
|---|---|---|---|
| A | 19184 | 330 | 1.720183% |
| B | 19185 | 400 | 2.084962% |
| C | 19185 | 338 | 1.761793% |
| D | 19185 | 458 | 2.387282% |
Noise dominated data is calculated using 1-second bins in cleaned event files. If a bin has >2000 counts, and if more than 50% of those come from <1% of pixels, then it is considered to be noise-dominated and hence unusable.
| Quadrant | # 1 sec bins | Bins with >0 counts | Bins with >2000 counts | High rate bins dominated by noise | Noise dominated (total time) | Noise dominated (detector-on time) | Marked lightcurve |
|---|---|---|---|---|---|---|---|
| A | 21424 | 19188 | 81 | 81 | 0.38% | 0.42% | 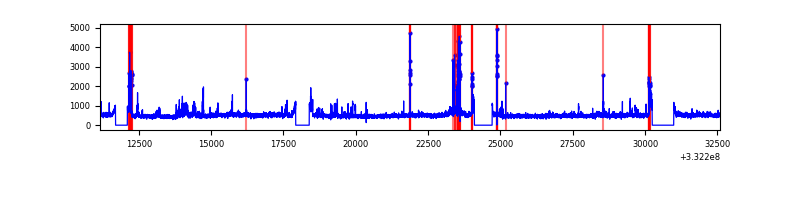 |
| B | 21425 | 19189 | 110 | 110 | 0.51% | 0.57% | 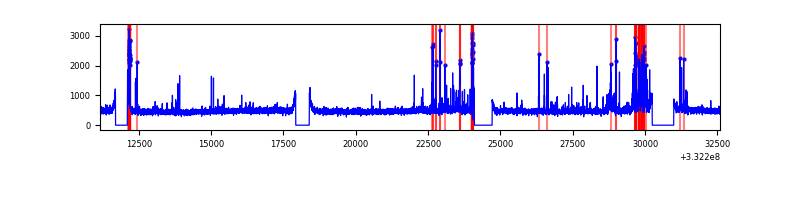 |
| C | 21425 | 19189 | 11 | 11 | 0.05% | 0.06% | 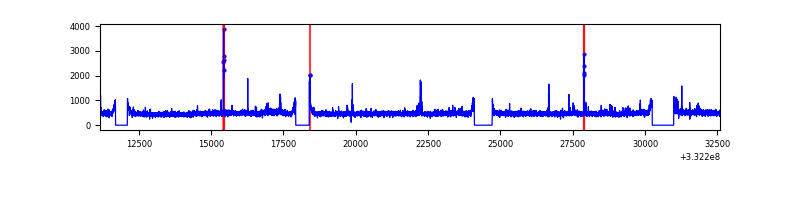 |
| D | 21425 | 19189 | 276 | 276 | 1.29% | 1.44% | 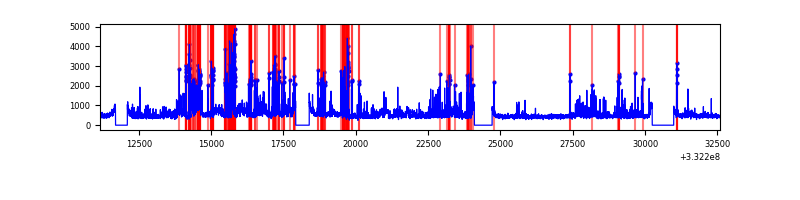 |
Top three noisy pixels from each quadrant. If the there are fewer than three noisy pixels in the level2.evt file, extra rows are filled as -1
| Pixel properties | Quadrant properties | ||||||
|---|---|---|---|---|---|---|---|
| Quadrant | DetID | PixID | Counts | Sigma | Mean | Median | Sigma |
| A | 0 | 13 | 1414906 | 3029.68 | 2325 | 2274 | 466.3 |
| A | 13 | 254 | 27896 | 54.95 | 2325 | 2274 | 466.3 |
| A | 3 | 137 | 22351 | 43.06 | 2325 | 2274 | 466.3 |
| B | 10 | 245 | 831663 | 1875.72 | 2303 | 2246 | 442.2 |
| B | 12 | 111 | 55989 | 121.54 | 2303 | 2246 | 442.2 |
| B | 11 | 111 | 50183 | 108.41 | 2303 | 2246 | 442.2 |
| C | 3 | 233 | 369574 | 698.75 | 2220 | 2229 | 525.7 |
| C | 14 | 238 | 356222 | 673.35 | 2220 | 2229 | 525.7 |
| C | 13 | 61 | 15184 | 24.64 | 2220 | 2229 | 525.7 |
| D | 1 | 52 | 2802857 | 5252.92 | 2240 | 2182 | 533.2 |
| D | 5 | 223 | 189782 | 351.86 | 2240 | 2182 | 533.2 |
| D | 7 | 80 | 91754 | 168.0 | 2240 | 2182 | 533.2 |
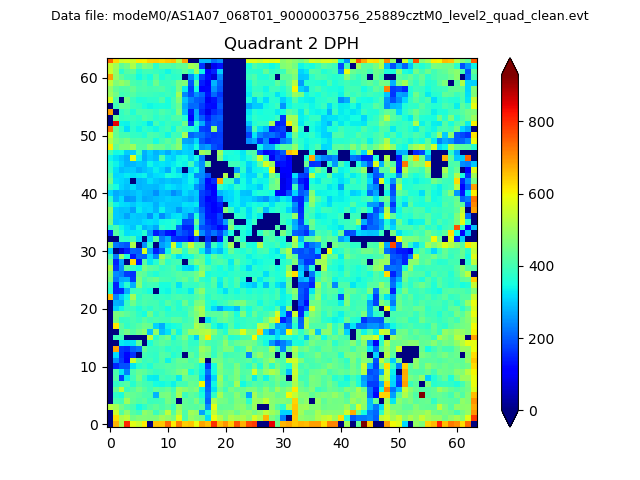
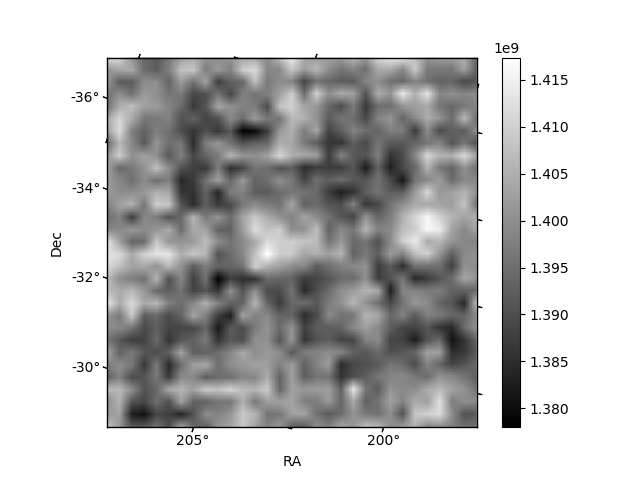
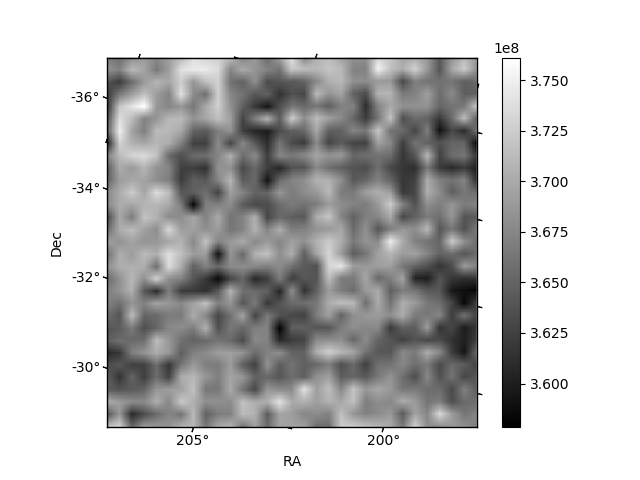
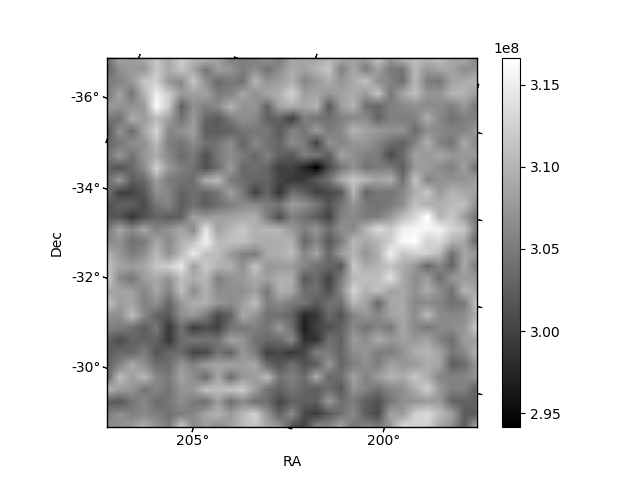
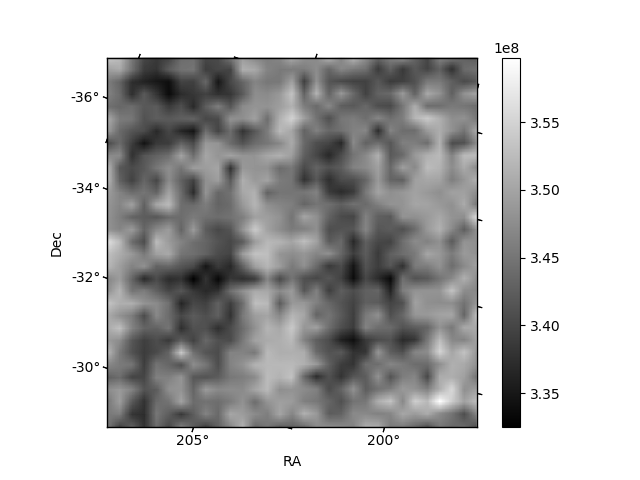
Histogram calculated using DETX and DETY for each event in the final _common_clean file
| Quadrant A | 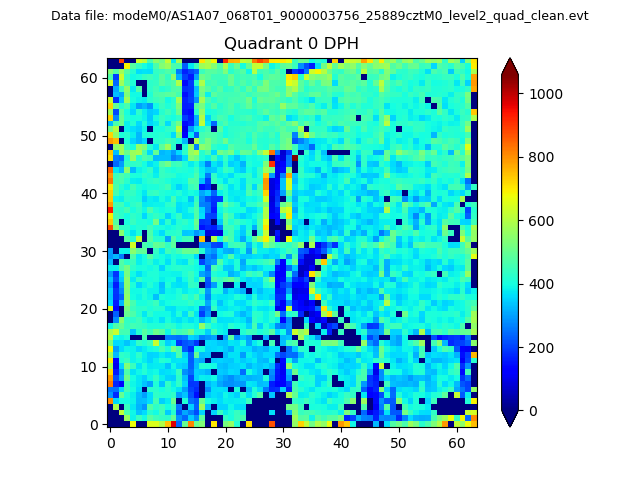 |
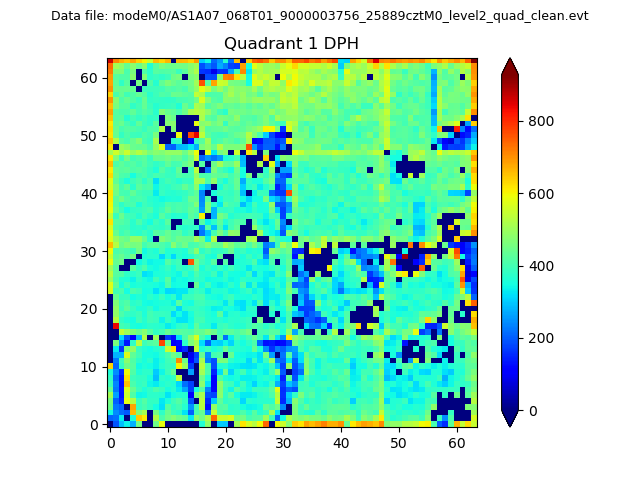 |
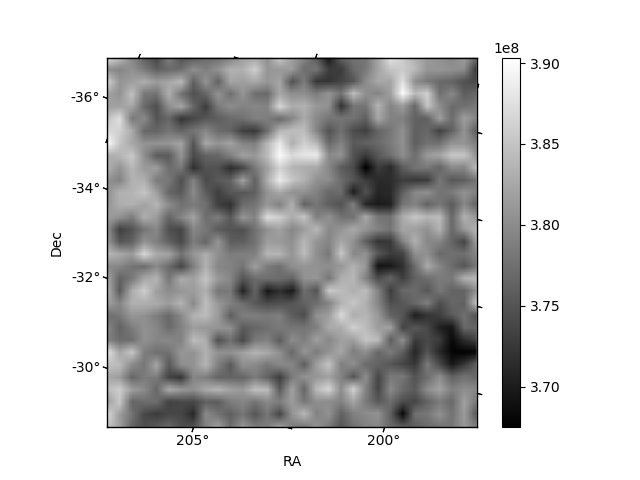
Quadrant B |
|---|---|---|---|
| Quadrant D | 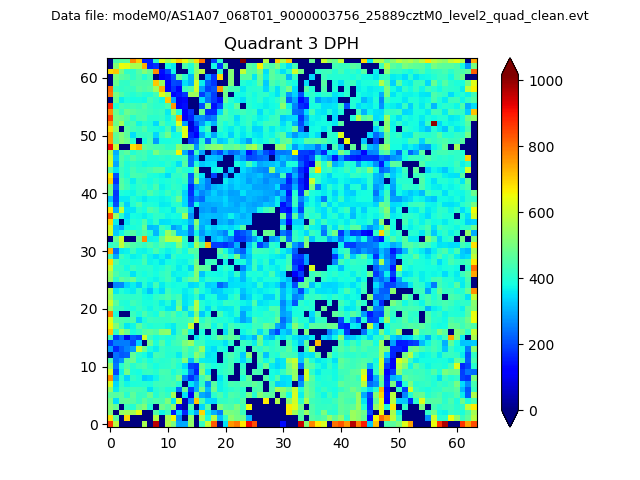 |
 |
Quadrant C |
| Plot type | Count rate plots | Images |
|---|---|---|
| Comparison with Poisson distribution Blue bars denote a histogram of data divided into 1 sec bins. Red curve is a Poisson curve with rate = median count rate of data. |
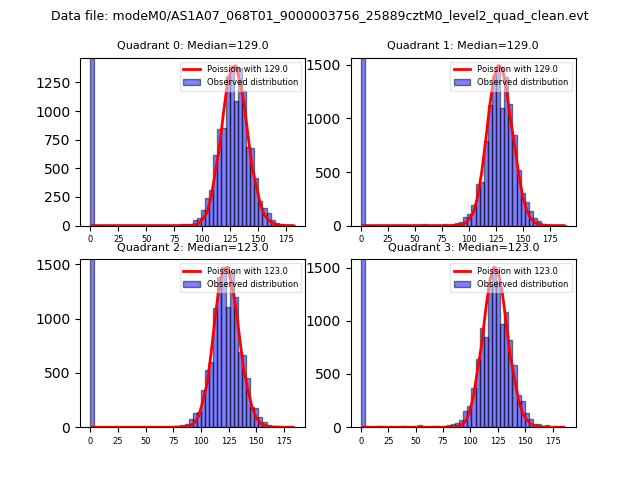 |
 |
| Quadrant-wise count rates Data is divided into 100 sec bins |
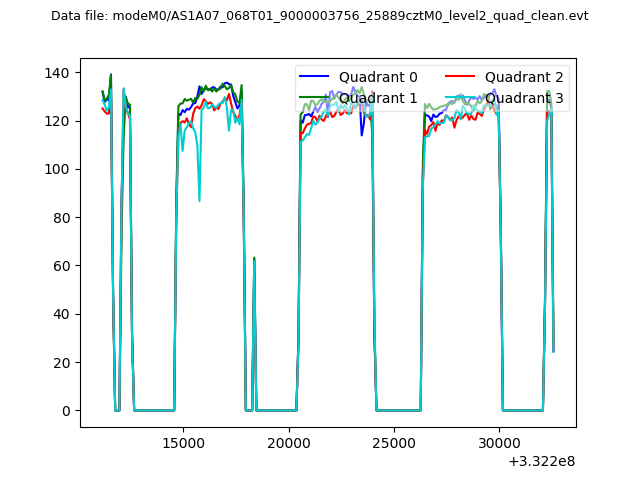 |
|
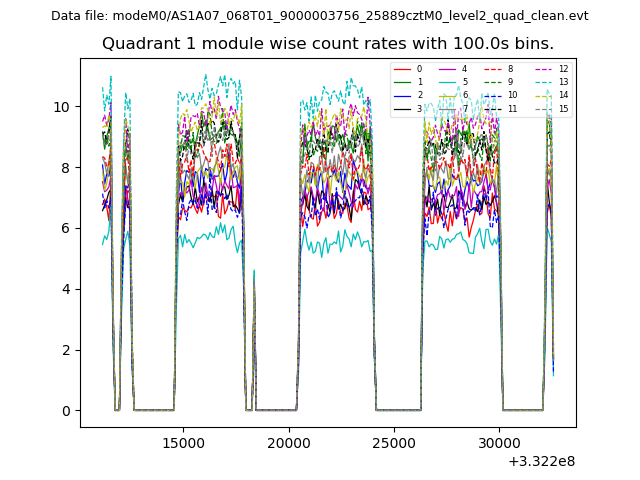
| Module-wise count rates for Quadrant A Data is divided into 100 sec bins |
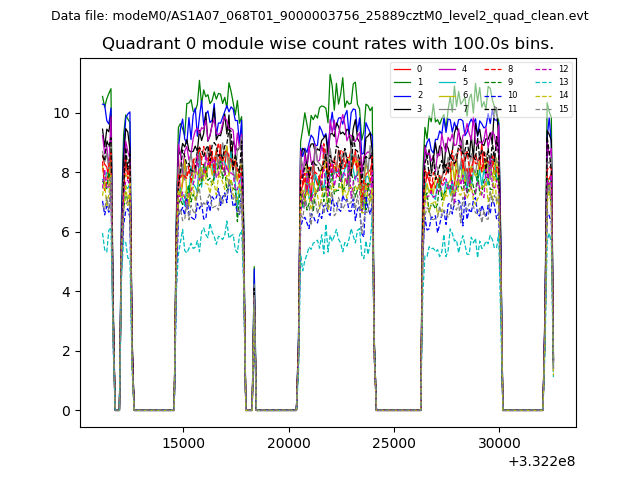 |
 |
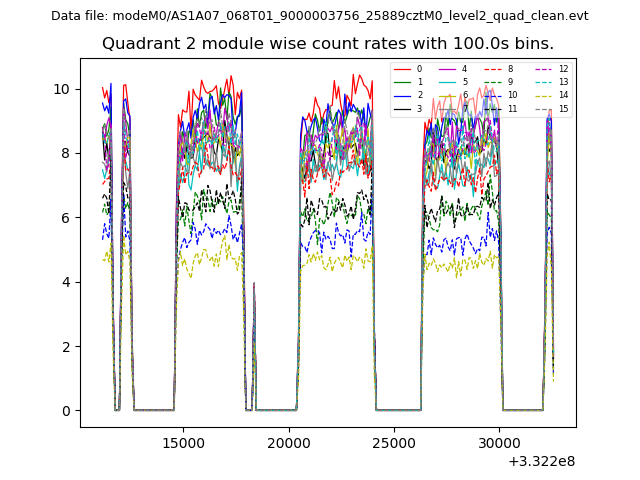
| Module-wise count rates for Quadrant B Data is divided into 100 sec bins |
 |
 |
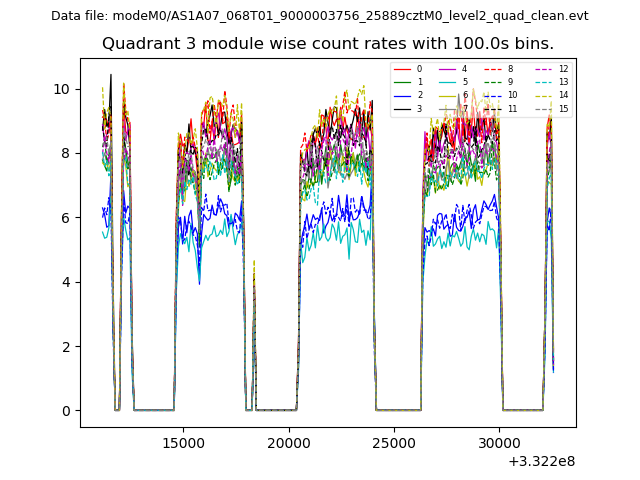
| Module-wise count rates for Quadrant C Data is divided into 100 sec bins |
 |
 |
| Module-wise count rates for Quadrant D Data is divided into 100 sec bins |
 |
 |
| Parameter | Plot |
|---|---|
| CZT HV Monitor | 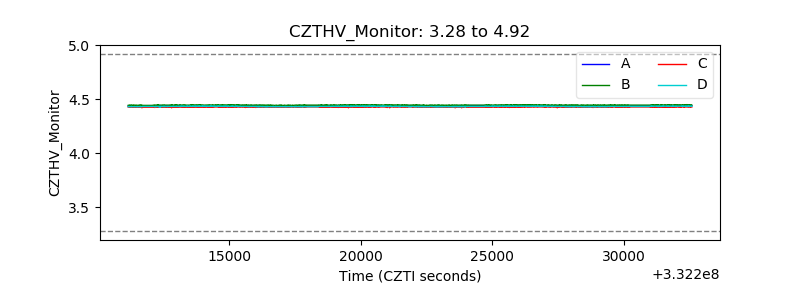 |
| D_VDD | 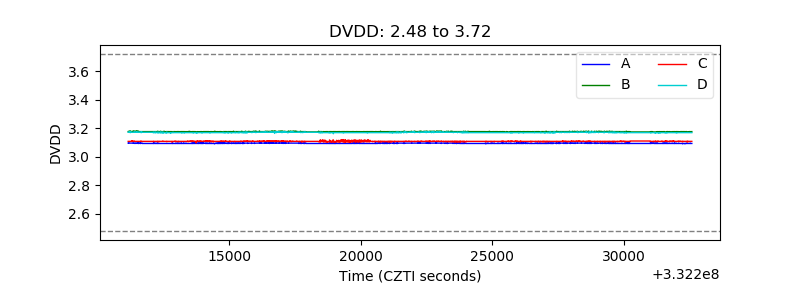 |
| Temperature 1 | 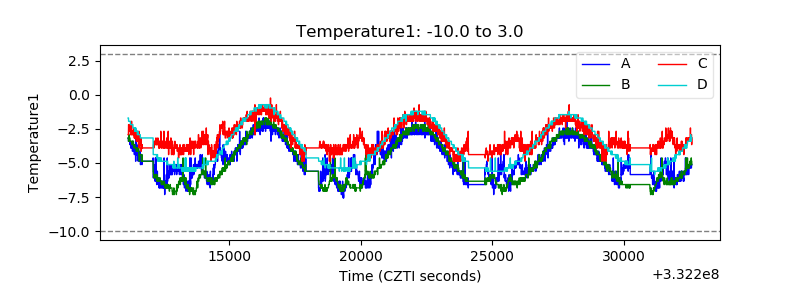 |
| Veto HV Monitor | 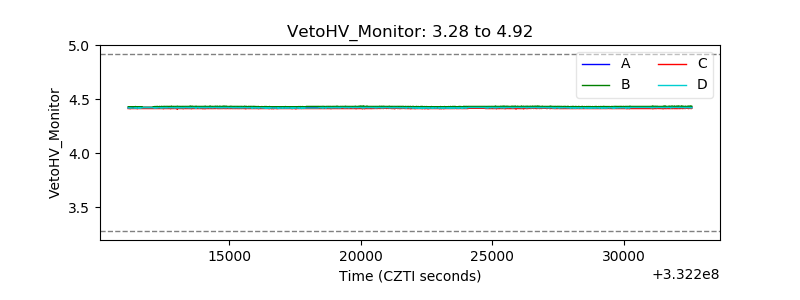 |
| Veto LLD | 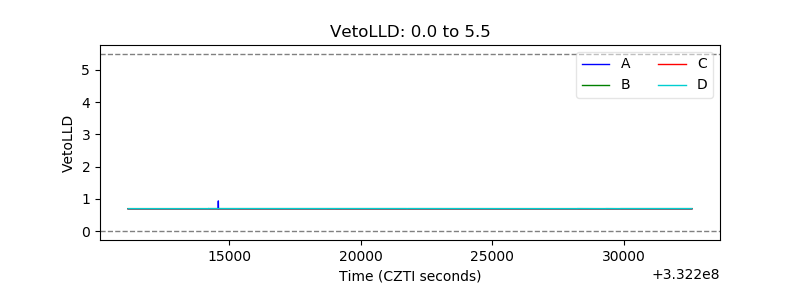 |
| Alpha Counter | 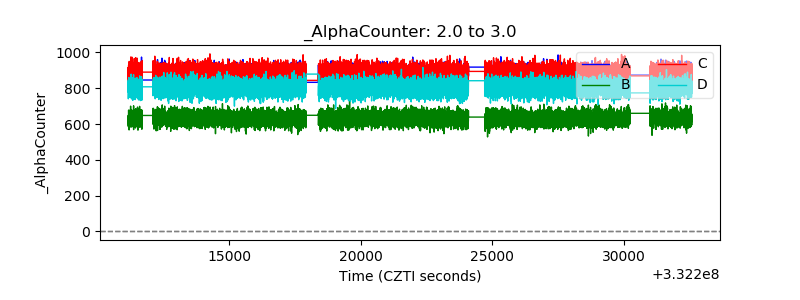 |
| _CPM_Rate | 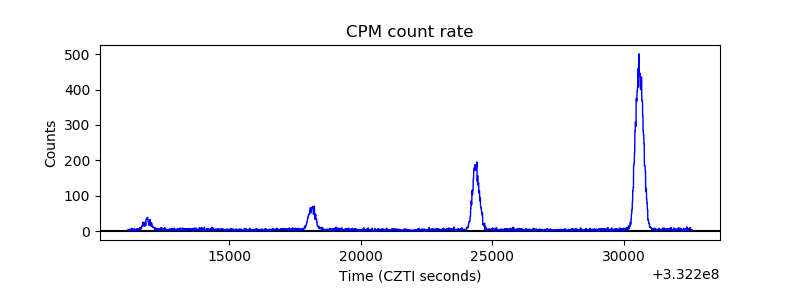 |
| CZT Counter | 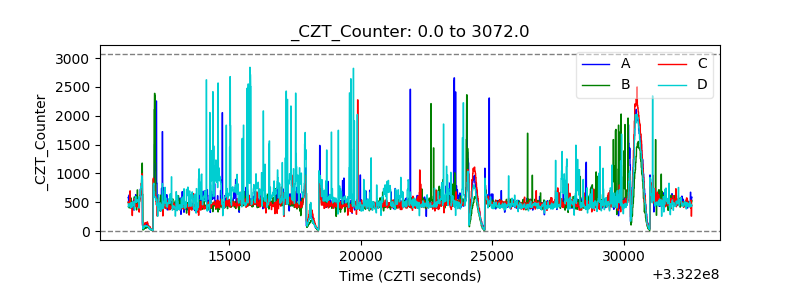 |
| +2.5 Volts monitor | 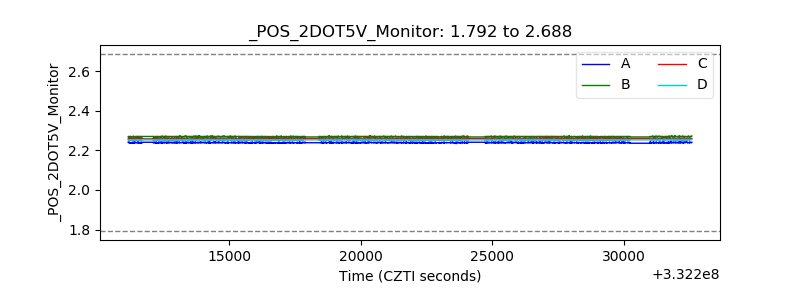 |
| +5 Volts monitor | 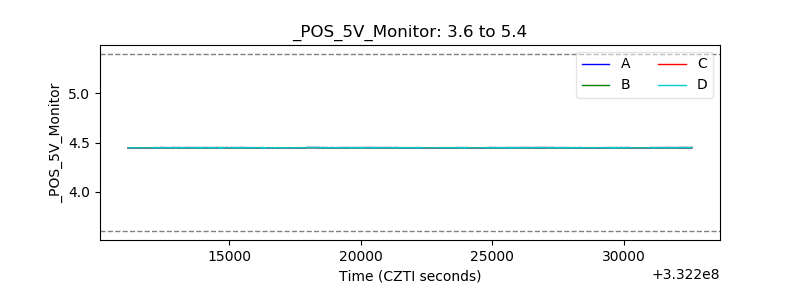 |
| _ROLL_ROT | 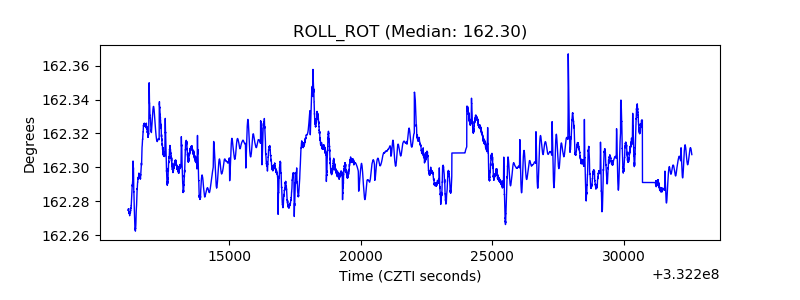 |
| _Roll_DEC |  |
| _Roll_RA | 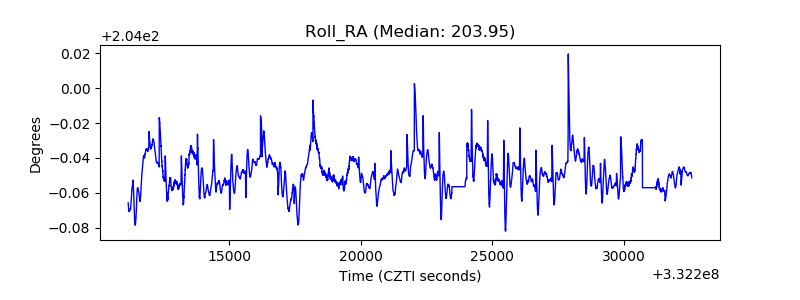 |
| Veto Counter | 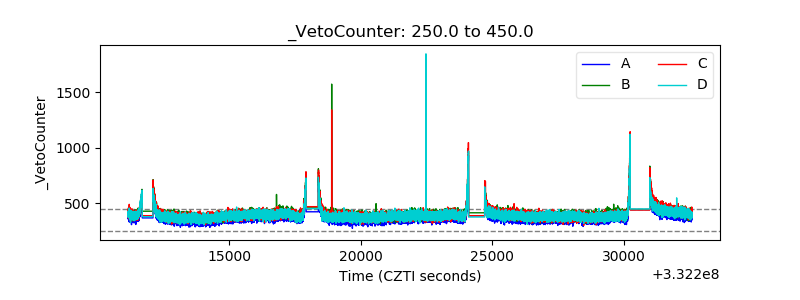 |