| Param | Original file | Final file |
|---|---|---|
| Filename | modeM0/AS1A07_068T01_9000003756_25890cztM0_level2.evt | modeM0/AS1A07_068T01_9000003756_25890cztM0_level2_quad_clean.evt |
| Size (bytes) | 474,209,280 | 88,876,800 |
| Size | 452.2 MB | 84.8 MB |
| Events in quadrant A | 3,677,676 | 567,392 |
| Events in quadrant B | 3,260,303 | 573,985 |
| Events in quadrant C | 3,309,139 | 544,664 |
| Events in quadrant D | 3,665,257 | 544,455 |
| Mode M0 | |||
|---|---|---|---|
| Quadrant | BADHDUFLAG | Total packets | Discarded packets |
| A | 0 | 14955 | 0 |
| B | 0 | 13733 | 0 |
| C | 0 | 13948 | 0 |
| D | 0 | 15084 | 0 |
| Mode M9 | |||
|---|---|---|---|
| Quadrant | BADHDUFLAG | Total packets | Discarded packets |
| A | 0 | 9 | 0 |
| B | 0 | 9 | 0 |
| C | 0 | 9 | 0 |
| D | 0 | 9 | 0 |
| Quadrant | Total seconds | Saturated seconds | Saturation percentage |
|---|---|---|---|
| A | 6612 | 74 | 1.119177% |
| B | 6612 | 81 | 1.225045% |
| C | 6613 | 118 | 1.784364% |
| D | 6613 | 96 | 1.451686% |
Noise dominated data is calculated using 1-second bins in cleaned event files. If a bin has >2000 counts, and if more than 50% of those come from <1% of pixels, then it is considered to be noise-dominated and hence unusable.
| Quadrant | # 1 sec bins | Bins with >0 counts | Bins with >2000 counts | High rate bins dominated by noise | Noise dominated (total time) | Noise dominated (detector-on time) | Marked lightcurve |
|---|---|---|---|---|---|---|---|
| A | 7512 | 6613 | 4 | 4 | 0.05% | 0.06% | 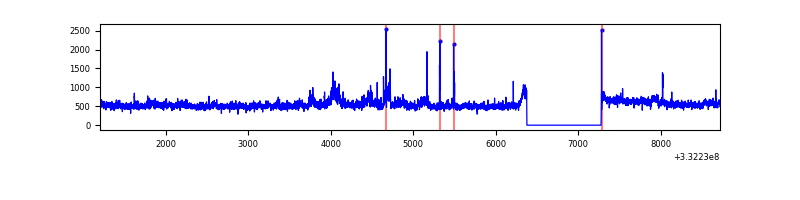 |
| B | 7512 | 6613 | 3 | 3 | 0.04% | 0.05% | 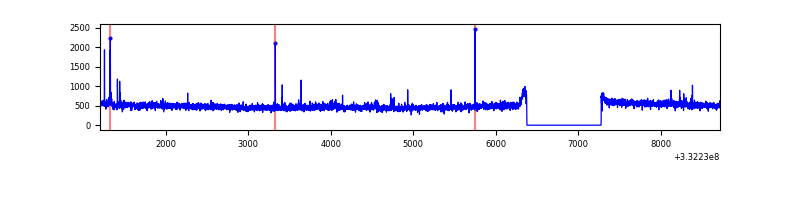 |
| C | 7513 | 6614 | 0 | 0 | 0.00% | 0.00% | 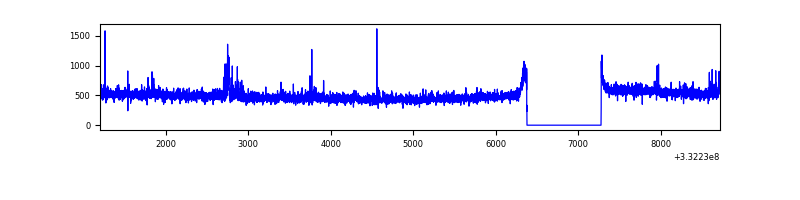 |
| D | 7513 | 6614 | 38 | 38 | 0.51% | 0.57% | 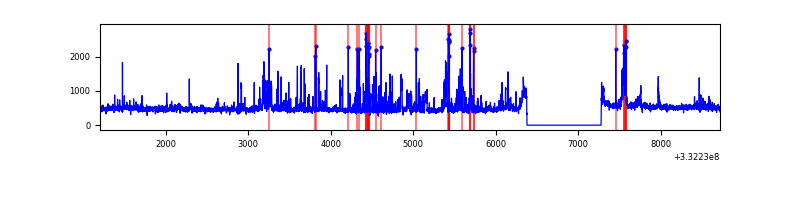 |
Top three noisy pixels from each quadrant. If the there are fewer than three noisy pixels in the level2.evt file, extra rows are filled as -1
| Pixel properties | Quadrant properties | ||||||
|---|---|---|---|---|---|---|---|
| Quadrant | DetID | PixID | Counts | Sigma | Mean | Median | Sigma |
| A | 0 | 13 | 483168 | 2886.78 | 827 | 810 | 167.1 |
| A | 13 | 254 | 9081 | 49.5 | 827 | 810 | 167.1 |
| A | 3 | 137 | 7776 | 41.69 | 827 | 810 | 167.1 |
| B | 10 | 245 | 29508 | 182.51 | 817 | 795 | 157.3 |
| B | 12 | 111 | 19239 | 117.24 | 817 | 795 | 157.3 |
| B | 11 | 111 | 17900 | 108.73 | 817 | 795 | 157.3 |
| C | 14 | 238 | 127074 | 679.32 | 789 | 793 | 185.9 |
| C | 3 | 233 | 103430 | 552.13 | 789 | 793 | 185.9 |
| C | 13 | 61 | 5399 | 24.78 | 789 | 793 | 185.9 |
| D | 1 | 52 | 512442 | 2679.35 | 800 | 781 | 191.0 |
| D | 7 | 80 | 109557 | 569.61 | 800 | 781 | 191.0 |
| D | 2 | 234 | 26101 | 132.59 | 800 | 781 | 191.0 |
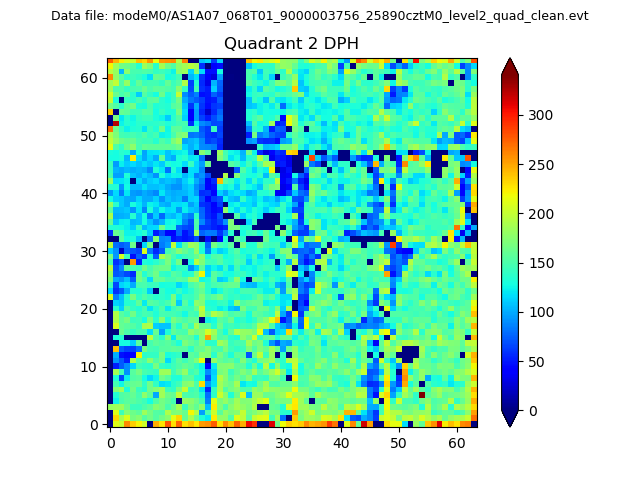
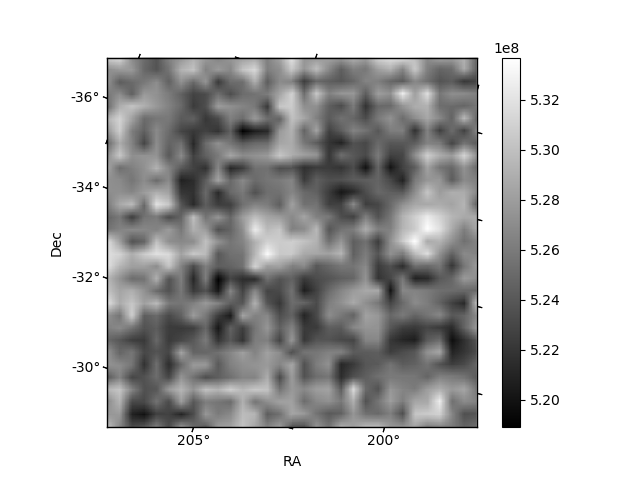
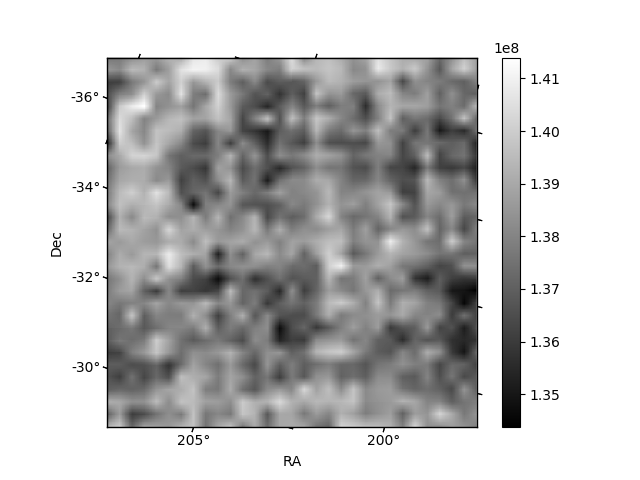
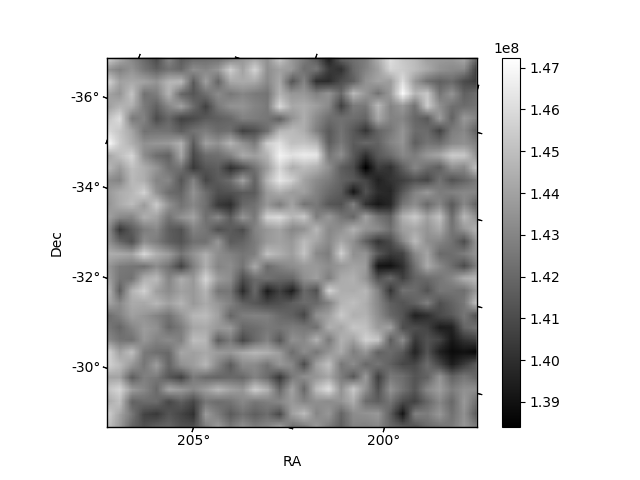
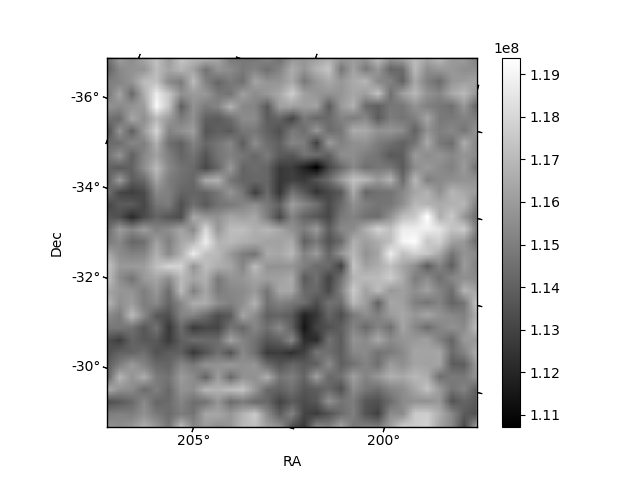
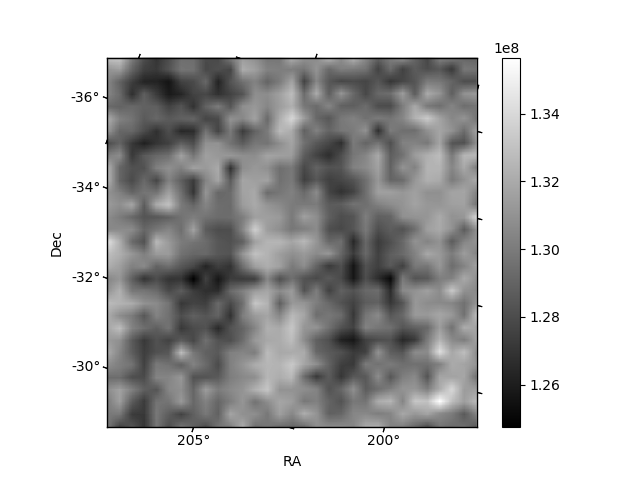
Histogram calculated using DETX and DETY for each event in the final _common_clean file
| Quadrant A | 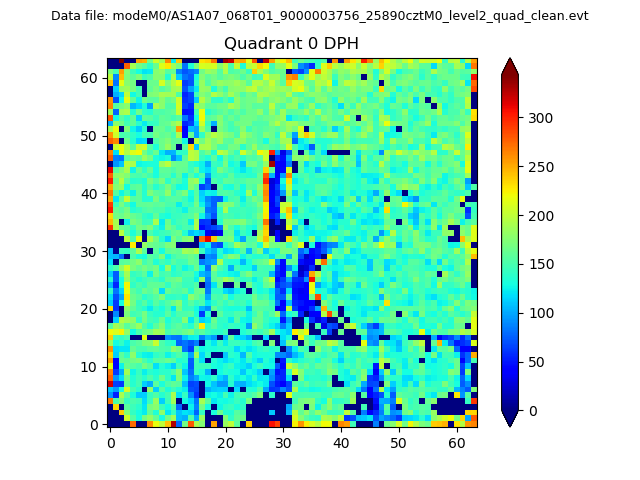 |
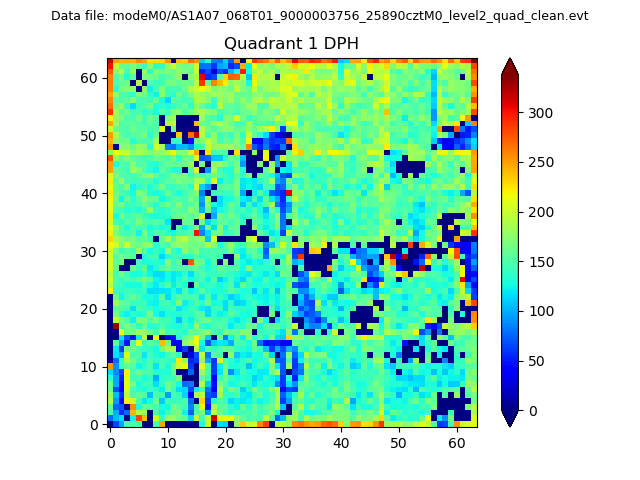 |
Quadrant B |
|---|---|---|---|
| Quadrant D | 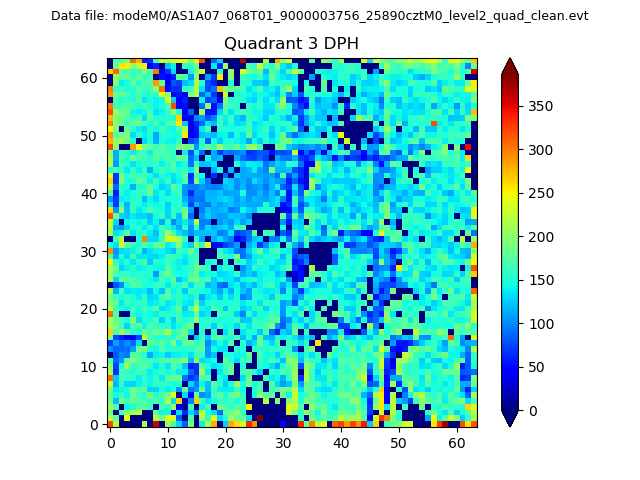 |
 |
Quadrant C |
| Plot type | Count rate plots | Images |
|---|---|---|
| Comparison with Poisson distribution Blue bars denote a histogram of data divided into 1 sec bins. Red curve is a Poisson curve with rate = median count rate of data. |
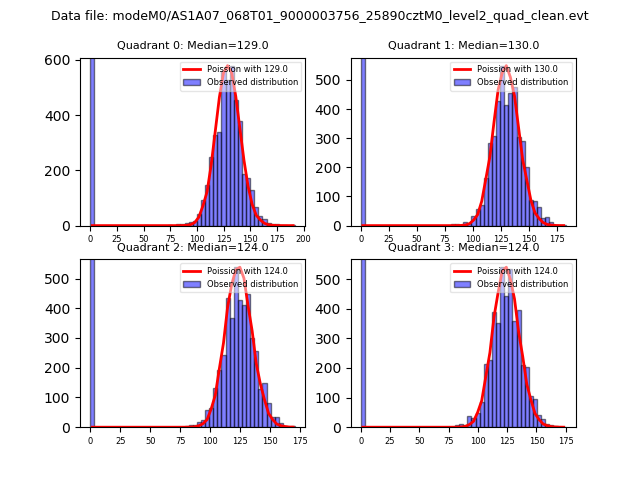 |
 |
| Quadrant-wise count rates Data is divided into 100 sec bins |
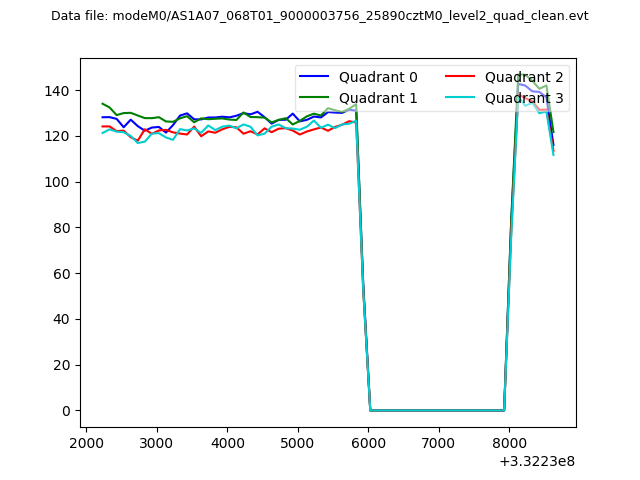 |
|
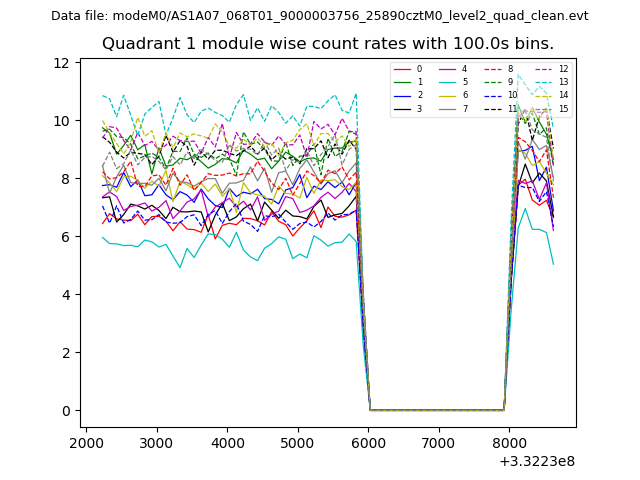
| Module-wise count rates for Quadrant A Data is divided into 100 sec bins |
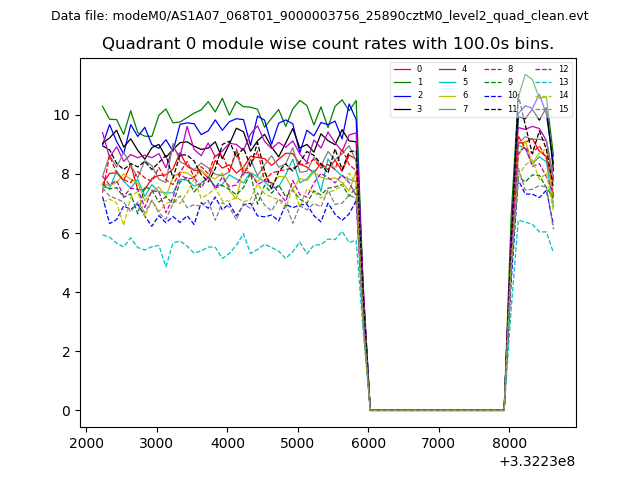 |
 |
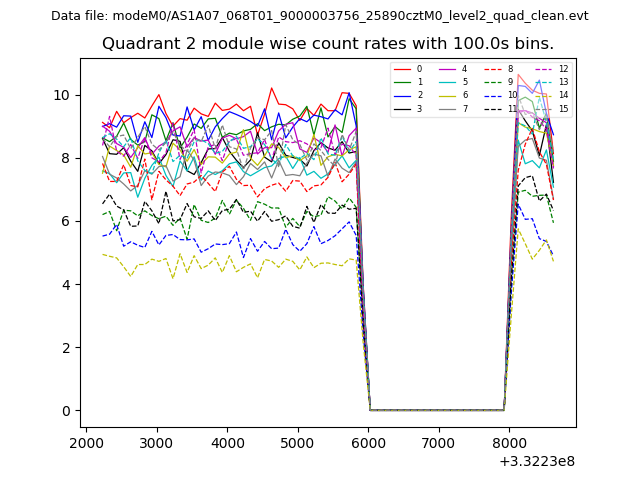
| Module-wise count rates for Quadrant B Data is divided into 100 sec bins |
 |
 |
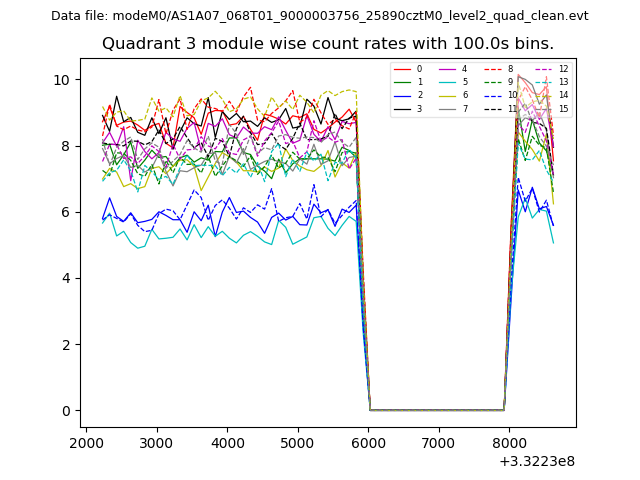
| Module-wise count rates for Quadrant C Data is divided into 100 sec bins |
 |
 |
| Module-wise count rates for Quadrant D Data is divided into 100 sec bins |
 |
 |
| Parameter | Plot |
|---|---|
| CZT HV Monitor | 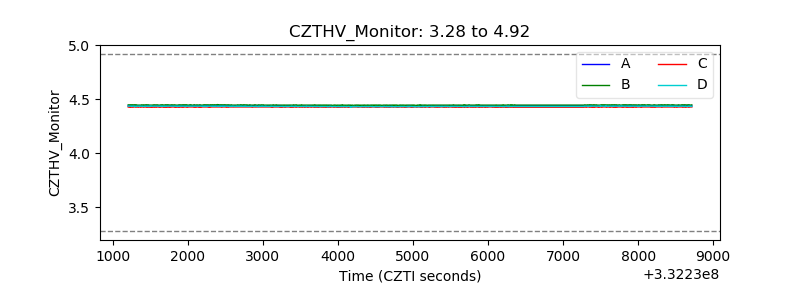 |
| D_VDD | 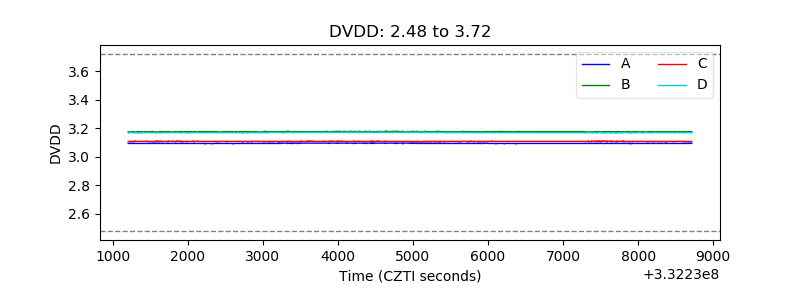 |
| Temperature 1 | 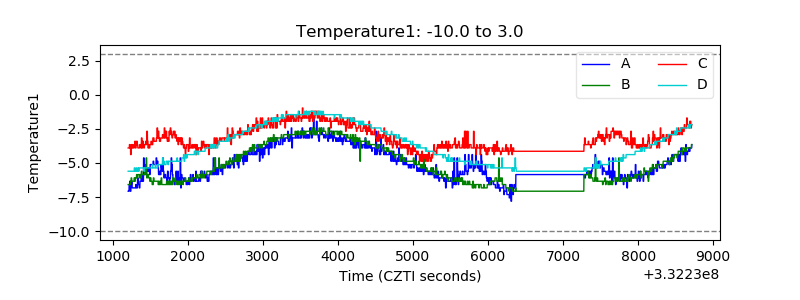 |
| Veto HV Monitor | 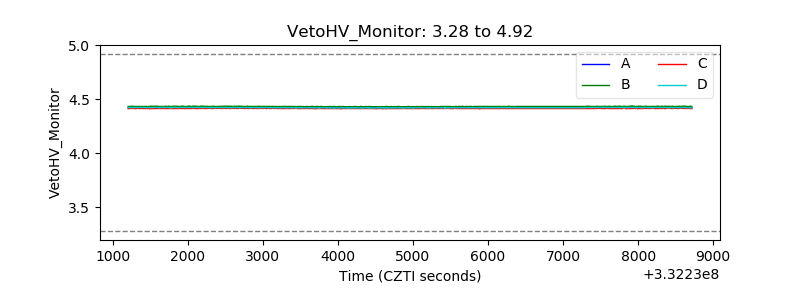 |
| Veto LLD | 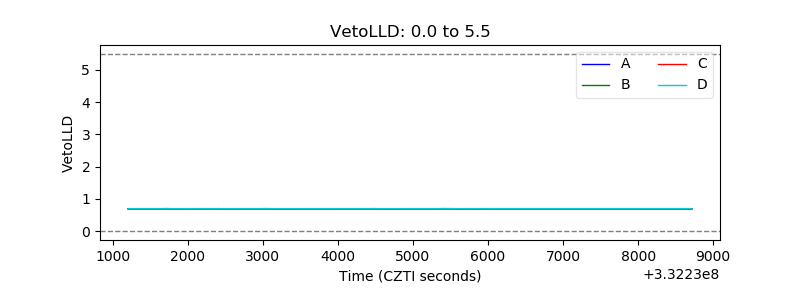 |
| Alpha Counter | 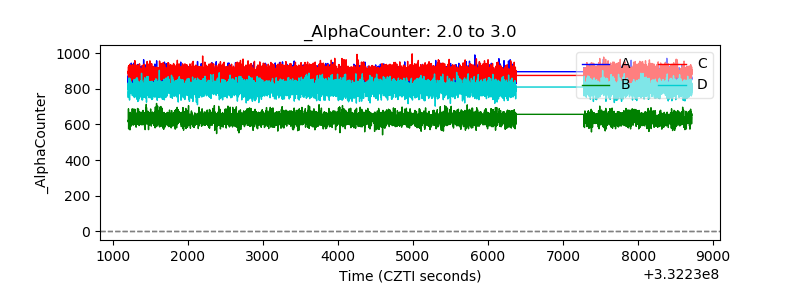 |
| _CPM_Rate | 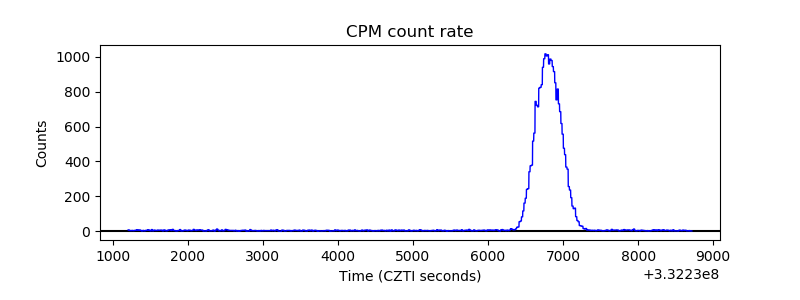 |
| CZT Counter | 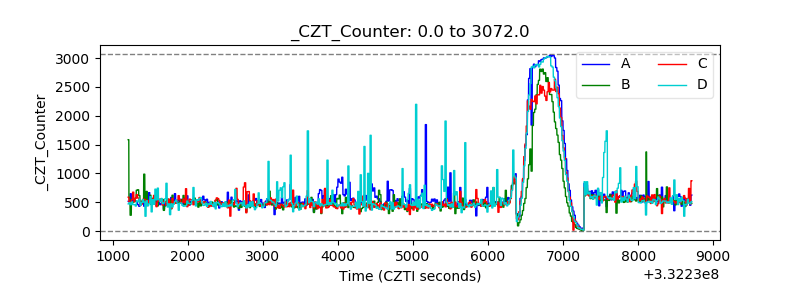 |
| +2.5 Volts monitor |  |
| +5 Volts monitor |  |
| _ROLL_ROT | 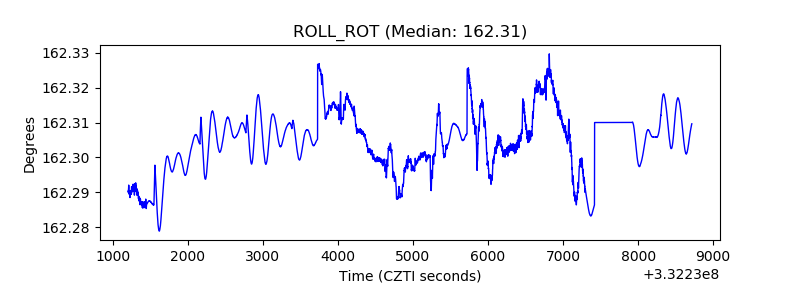 |
| _Roll_DEC | 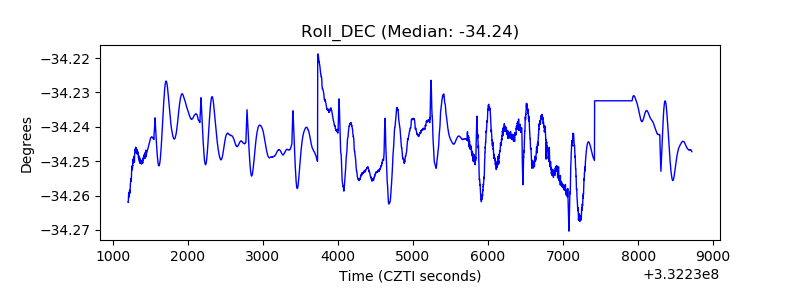 |
| _Roll_RA | 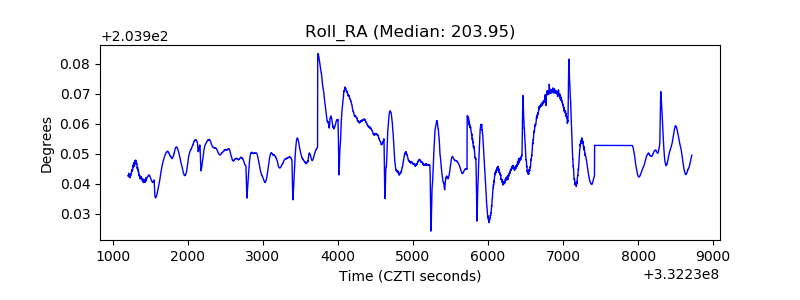 |
| Veto Counter | 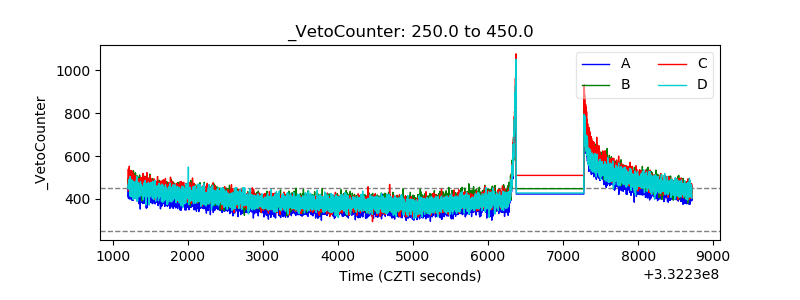 |