| Param | Original file | Final file |
|---|---|---|
| Filename | modeM0/AS1A07_068T01_9000003756_25892cztM0_level2.evt | modeM0/AS1A07_068T01_9000003756_25892cztM0_level2_quad_clean.evt |
| Size (bytes) | 532,609,920 | 96,485,760 |
| Size | 507.9 MB | 92.0 MB |
| Events in quadrant A | 3,394,660 | 658,059 |
| Events in quadrant B | 3,298,631 | 659,475 |
| Events in quadrant C | 3,035,377 | 628,557 |
| Events in quadrant D | 5,997,317 | 559,172 |
| Mode M0 | |||
|---|---|---|---|
| Quadrant | BADHDUFLAG | Total packets | Discarded packets |
| A | 0 | 13774 | 0 |
| B | 0 | 13567 | 0 |
| C | 0 | 12863 | 0 |
| D | 0 | 21590 | 0 |
| Mode M9 | |||
|---|---|---|---|
| Quadrant | BADHDUFLAG | Total packets | Discarded packets |
| A | 0 | 10 | 0 |
| B | 0 | 10 | 0 |
| C | 0 | 10 | 0 |
| D | 0 | 10 | 0 |
| Quadrant | Total seconds | Saturated seconds | Saturation percentage |
|---|---|---|---|
| A | 5957 | 81 | 1.359745% |
| B | 5957 | 72 | 1.208662% |
| C | 5957 | 102 | 1.712271% |
| D | 5957 | 1090 | 18.297801% |
Noise dominated data is calculated using 1-second bins in cleaned event files. If a bin has >2000 counts, and if more than 50% of those come from <1% of pixels, then it is considered to be noise-dominated and hence unusable.
| Quadrant | # 1 sec bins | Bins with >0 counts | Bins with >2000 counts | High rate bins dominated by noise | Noise dominated (total time) | Noise dominated (detector-on time) | Marked lightcurve |
|---|---|---|---|---|---|---|---|
| A | 7012 | 5958 | 4 | 4 | 0.06% | 0.07% | 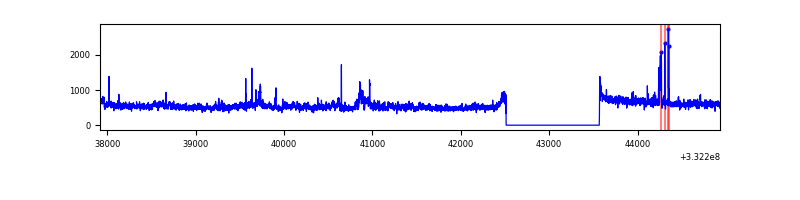 |
| B | 7012 | 5958 | 5 | 5 | 0.07% | 0.08% | 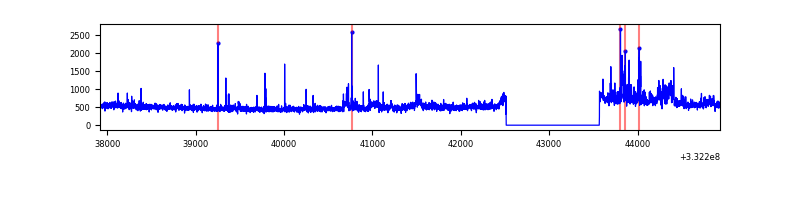 |
| C | 7012 | 5958 | 0 | 0 | 0.00% | 0.00% | 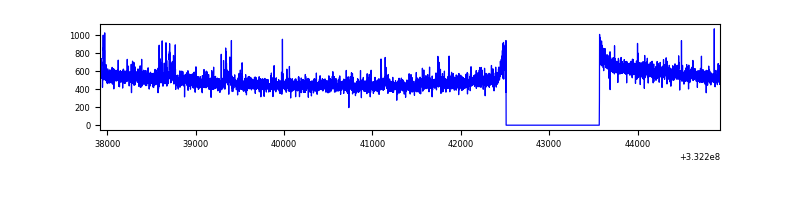 |
| D | 7012 | 5958 | 887 | 887 | 12.65% | 14.89% | 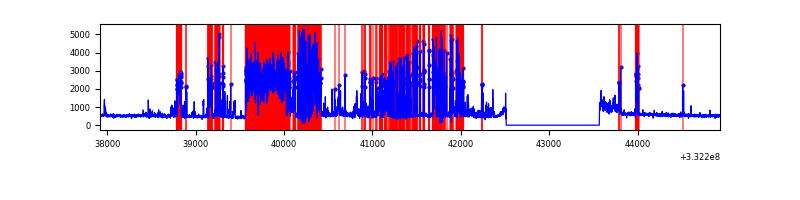 |
Top three noisy pixels from each quadrant. If the there are fewer than three noisy pixels in the level2.evt file, extra rows are filled as -1
| Pixel properties | Quadrant properties | ||||||
|---|---|---|---|---|---|---|---|
| Quadrant | DetID | PixID | Counts | Sigma | Mean | Median | Sigma |
| A | 0 | 13 | 429425 | 2778.97 | 767 | 750 | 154.3 |
| A | 13 | 254 | 8898 | 52.82 | 767 | 750 | 154.3 |
| A | 3 | 137 | 6977 | 40.37 | 767 | 750 | 154.3 |
| B | 10 | 245 | 191262 | 1322.01 | 753 | 736 | 144.1 |
| B | 0 | 219 | 140897 | 972.54 | 753 | 736 | 144.1 |
| B | 12 | 111 | 17554 | 116.7 | 753 | 736 | 144.1 |
| C | 14 | 238 | 116719 | 679.34 | 728 | 732 | 170.7 |
| C | 3 | 233 | 82582 | 479.4 | 728 | 732 | 170.7 |
| C | 13 | 61 | 4827 | 23.98 | 728 | 732 | 170.7 |
| D | 7 | 80 | 3040507 | 18591.29 | 687 | 670 | 163.5 |
| D | 1 | 52 | 336768 | 2055.53 | 687 | 670 | 163.5 |
| D | 2 | 234 | 21934 | 130.05 | 687 | 670 | 163.5 |
Histogram calculated using DETX and DETY for each event in the final _common_clean file
| Quadrant A |  |
 |
Quadrant B |
|---|---|---|---|
| Quadrant D |  |
 |
Quadrant C |
| Plot type | Count rate plots | Images |
|---|---|---|
| Comparison with Poisson distribution Blue bars denote a histogram of data divided into 1 sec bins. Red curve is a Poisson curve with rate = median count rate of data. |
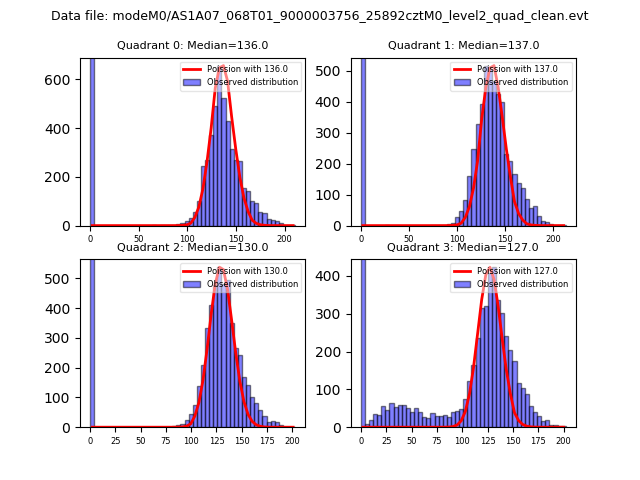 |
 |
| Quadrant-wise count rates Data is divided into 100 sec bins |
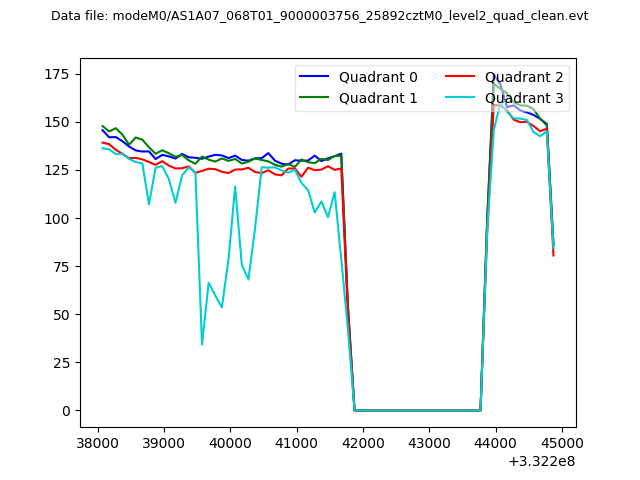 |
|
| Module-wise count rates for Quadrant A Data is divided into 100 sec bins |
 |
 |
| Module-wise count rates for Quadrant B Data is divided into 100 sec bins |
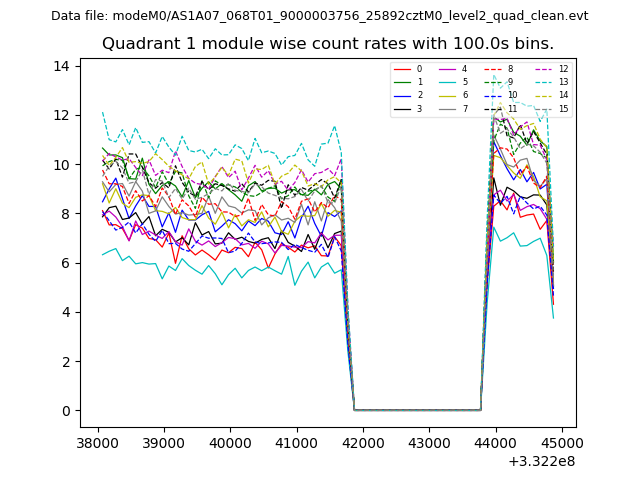 |
 |
| Module-wise count rates for Quadrant C Data is divided into 100 sec bins |
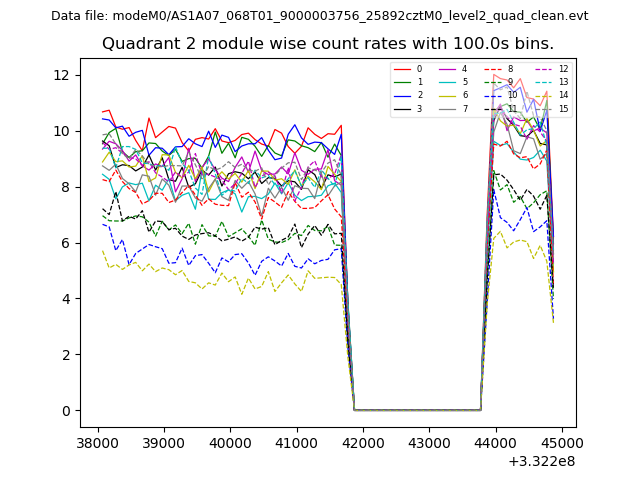 |
 |
| Module-wise count rates for Quadrant D Data is divided into 100 sec bins |
 |
 |
| Parameter | Plot |
|---|---|
| CZT HV Monitor | 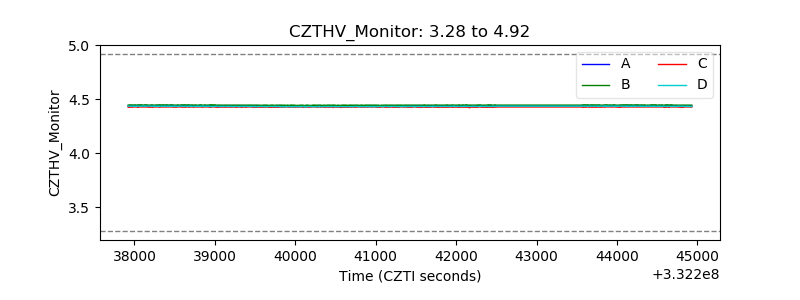 |
| D_VDD |  |
| Temperature 1 |  |
| Veto HV Monitor |  |
| Veto LLD |  |
| Alpha Counter | 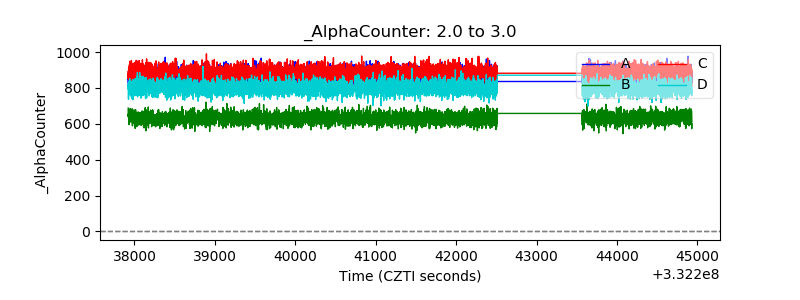 |
| _CPM_Rate | 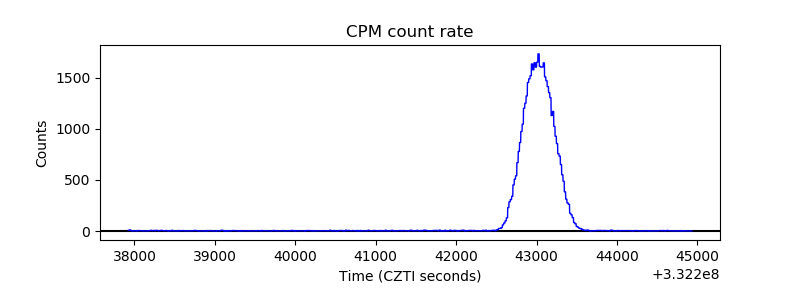 |
| CZT Counter |  |
| +2.5 Volts monitor |  |
| +5 Volts monitor |  |
| _ROLL_ROT |  |
| _Roll_DEC |  |
| _Roll_RA |  |
| Veto Counter |  |