| Param | Original file | Final file |
|---|---|---|
| Filename | modeM0/AS1A07_068T01_9000003756_25893cztM0_level2.evt | modeM0/AS1A07_068T01_9000003756_25893cztM0_level2_quad_clean.evt |
| Size (bytes) | 463,691,520 | 113,569,920 |
| Size | 442.2 MB | 108.3 MB |
| Events in quadrant A | 3,729,027 | 775,526 |
| Events in quadrant B | 3,523,370 | 768,725 |
| Events in quadrant C | 3,129,881 | 730,729 |
| Events in quadrant D | 3,249,614 | 741,982 |
| Mode M0 | |||
|---|---|---|---|
| Quadrant | BADHDUFLAG | Total packets | Discarded packets |
| A | 0 | 15261 | 0 |
| B | 0 | 14326 | 0 |
| C | 0 | 13171 | 0 |
| D | 0 | 13505 | 0 |
| Mode M9 | |||
|---|---|---|---|
| Quadrant | BADHDUFLAG | Total packets | Discarded packets |
| A | 0 | 12 | 0 |
| B | 0 | 12 | 0 |
| C | 0 | 12 | 0 |
| D | 0 | 12 | 0 |
| Quadrant | Total seconds | Saturated seconds | Saturation percentage |
|---|---|---|---|
| A | 6046 | 77 | 1.273569% |
| B | 6055 | 106 | 1.750619% |
| C | 6051 | 78 | 1.289043% |
| D | 6055 | 62 | 1.023947% |
Noise dominated data is calculated using 1-second bins in cleaned event files. If a bin has >2000 counts, and if more than 50% of those come from <1% of pixels, then it is considered to be noise-dominated and hence unusable.
| Quadrant | # 1 sec bins | Bins with >0 counts | Bins with >2000 counts | High rate bins dominated by noise | Noise dominated (total time) | Noise dominated (detector-on time) | Marked lightcurve |
|---|---|---|---|---|---|---|---|
| A | 7294 | 6069 | 13 | 13 | 0.18% | 0.21% | 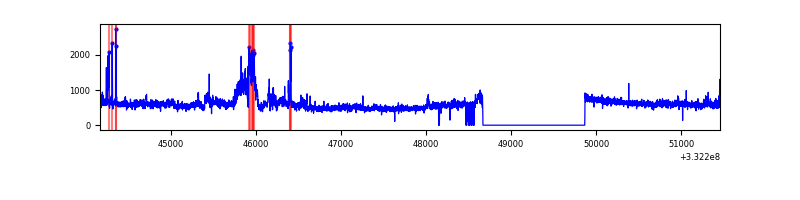 |
| B | 7294 | 6080 | 55 | 55 | 0.75% | 0.90% | 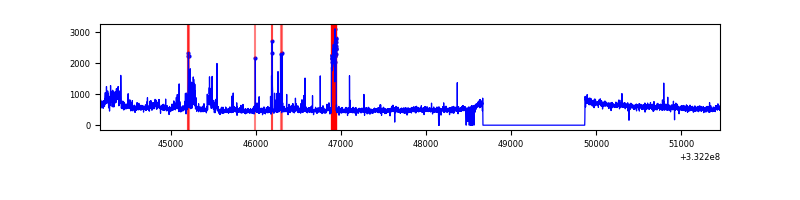 |
| C | 7294 | 6075 | 0 | 0 | 0.00% | 0.00% | 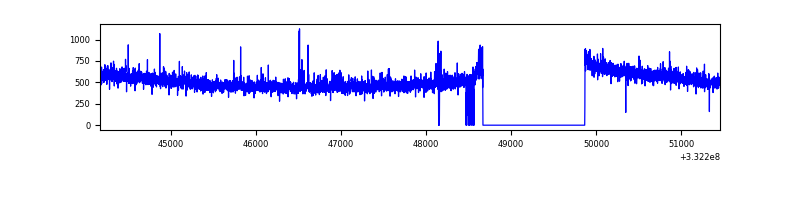 |
| D | 7294 | 6082 | 20 | 20 | 0.27% | 0.33% | 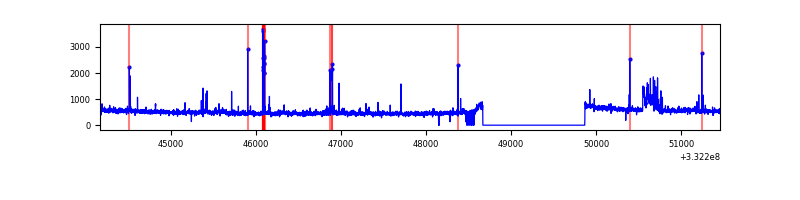 |
Top three noisy pixels from each quadrant. If the there are fewer than three noisy pixels in the level2.evt file, extra rows are filled as -1
| Pixel properties | Quadrant properties | ||||||
|---|---|---|---|---|---|---|---|
| Quadrant | DetID | PixID | Counts | Sigma | Mean | Median | Sigma |
| A | 0 | 13 | 605535 | 3755.19 | 807 | 795 | 161.0 |
| A | 13 | 254 | 10325 | 59.18 | 807 | 795 | 161.0 |
| A | 8 | 192 | 8873 | 50.16 | 807 | 795 | 161.0 |
| B | 10 | 245 | 322103 | 2176.0 | 784 | 768 | 147.7 |
| B | 0 | 219 | 89247 | 599.16 | 784 | 768 | 147.7 |
| B | 12 | 111 | 17113 | 110.68 | 784 | 768 | 147.7 |
| C | 14 | 238 | 122283 | 695.2 | 754 | 759 | 174.8 |
| C | 3 | 233 | 69253 | 391.83 | 754 | 759 | 174.8 |
| C | 13 | 61 | 5139 | 25.06 | 754 | 759 | 174.8 |
| D | 1 | 52 | 131658 | 699.45 | 782 | 764 | 187.1 |
| D | 7 | 80 | 131611 | 699.2 | 782 | 764 | 187.1 |
| D | 2 | 234 | 24664 | 127.71 | 782 | 764 | 187.1 |
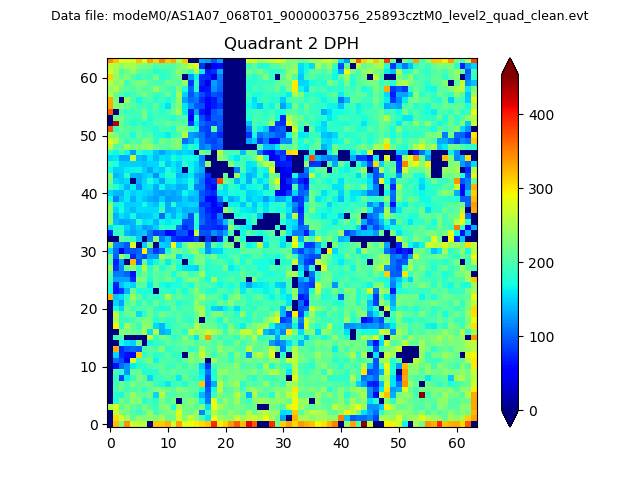
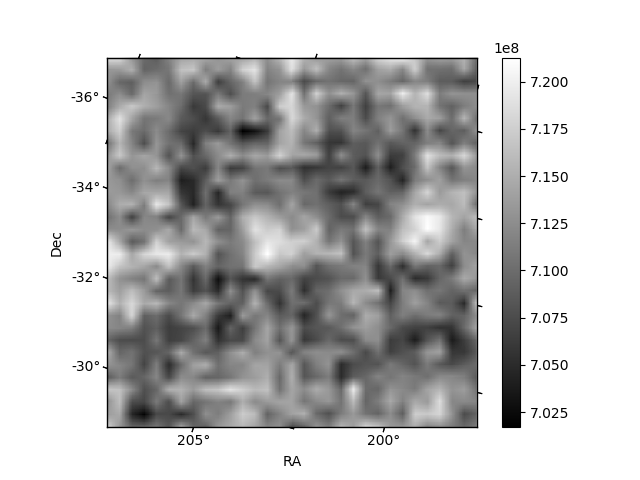
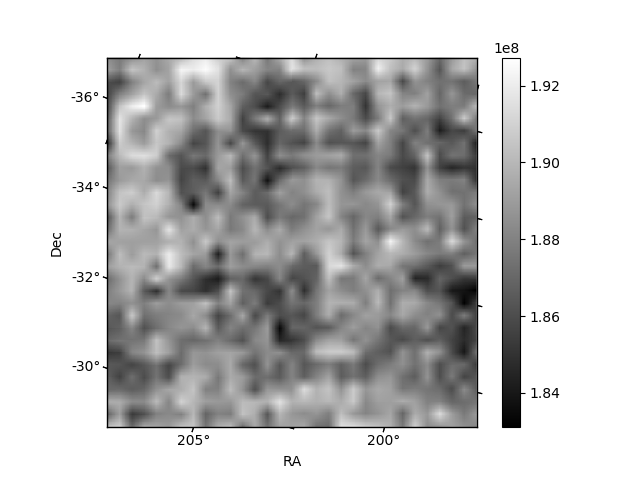
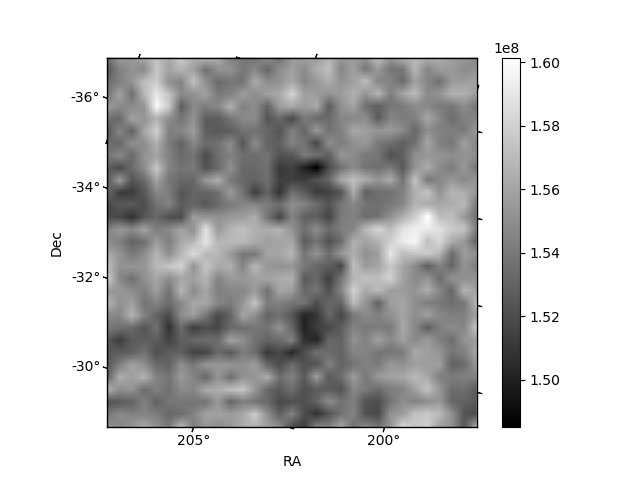
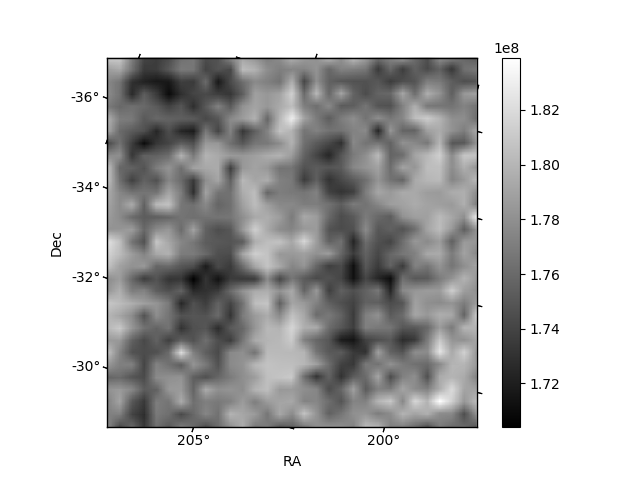
Histogram calculated using DETX and DETY for each event in the final _common_clean file
| Quadrant A | 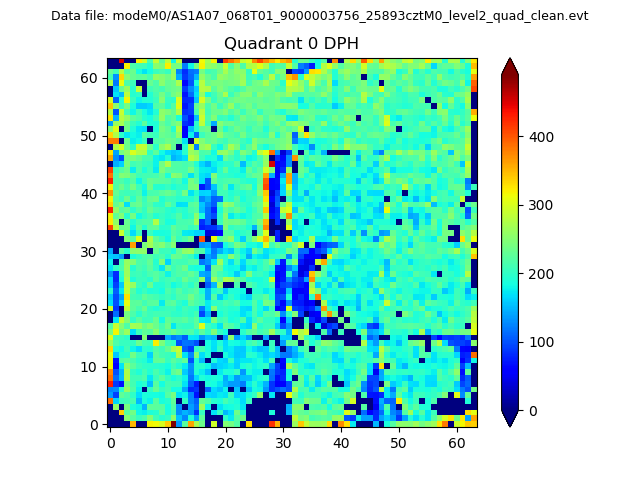 |
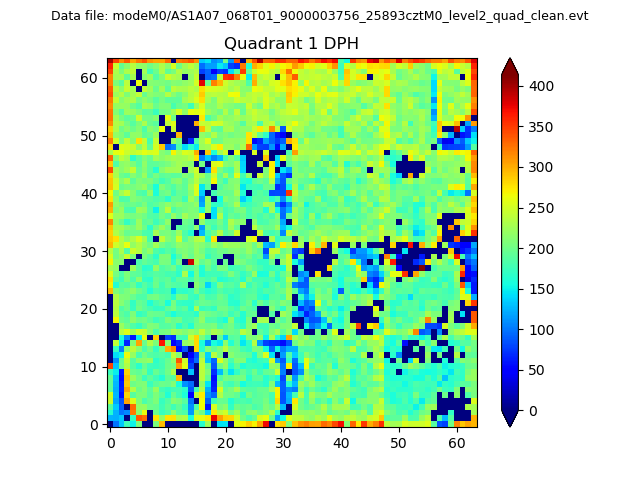 |
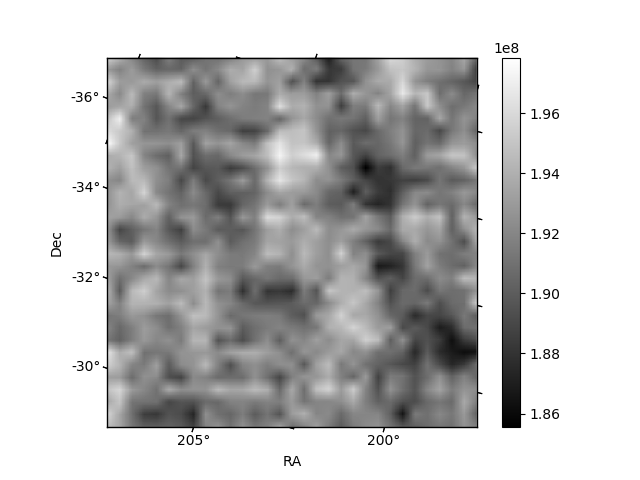
Quadrant B |
|---|---|---|---|
| Quadrant D | 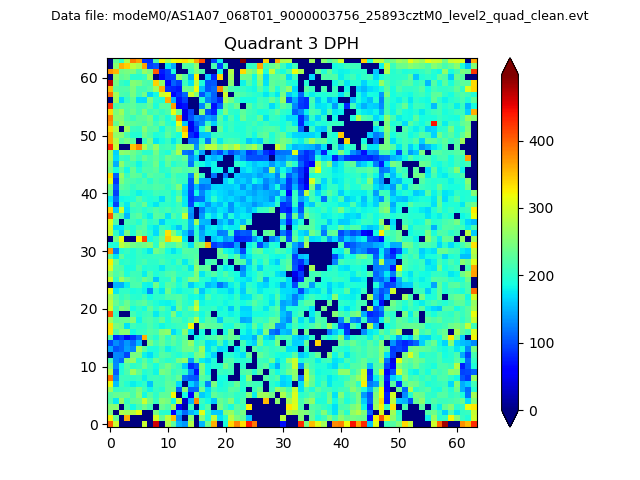 |
 |
Quadrant C |
| Plot type | Count rate plots | Images |
|---|---|---|
| Comparison with Poisson distribution Blue bars denote a histogram of data divided into 1 sec bins. Red curve is a Poisson curve with rate = median count rate of data. |
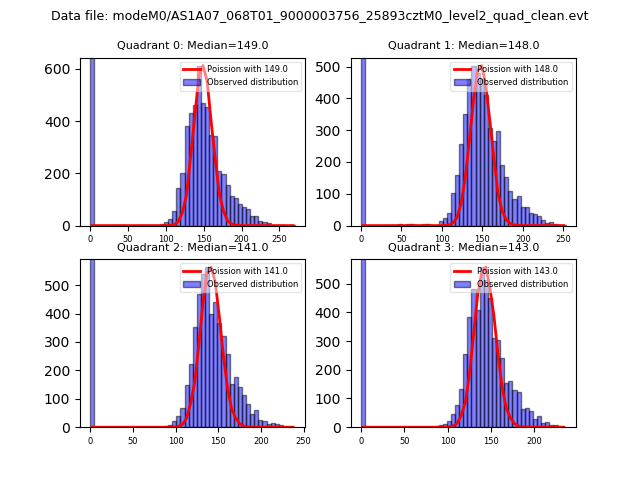 |
 |
| Quadrant-wise count rates Data is divided into 100 sec bins |
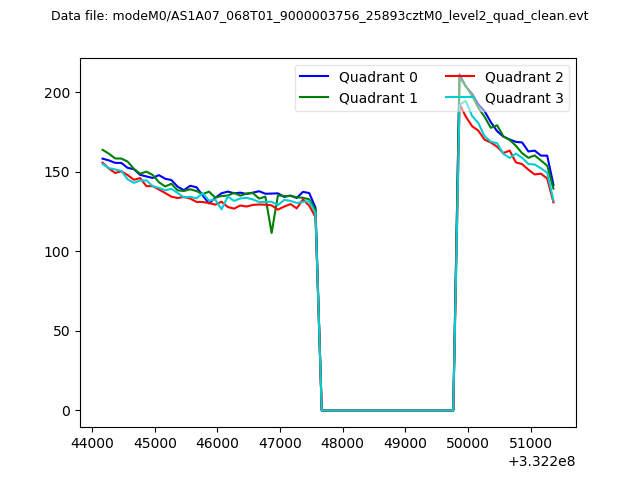 |
|
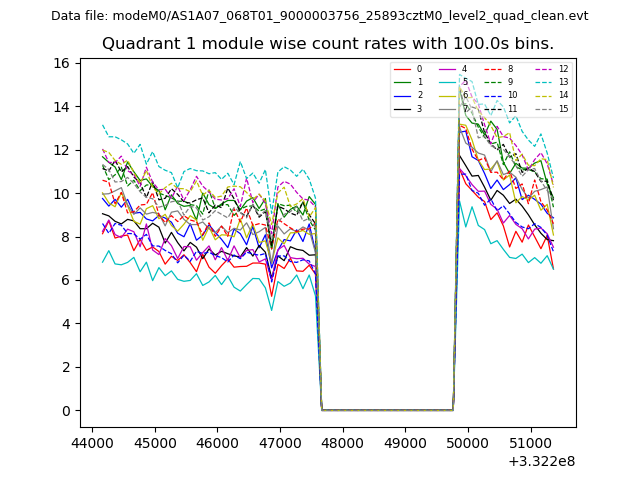
| Module-wise count rates for Quadrant A Data is divided into 100 sec bins |
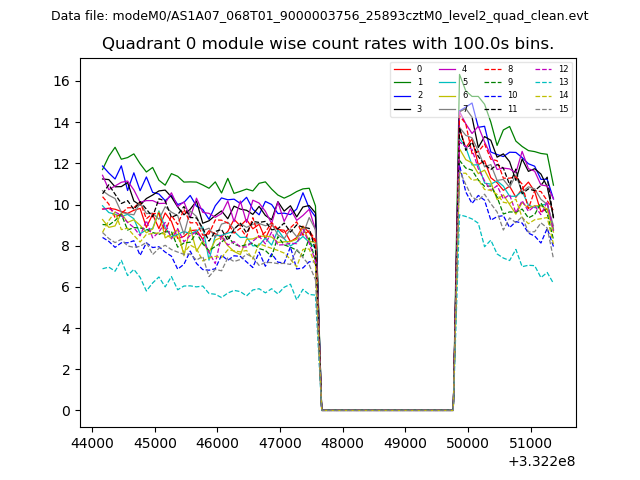 |
 |
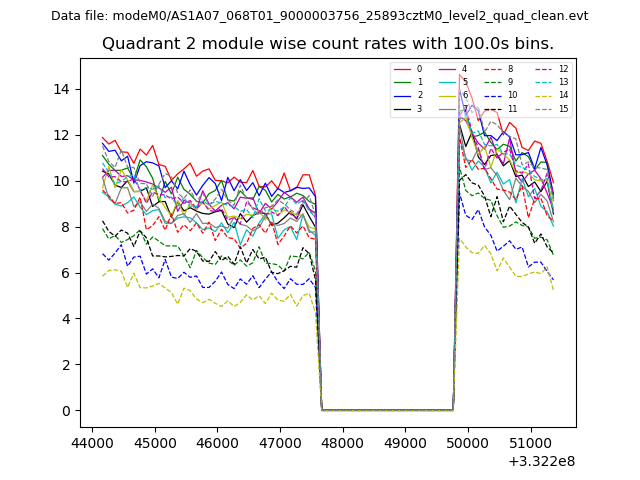
| Module-wise count rates for Quadrant B Data is divided into 100 sec bins |
 |
 |
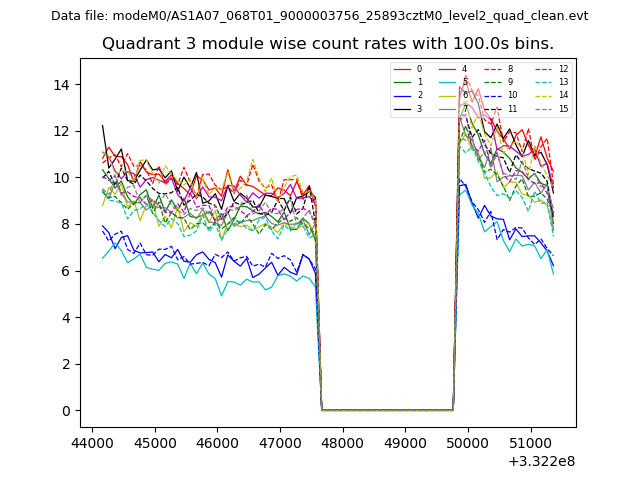
| Module-wise count rates for Quadrant C Data is divided into 100 sec bins |
 |
 |
| Module-wise count rates for Quadrant D Data is divided into 100 sec bins |
 |
 |
| Parameter | Plot |
|---|---|
| CZT HV Monitor | 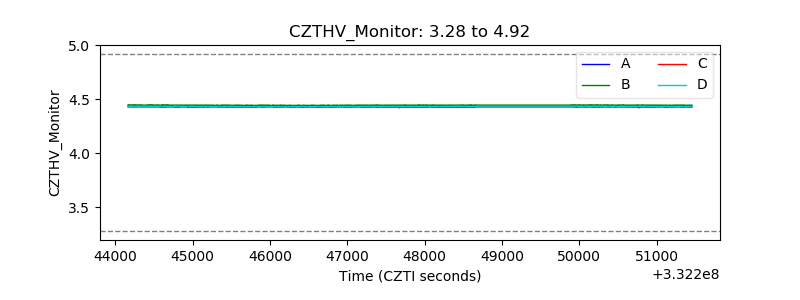 |
| D_VDD | 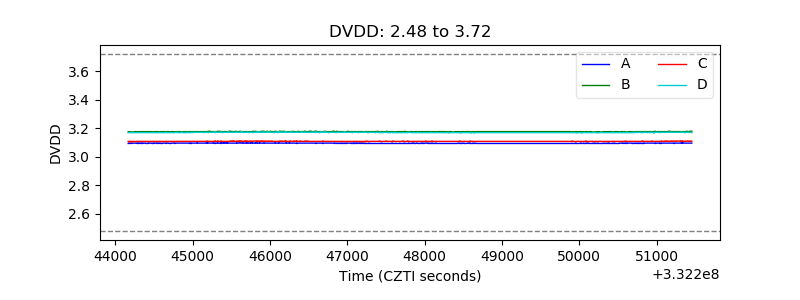 |
| Temperature 1 | 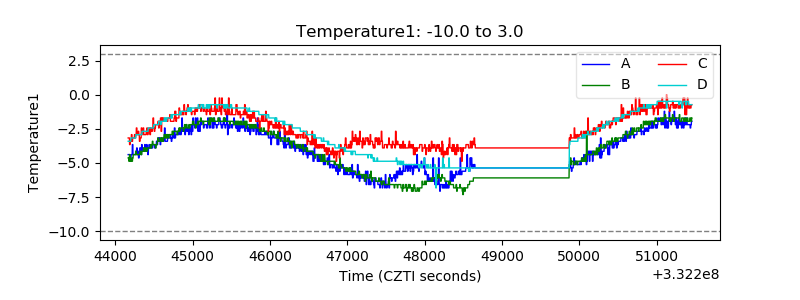 |
| Veto HV Monitor |  |
| Veto LLD | 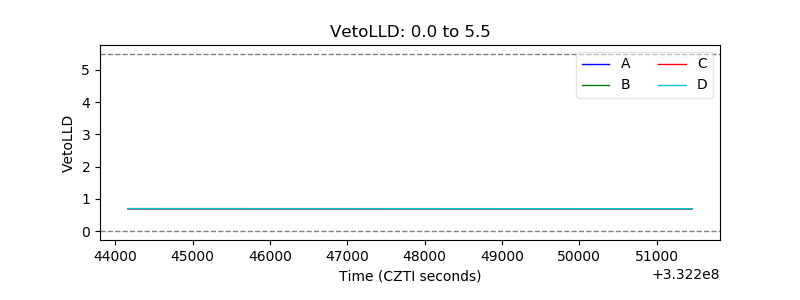 |
| Alpha Counter | 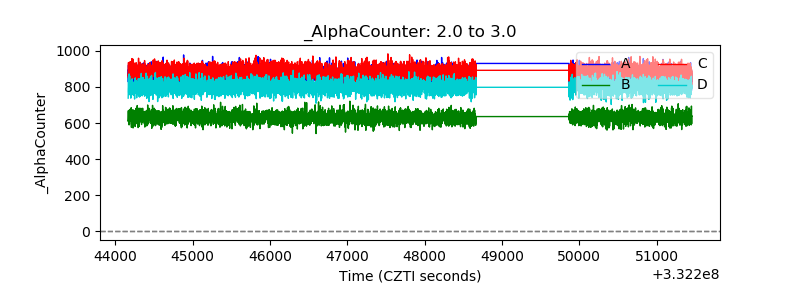 |
| _CPM_Rate | 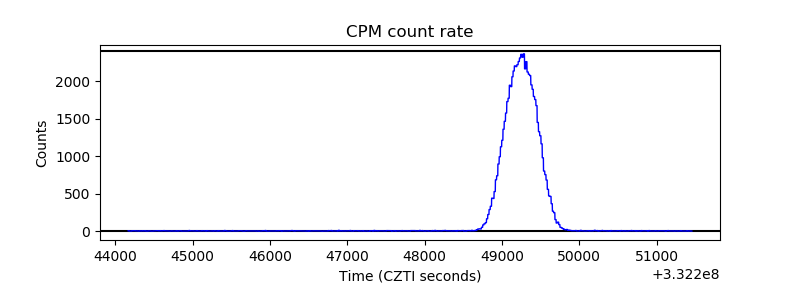 |
| CZT Counter | 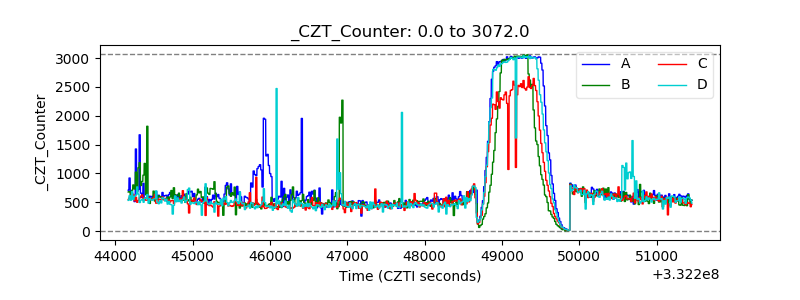 |
| +2.5 Volts monitor | 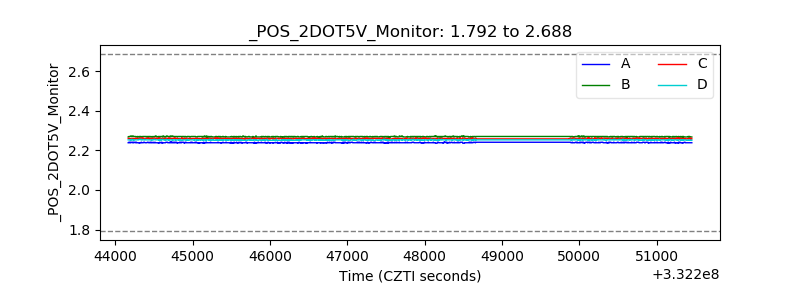 |
| +5 Volts monitor |  |
| _ROLL_ROT | 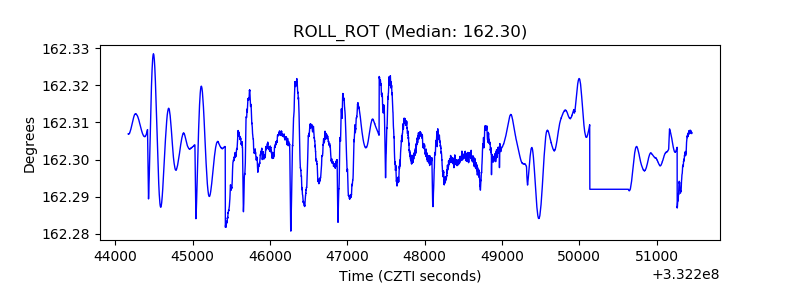 |
| _Roll_DEC | 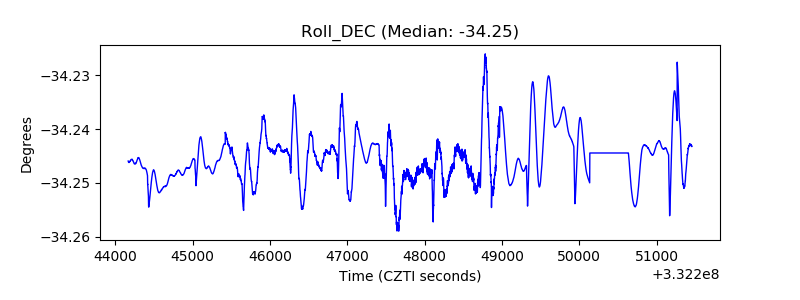 |
| _Roll_RA | 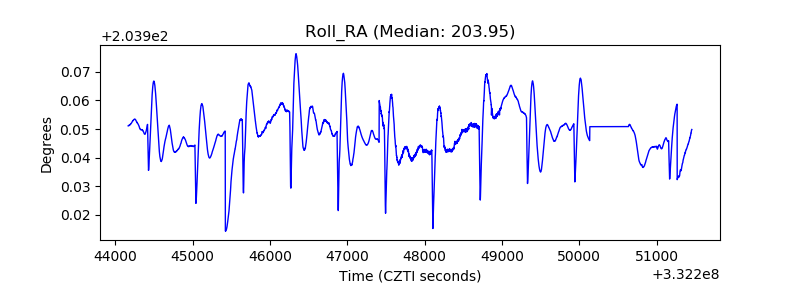 |
| Veto Counter | 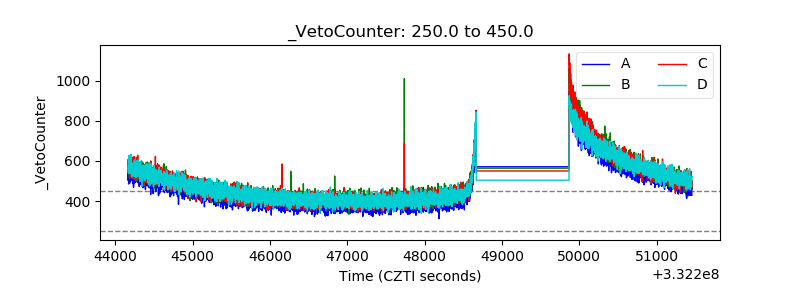 |