| Param | Original file | Final file |
|---|---|---|
| Filename | modeM0/AS1A07_068T01_9000003756_25894cztM0_level2.evt | modeM0/AS1A07_068T01_9000003756_25894cztM0_level2_quad_clean.evt |
| Size (bytes) | 501,917,760 | 102,144,960 |
| Size | 478.7 MB | 97.4 MB |
| Events in quadrant A | 3,441,347 | 712,982 |
| Events in quadrant B | 3,162,961 | 701,642 |
| Events in quadrant C | 3,231,052 | 657,898 |
| Events in quadrant D | 4,972,576 | 616,281 |
| Mode M0 | |||
|---|---|---|---|
| Quadrant | BADHDUFLAG | Total packets | Discarded packets |
| A | 0 | 13975 | 0 |
| B | 0 | 12937 | 0 |
| C | 0 | 13383 | 0 |
| D | 0 | 18548 | 0 |
| Mode M9 | |||
|---|---|---|---|
| Quadrant | BADHDUFLAG | Total packets | Discarded packets |
| A | 0 | 13 | 0 |
| B | 0 | 13 | 0 |
| C | 0 | 13 | 0 |
| D | 0 | 13 | 0 |
| Quadrant | Total seconds | Saturated seconds | Saturation percentage |
|---|---|---|---|
| A | 5787 | 97 | 1.676171% |
| B | 5786 | 99 | 1.711027% |
| C | 5786 | 126 | 2.177670% |
| D | 5786 | 749 | 12.945040% |
Noise dominated data is calculated using 1-second bins in cleaned event files. If a bin has >2000 counts, and if more than 50% of those come from <1% of pixels, then it is considered to be noise-dominated and hence unusable.
| Quadrant | # 1 sec bins | Bins with >0 counts | Bins with >2000 counts | High rate bins dominated by noise | Noise dominated (total time) | Noise dominated (detector-on time) | Marked lightcurve |
|---|---|---|---|---|---|---|---|
| A | 7052 | 5788 | 2 | 2 | 0.03% | 0.03% | 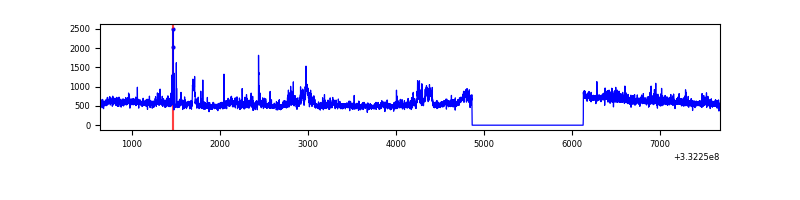 |
| B | 7051 | 5787 | 3 | 3 | 0.04% | 0.05% | 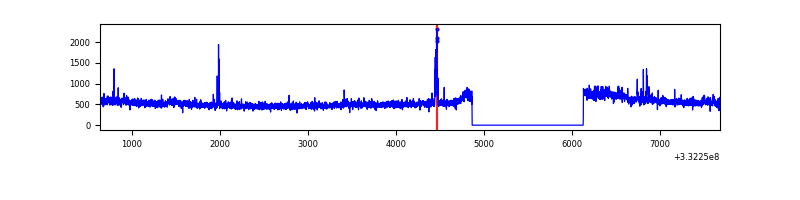 |
| C | 7051 | 5787 | 2 | 2 | 0.03% | 0.03% | 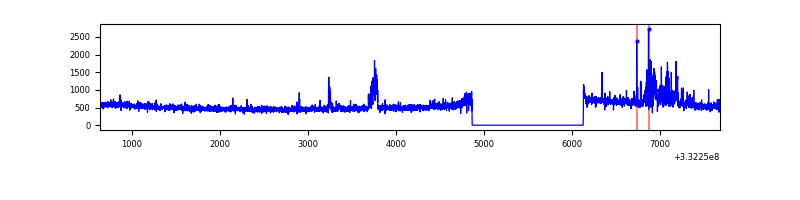 |
| D | 7051 | 5787 | 557 | 557 | 7.90% | 9.63% | 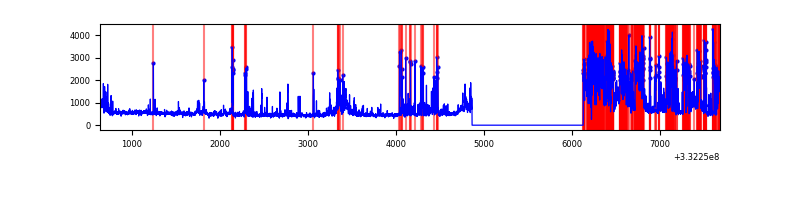 |
Top three noisy pixels from each quadrant. If the there are fewer than three noisy pixels in the level2.evt file, extra rows are filled as -1
| Pixel properties | Quadrant properties | ||||||
|---|---|---|---|---|---|---|---|
| Quadrant | DetID | PixID | Counts | Sigma | Mean | Median | Sigma |
| A | 0 | 13 | 396610 | 2519.94 | 787 | 774 | 157.1 |
| A | 13 | 254 | 9565 | 55.96 | 787 | 774 | 157.1 |
| A | 8 | 192 | 7900 | 45.37 | 787 | 774 | 157.1 |
| B | 0 | 219 | 84057 | 580.42 | 763 | 746 | 143.5 |
| B | 10 | 245 | 42599 | 291.58 | 763 | 746 | 143.5 |
| B | 0 | 190 | 30431 | 206.81 | 763 | 746 | 143.5 |
| C | 3 | 233 | 281208 | 1667.34 | 726 | 730 | 168.2 |
| C | 14 | 238 | 120112 | 709.68 | 726 | 730 | 168.2 |
| C | 13 | 61 | 5020 | 25.5 | 726 | 730 | 168.2 |
| D | 1 | 52 | 2057124 | 12175.15 | 712 | 695 | 168.9 |
| D | 7 | 80 | 175061 | 1032.34 | 712 | 695 | 168.9 |
| D | 2 | 234 | 22037 | 126.36 | 712 | 695 | 168.9 |
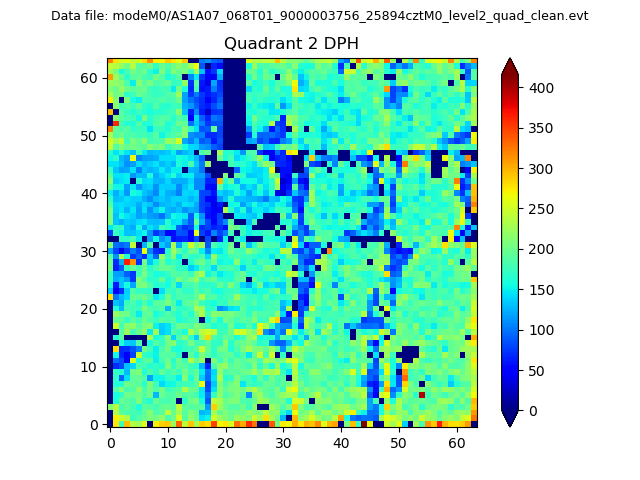
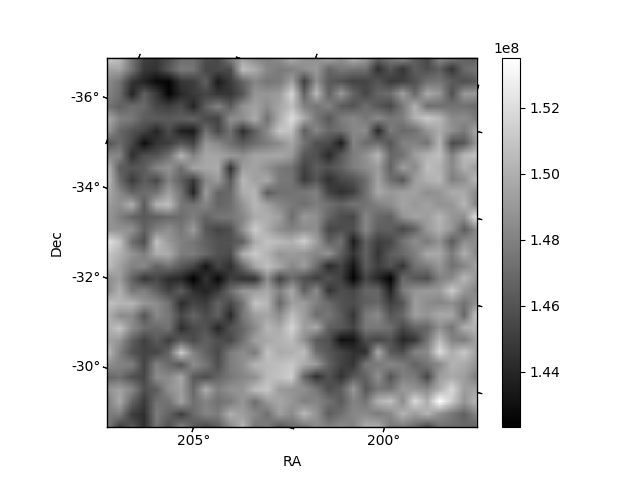
Histogram calculated using DETX and DETY for each event in the final _common_clean file
| Quadrant A | 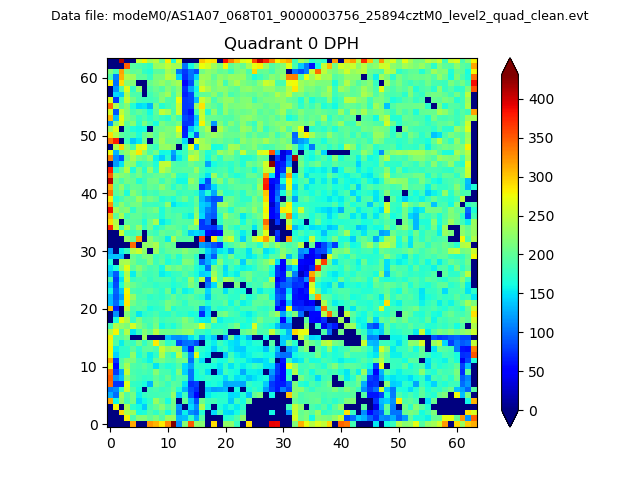 |
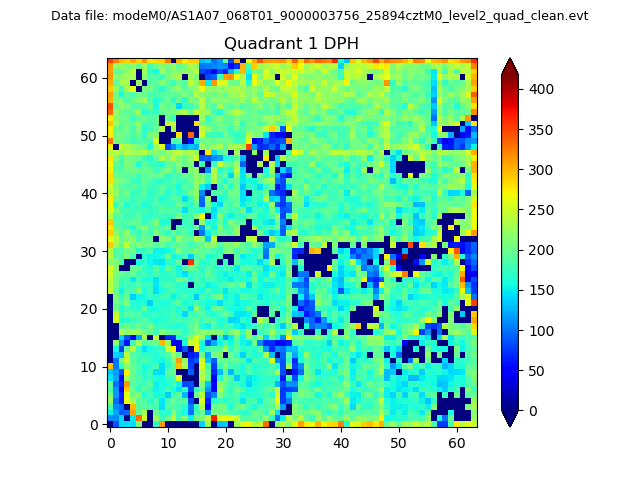 |
Quadrant B |
|---|---|---|---|
| Quadrant D | 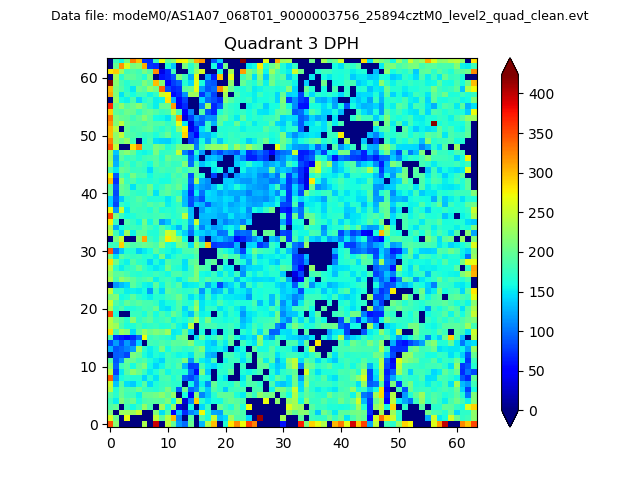 |
 |
Quadrant C |
| Plot type | Count rate plots | Images |
|---|---|---|
| Comparison with Poisson distribution Blue bars denote a histogram of data divided into 1 sec bins. Red curve is a Poisson curve with rate = median count rate of data. |
 |
 |
| Quadrant-wise count rates Data is divided into 100 sec bins |
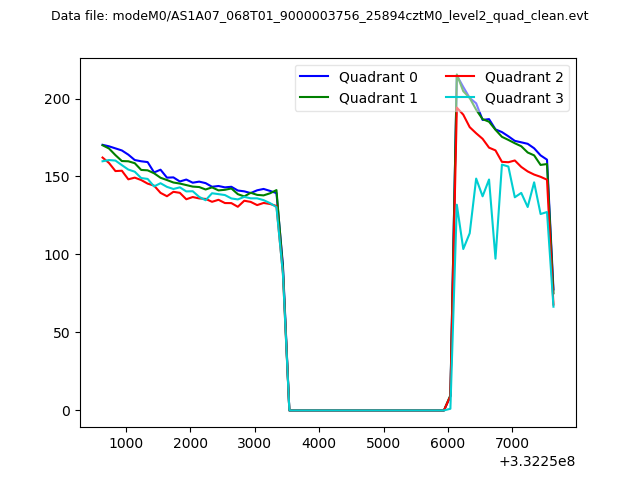 |
|
| Module-wise count rates for Quadrant A Data is divided into 100 sec bins |
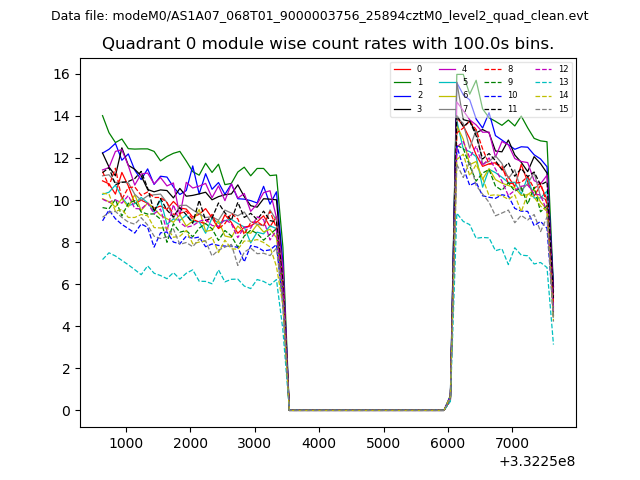 |
 |
| Module-wise count rates for Quadrant B Data is divided into 100 sec bins |
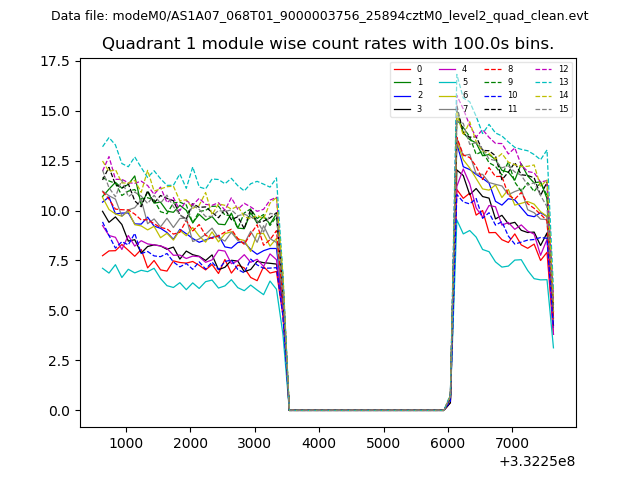 |
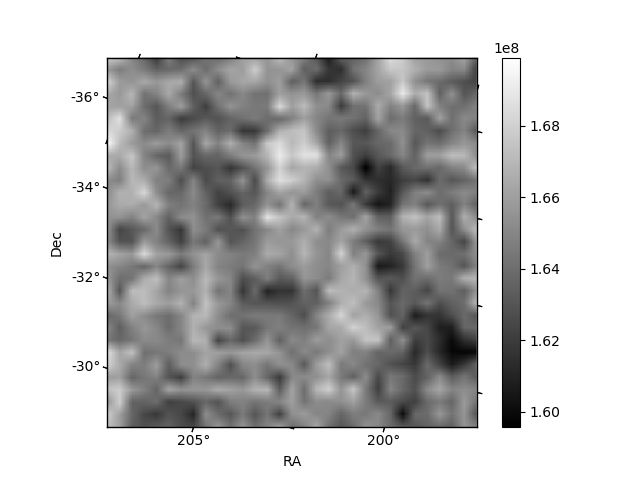 |
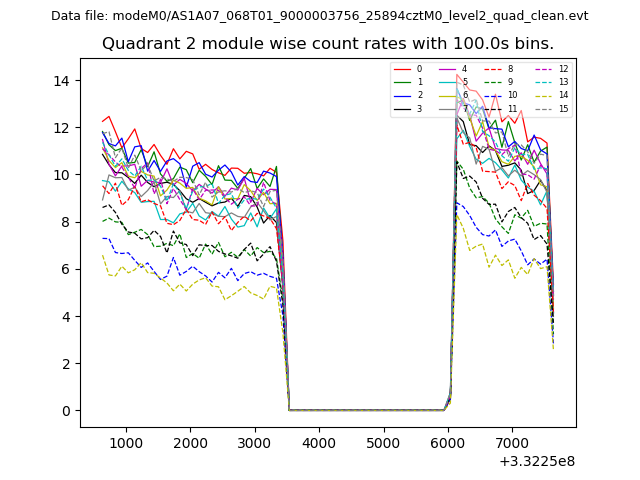
| Module-wise count rates for Quadrant C Data is divided into 100 sec bins |
 |
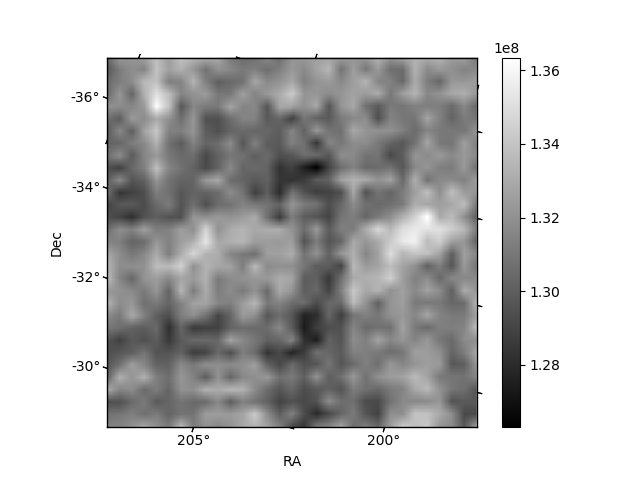 |
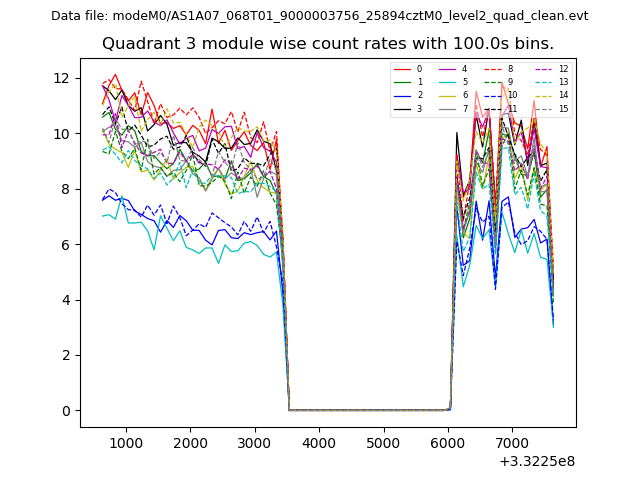
| Module-wise count rates for Quadrant D Data is divided into 100 sec bins |
 |
 |
| Parameter | Plot |
|---|---|
| CZT HV Monitor | 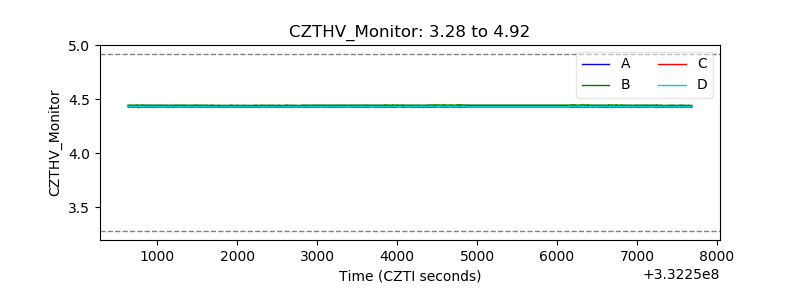 |
| D_VDD | 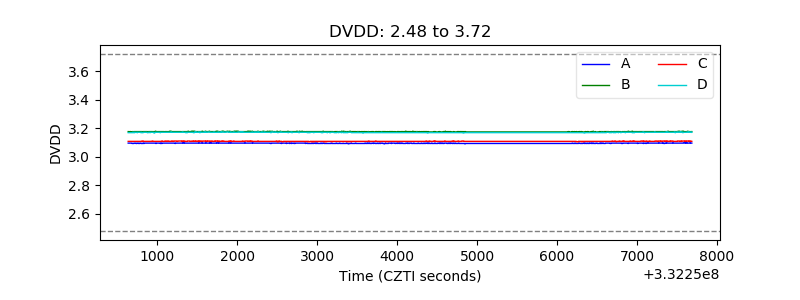 |
| Temperature 1 | 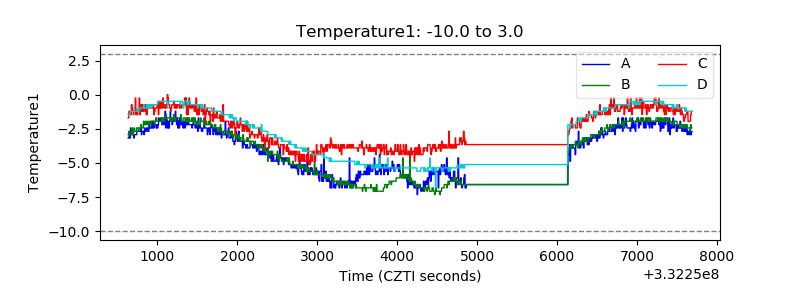 |
| Veto HV Monitor | 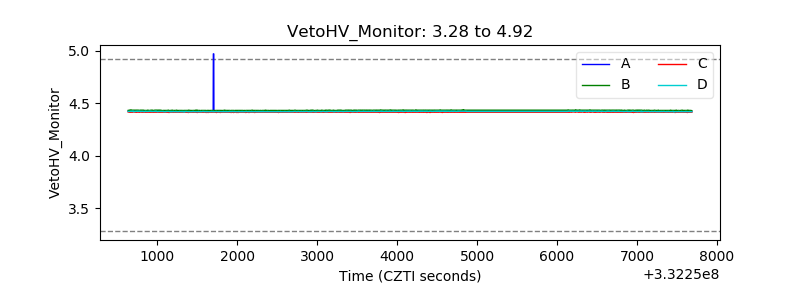 |
| Veto LLD | 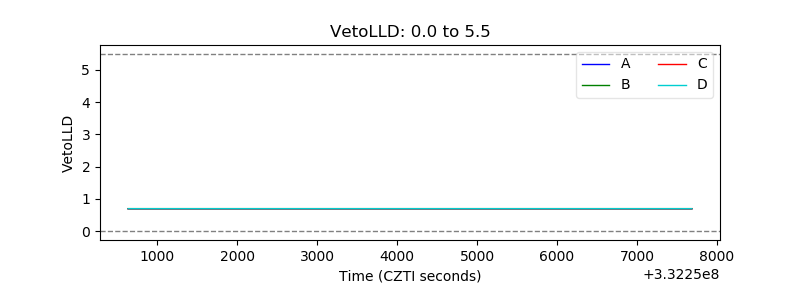 |
| Alpha Counter | 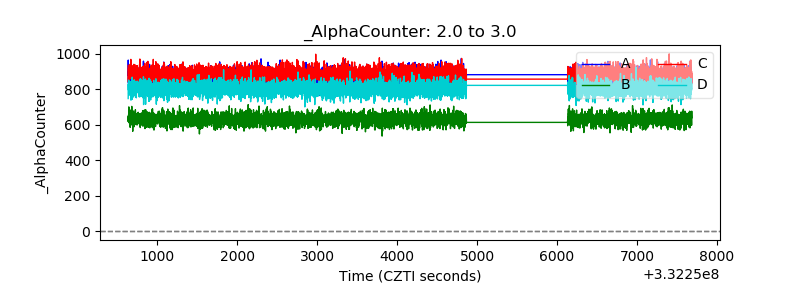 |
| _CPM_Rate | 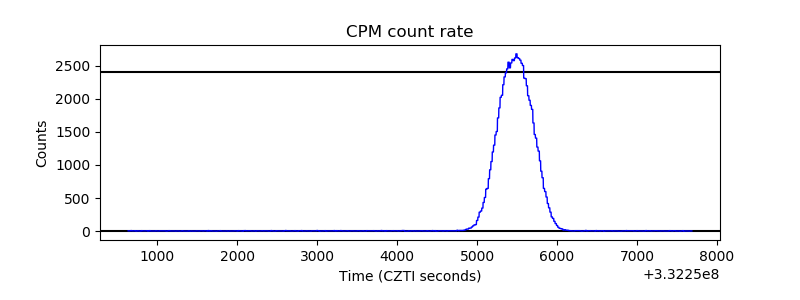 |
| CZT Counter | 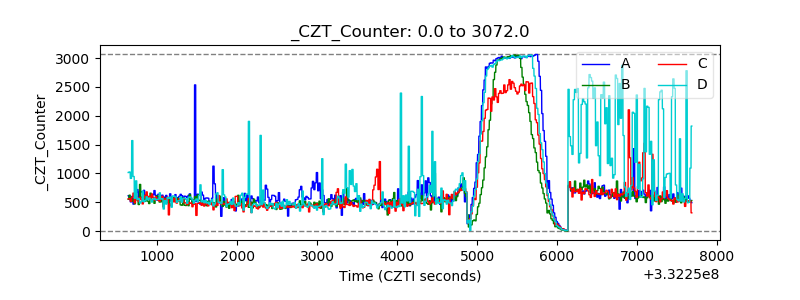 |
| +2.5 Volts monitor |  |
| +5 Volts monitor |  |
| _ROLL_ROT | 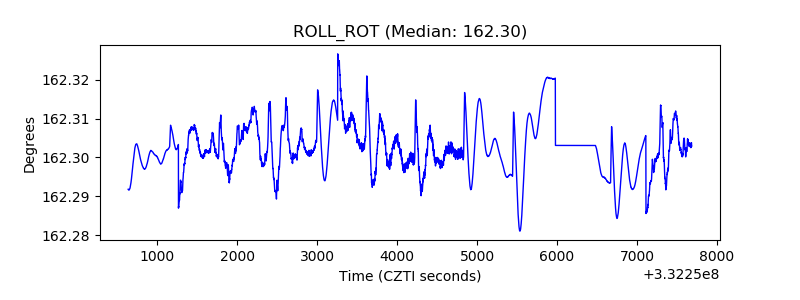 |
| _Roll_DEC | 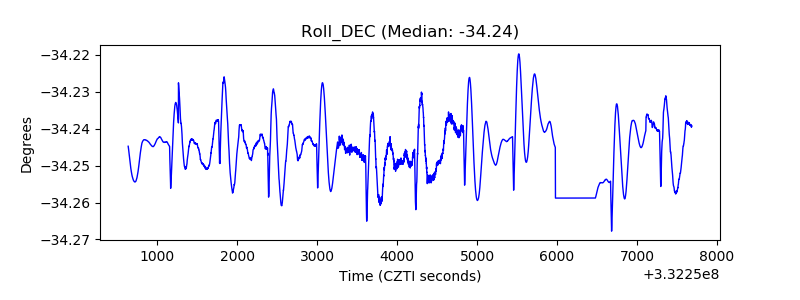 |
| _Roll_RA |  |
| Veto Counter | 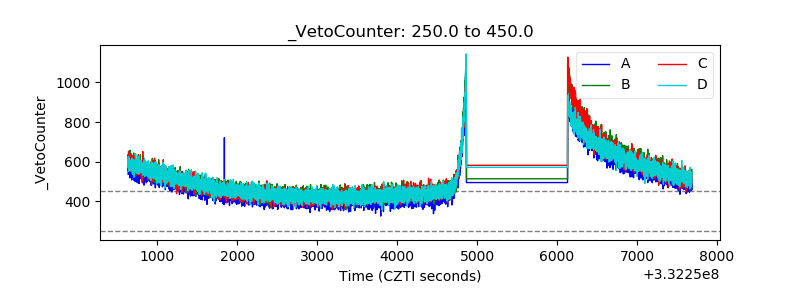 |