| Param | Original file | Final file |
|---|---|---|
| Filename | modeM0/AS1A07_068T01_9000003756_25896cztM0_level2.evt | modeM0/AS1A07_068T01_9000003756_25896cztM0_level2_quad_clean.evt |
| Size (bytes) | 552,571,200 | 80,907,840 |
| Size | 527.0 MB | 77.2 MB |
| Events in quadrant A | 5,097,053 | 529,459 |
| Events in quadrant B | 3,088,880 | 549,023 |
| Events in quadrant C | 2,901,637 | 510,489 |
| Events in quadrant D | 5,265,714 | 466,797 |
| Mode M0 | |||
|---|---|---|---|
| Quadrant | BADHDUFLAG | Total packets | Discarded packets |
| A | 0 | 19244 | 0 |
| B | 0 | 12565 | 0 |
| C | 0 | 12091 | 0 |
| D | 0 | 19461 | 0 |
| Mode M9 | |||
|---|---|---|---|
| Quadrant | BADHDUFLAG | Total packets | Discarded packets |
| A | 0 | 13 | 0 |
| B | 0 | 13 | 1 |
| C | 0 | 13 | 1 |
| D | 0 | 13 | 0 |
| Quadrant | Total seconds | Saturated seconds | Saturation percentage |
|---|---|---|---|
| A | 5610 | 275 | 4.901961% |
| B | 5633 | 95 | 1.686490% |
| C | 5634 | 103 | 1.828186% |
| D | 5614 | 770 | 13.715711% |
Noise dominated data is calculated using 1-second bins in cleaned event files. If a bin has >2000 counts, and if more than 50% of those come from <1% of pixels, then it is considered to be noise-dominated and hence unusable.
| Quadrant | # 1 sec bins | Bins with >0 counts | Bins with >2000 counts | High rate bins dominated by noise | Noise dominated (total time) | Noise dominated (detector-on time) | Marked lightcurve |
|---|---|---|---|---|---|---|---|
| A | 7242 | 5675 | 141 | 141 | 1.95% | 2.48% | 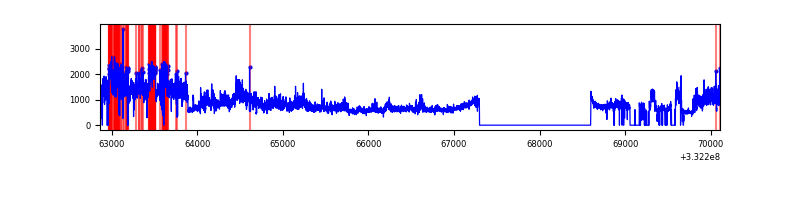 |
| B | 7243 | 5697 | 3 | 3 | 0.04% | 0.05% | 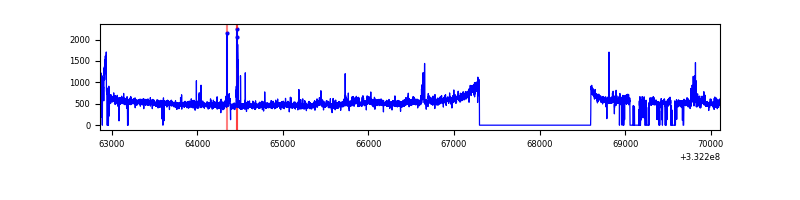 |
| C | 7243 | 5692 | 0 | 0 | 0.00% | 0.00% | 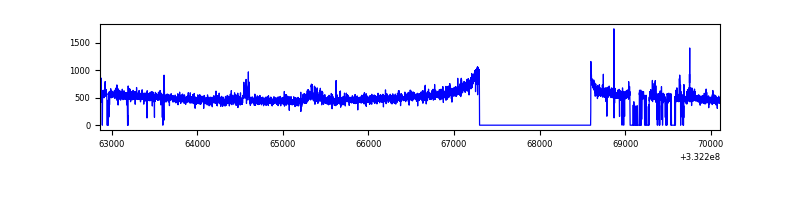 |
| D | 7243 | 5674 | 654 | 654 | 9.03% | 11.53% | 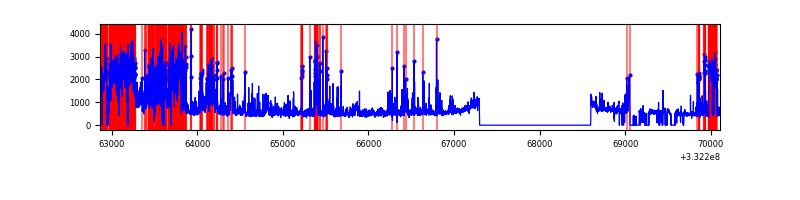 |
Top three noisy pixels from each quadrant. If the there are fewer than three noisy pixels in the level2.evt file, extra rows are filled as -1
| Pixel properties | Quadrant properties | ||||||
|---|---|---|---|---|---|---|---|
| Quadrant | DetID | PixID | Counts | Sigma | Mean | Median | Sigma |
| A | 0 | 13 | 2219273 | 15065.89 | 739 | 727 | 147.3 |
| A | 8 | 192 | 24881 | 164.03 | 739 | 727 | 147.3 |
| A | 13 | 254 | 10430 | 65.89 | 739 | 727 | 147.3 |
| B | 0 | 219 | 84543 | 601.41 | 733 | 716 | 139.4 |
| B | 10 | 245 | 57011 | 403.88 | 733 | 716 | 139.4 |
| B | 0 | 190 | 50051 | 353.95 | 733 | 716 | 139.4 |
| C | 14 | 238 | 113060 | 700.92 | 693 | 699 | 160.3 |
| C | 3 | 233 | 82791 | 512.1 | 693 | 699 | 160.3 |
| C | 13 | 61 | 4668 | 24.76 | 693 | 699 | 160.3 |
| D | 1 | 52 | 2150284 | 13353.87 | 675 | 660 | 161.0 |
| D | 5 | 223 | 510147 | 3165.03 | 675 | 660 | 161.0 |
| D | 2 | 234 | 22143 | 133.46 | 675 | 660 | 161.0 |
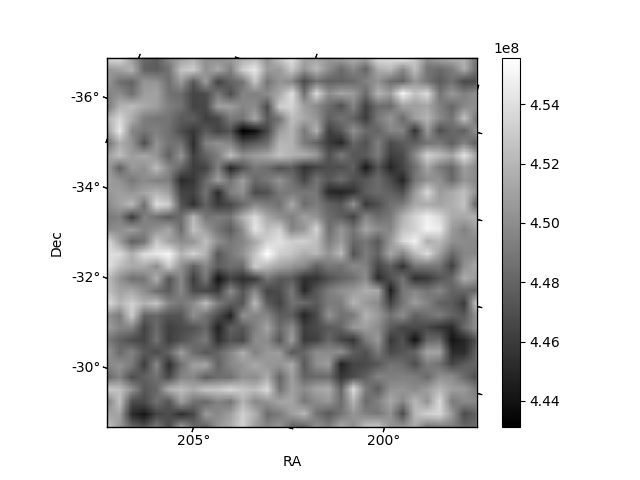
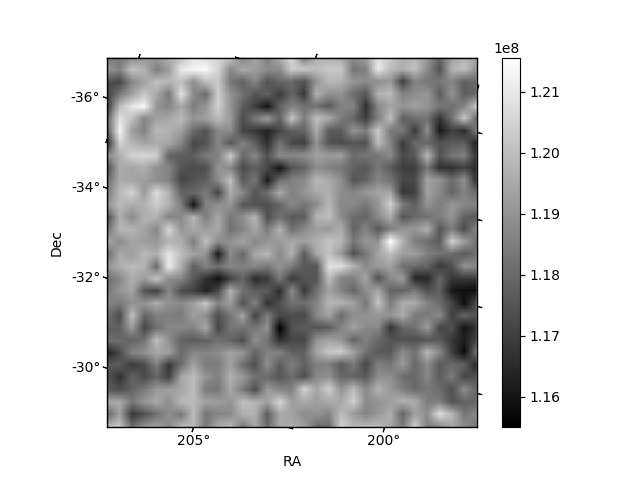
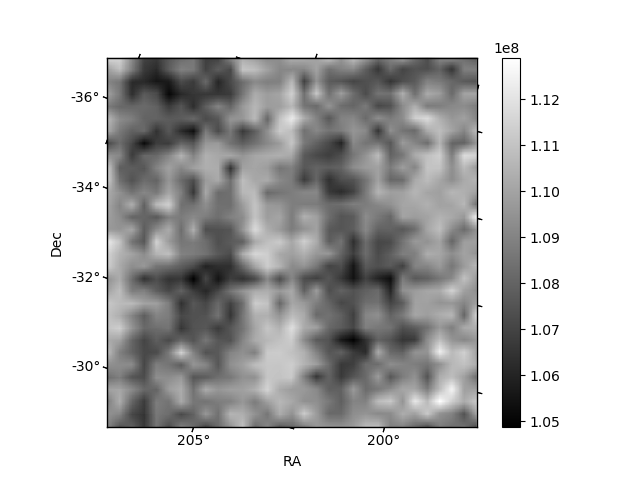
Histogram calculated using DETX and DETY for each event in the final _common_clean file
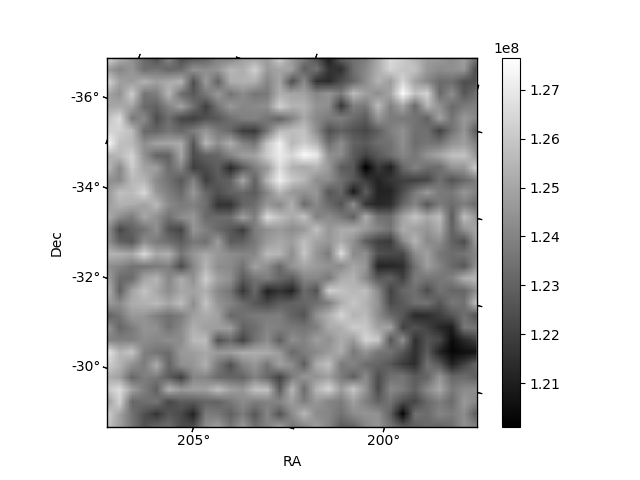
| Quadrant A | 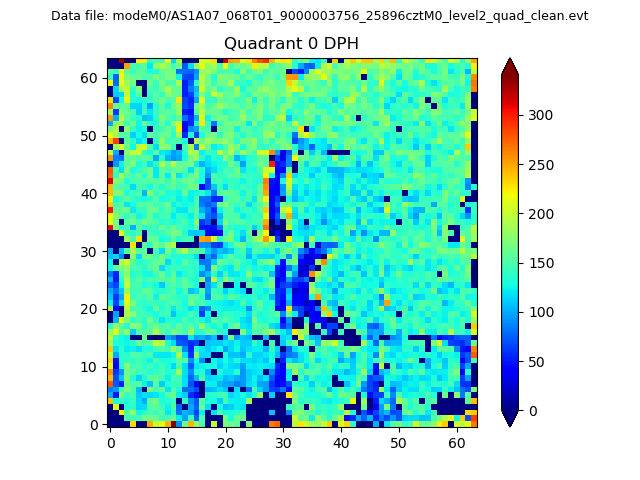 |
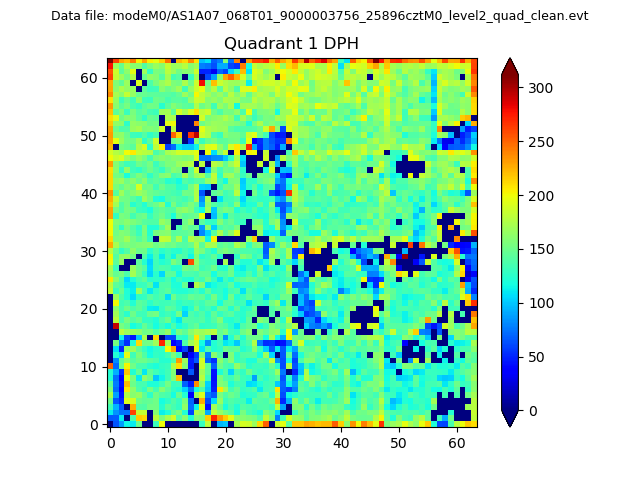 |
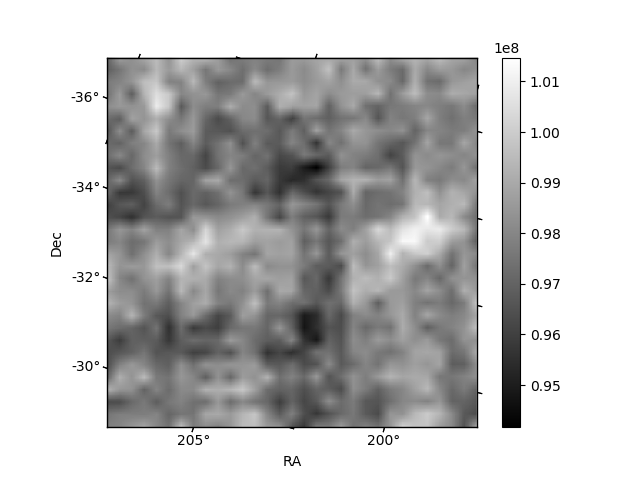
Quadrant B |
|---|---|---|---|
| Quadrant D |  |
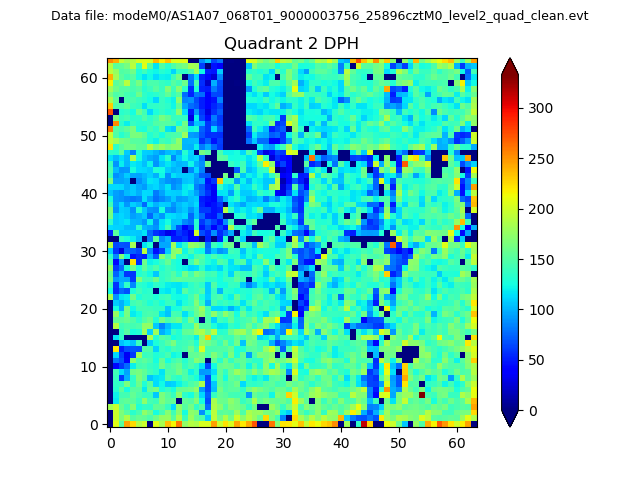 |
Quadrant C |
| Plot type | Count rate plots | Images |
|---|---|---|
| Comparison with Poisson distribution Blue bars denote a histogram of data divided into 1 sec bins. Red curve is a Poisson curve with rate = median count rate of data. |
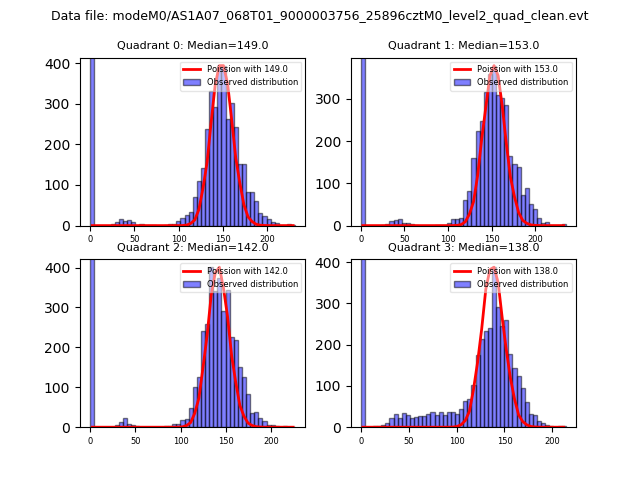 |
 |
| Quadrant-wise count rates Data is divided into 100 sec bins |
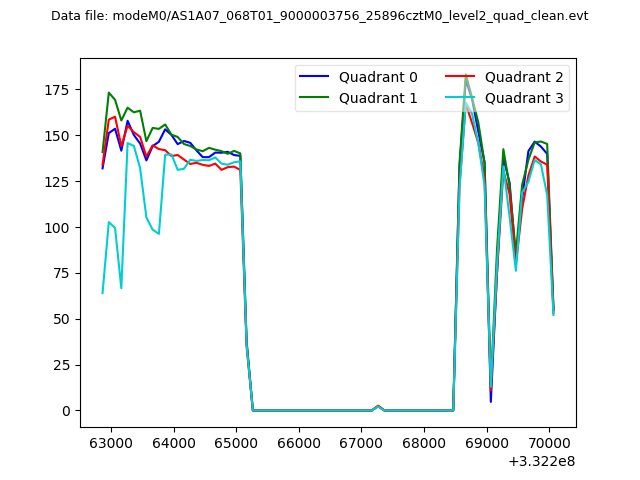 |
|
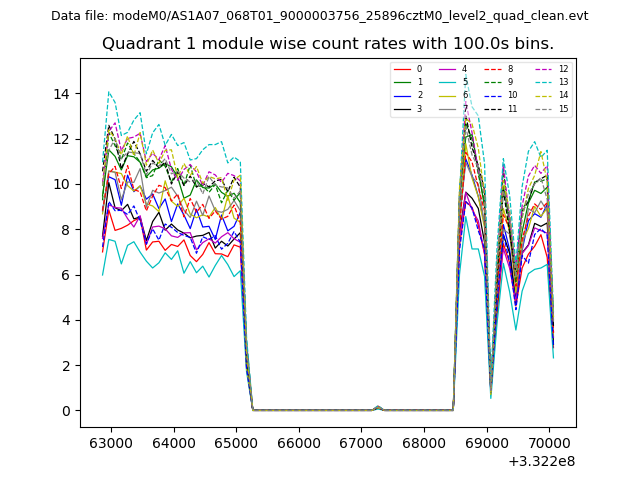
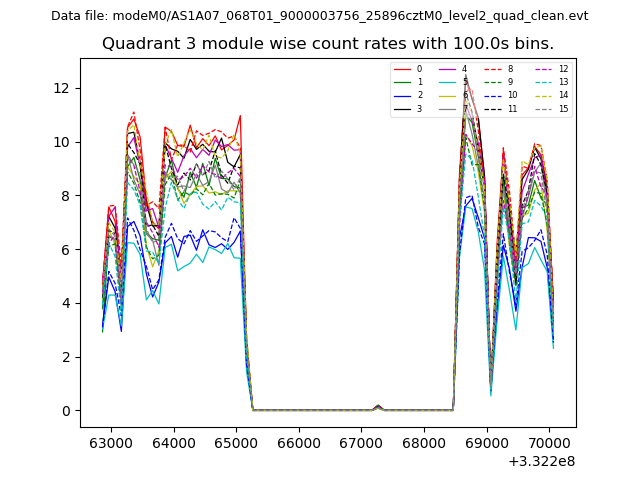
| Module-wise count rates for Quadrant A Data is divided into 100 sec bins |
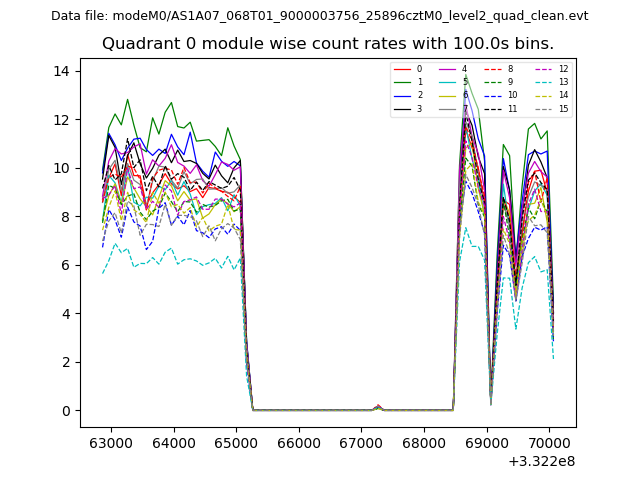 |
 |
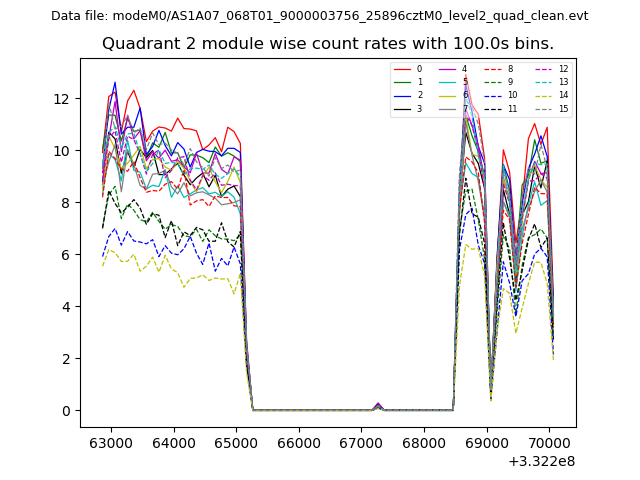
| Module-wise count rates for Quadrant B Data is divided into 100 sec bins |
 |
 |
| Module-wise count rates for Quadrant C Data is divided into 100 sec bins |
 |
 |
| Module-wise count rates for Quadrant D Data is divided into 100 sec bins |
 |
 |
| Parameter | Plot |
|---|---|
| CZT HV Monitor | 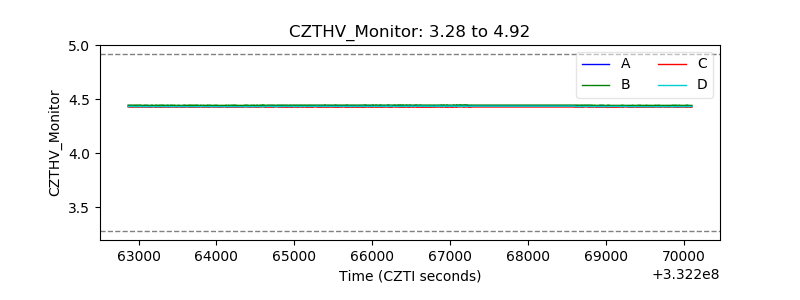 |
| D_VDD | 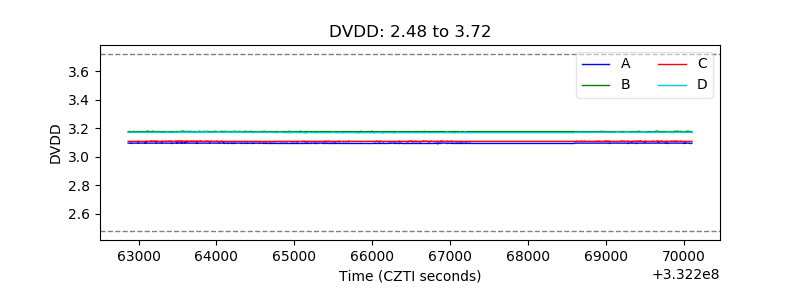 |
| Temperature 1 | 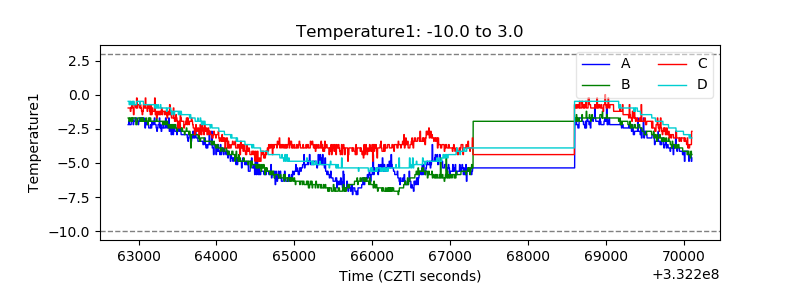 |
| Veto HV Monitor |  |
| Veto LLD | 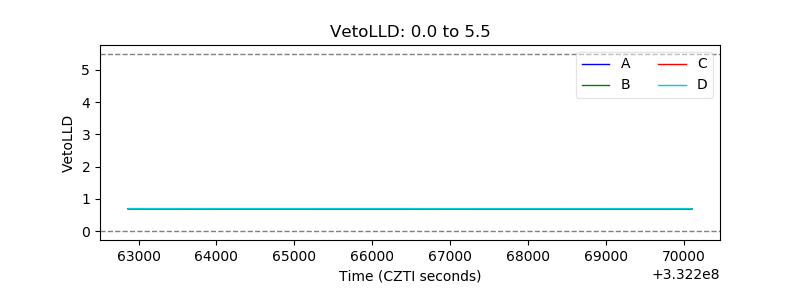 |
| Alpha Counter | 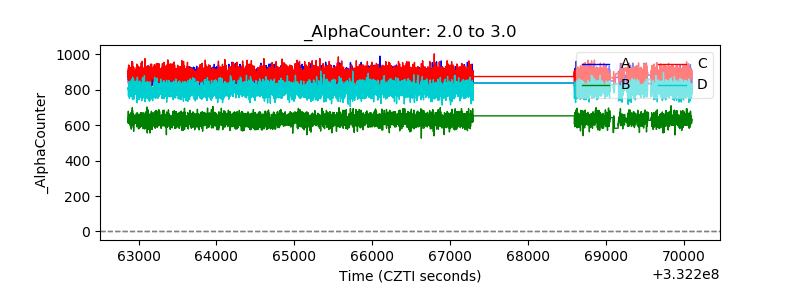 |
| _CPM_Rate | 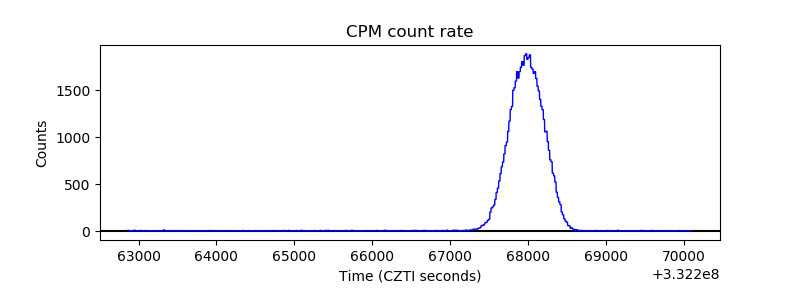 |
| CZT Counter | 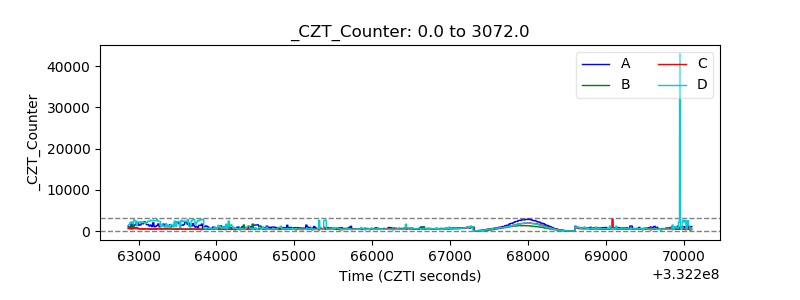 |
| +2.5 Volts monitor | 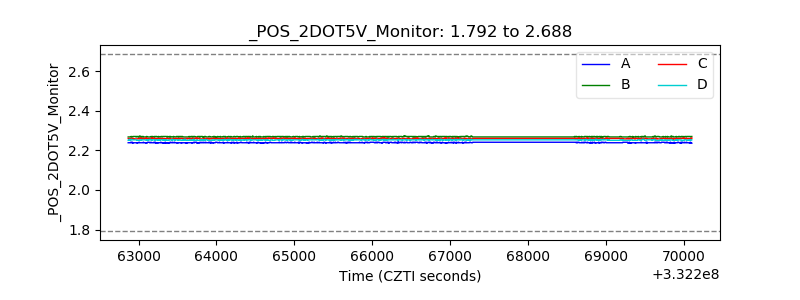 |
| +5 Volts monitor |  |
| _ROLL_ROT | 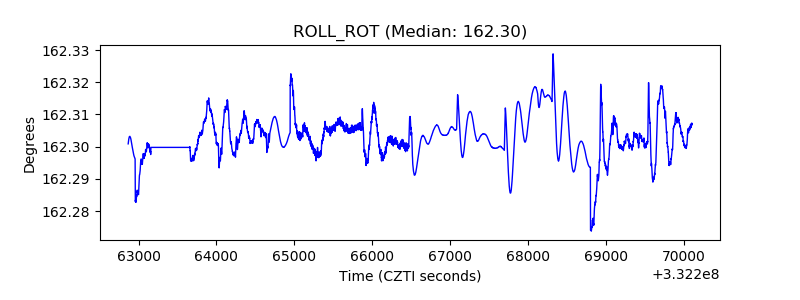 |
| _Roll_DEC | 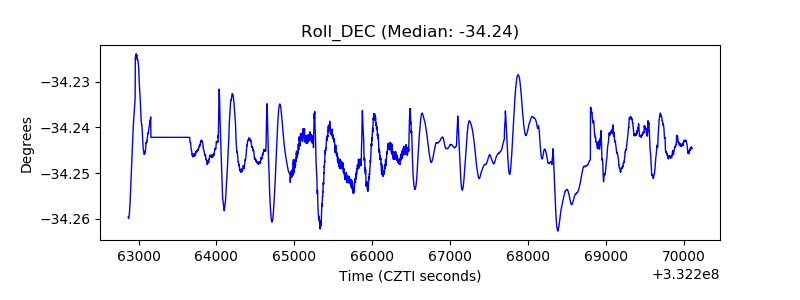 |
| _Roll_RA | 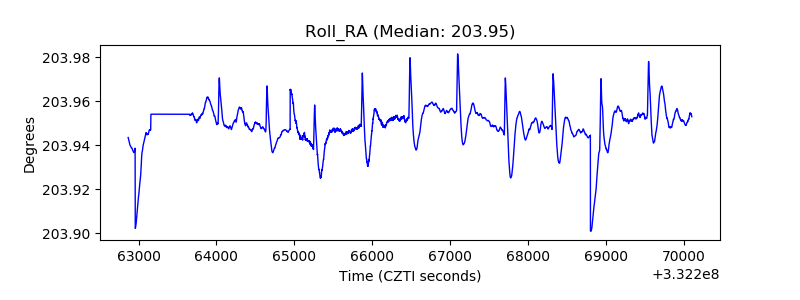 |
| Veto Counter | 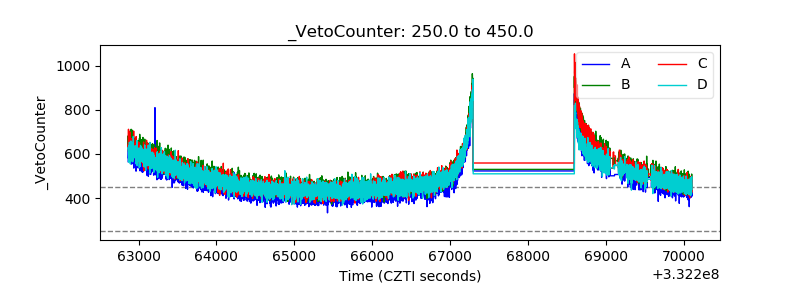 |