| Param | Original file | Final file |
|---|---|---|
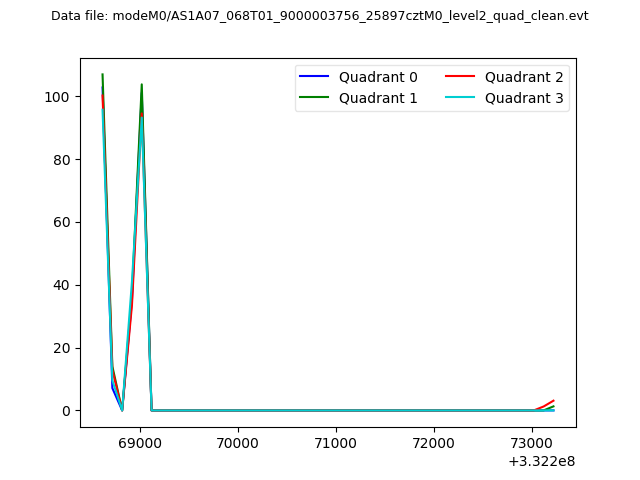
| Filename | modeM0/AS1A07_068T01_9000003756_25897cztM0_level2.evt | modeM0/AS1A07_068T01_9000003756_25897cztM0_level2_quad_clean.evt |
| Size (bytes) | 16,871,040 | 4,023,360 |
| Size | 16.1 MB | 3.8 MB |
| Events in quadrant A | 128,030 | 24,622 |
| Events in quadrant B | 110,084 | 26,308 |
| Events in quadrant C | 110,195 | 24,556 |
| Events in quadrant D | 145,823 | 23,954 |
| Mode M0 | |||
|---|---|---|---|
| Quadrant | BADHDUFLAG | Total packets | Discarded packets |
| A | 0 | 500 | 0 |
| B | 0 | 454 | 0 |
| C | 0 | 450 | 0 |
| D | 0 | 554 | 0 |
| Mode M9 | |||
|---|---|---|---|
| Quadrant | BADHDUFLAG | Total packets | Discarded packets |
| A | 0 | 1 | 0 |
| B | 0 | 1 | 0 |
| C | 0 | 1 | 0 |
| D | 0 | 1 | 0 |
| Quadrant | Total seconds | Saturated seconds | Saturation percentage |
|---|---|---|---|
| A | 171 | 2 | 1.169591% |
| B | 183 | 2 | 1.092896% |
| C | 191 | 3 | 1.570681% |
| D | 182 | 9 | 4.945055% |
Noise dominated data is calculated using 1-second bins in cleaned event files. If a bin has >2000 counts, and if more than 50% of those come from <1% of pixels, then it is considered to be noise-dominated and hence unusable.
| Quadrant | # 1 sec bins | Bins with >0 counts | Bins with >2000 counts | High rate bins dominated by noise | Noise dominated (total time) | Noise dominated (detector-on time) | Marked lightcurve |
|---|---|---|---|---|---|---|---|
| A | 4475 | 196 | 0 | 0 | 0.00% | 0.00% | 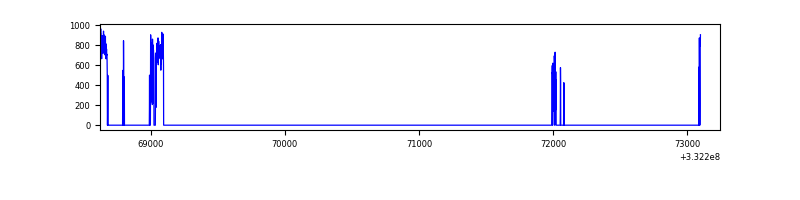 |
| B | 4607 | 211 | 0 | 0 | 0.00% | 0.00% | 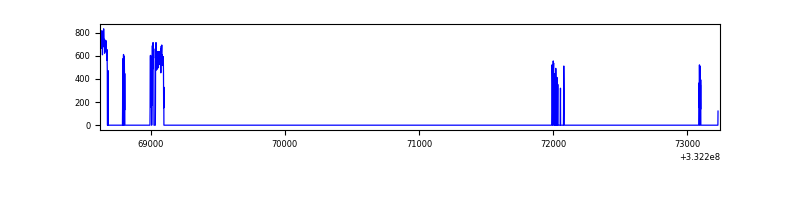 |
| C | 4620 | 223 | 0 | 0 | 0.00% | 0.00% | 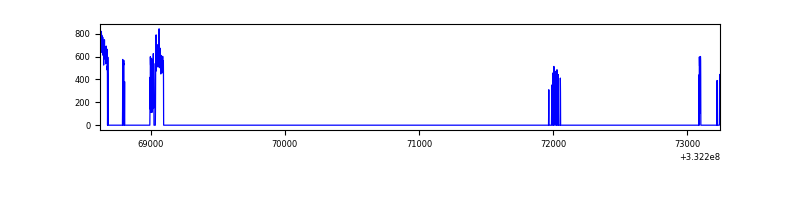 |
| D | 4483 | 214 | 2 | 2 | 0.04% | 0.93% | 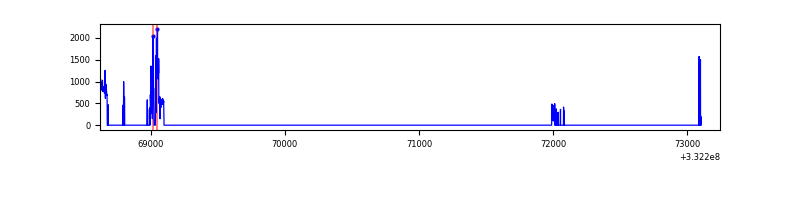 |
Top three noisy pixels from each quadrant. If the there are fewer than three noisy pixels in the level2.evt file, extra rows are filled as -1
| Pixel properties | Quadrant properties | ||||||
|---|---|---|---|---|---|---|---|
| Quadrant | DetID | PixID | Counts | Sigma | Mean | Median | Sigma |
| A | 0 | 13 | 26614 | 3660.2 | 26 | 25 | 7.3 |
| A | 13 | 254 | 293 | 36.89 | 26 | 25 | 7.3 |
| A | 3 | 137 | 247 | 30.56 | 26 | 25 | 7.3 |
| B | 0 | 190 | 1691 | 229.42 | 27 | 26 | 7.3 |
| B | 4 | 187 | 1098 | 147.71 | 27 | 26 | 7.3 |
| B | 12 | 111 | 591 | 77.85 | 27 | 26 | 7.3 |
| C | 14 | 238 | 4497 | 567.05 | 26 | 26 | 7.9 |
| C | 3 | 233 | 2412 | 302.61 | 26 | 26 | 7.9 |
| C | 13 | 61 | 194 | 21.31 | 26 | 26 | 7.9 |
| D | 1 | 52 | 46145 | 5800.87 | 25 | 25 | 8.0 |
| D | 3 | 238 | 1074 | 131.94 | 25 | 25 | 8.0 |
| D | 2 | 234 | 559 | 67.17 | 25 | 25 | 8.0 |
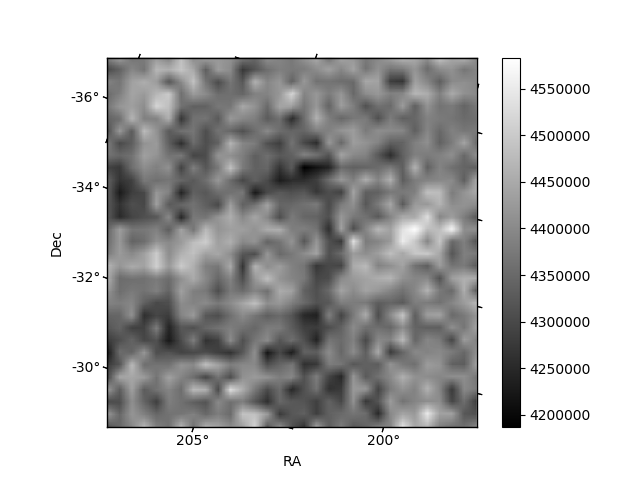
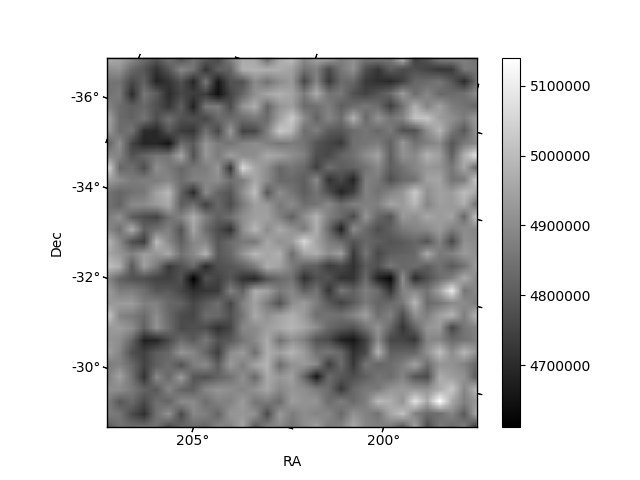
Histogram calculated using DETX and DETY for each event in the final _common_clean file
| Quadrant A | 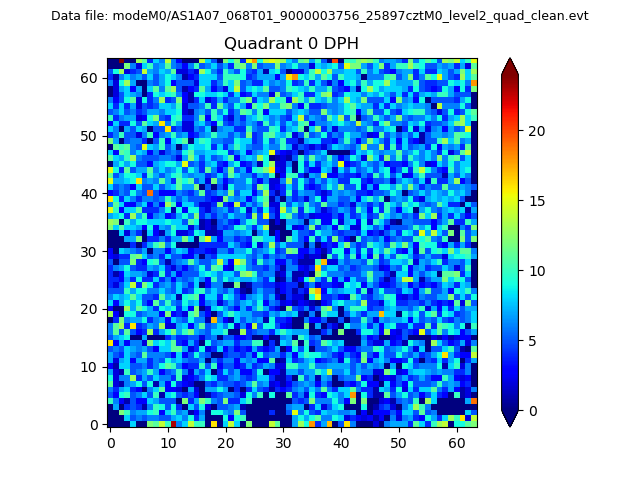 |
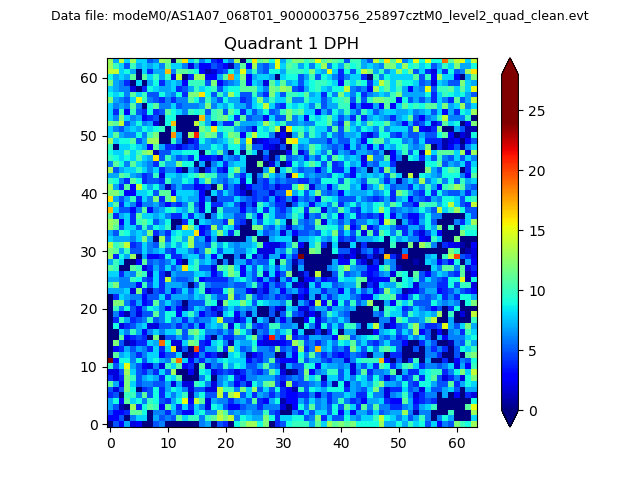 |
Quadrant B |
|---|---|---|---|
| Quadrant D |  |
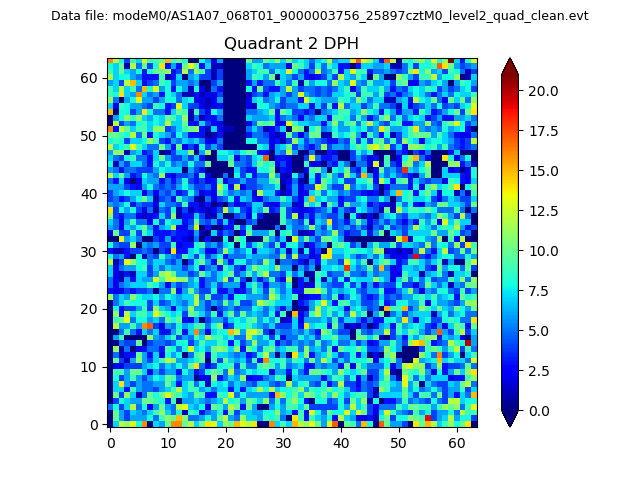 |
Quadrant C |
| Plot type | Count rate plots | Images |
|---|---|---|
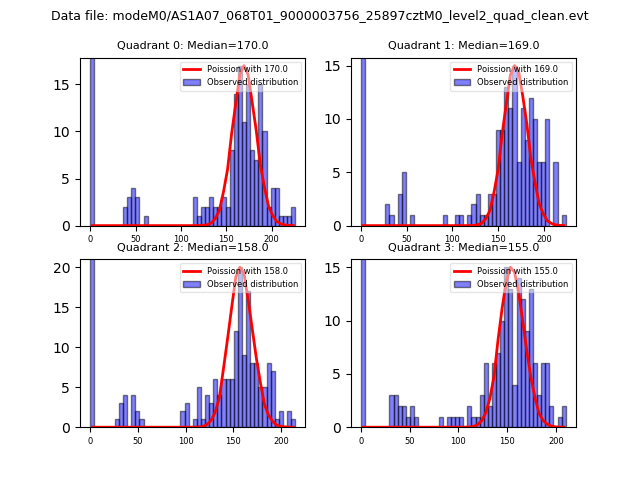
| Comparison with Poisson distribution Blue bars denote a histogram of data divided into 1 sec bins. Red curve is a Poisson curve with rate = median count rate of data. |
 |
 |
| Quadrant-wise count rates Data is divided into 100 sec bins |
 |
|
| Module-wise count rates for Quadrant A Data is divided into 100 sec bins |
 |
 |
| Module-wise count rates for Quadrant B Data is divided into 100 sec bins |
 |
 |
| Module-wise count rates for Quadrant C Data is divided into 100 sec bins |
 |
 |
| Module-wise count rates for Quadrant D Data is divided into 100 sec bins |
 |
 |
| Parameter | Plot |
|---|---|
| CZT HV Monitor |  |
| D_VDD | 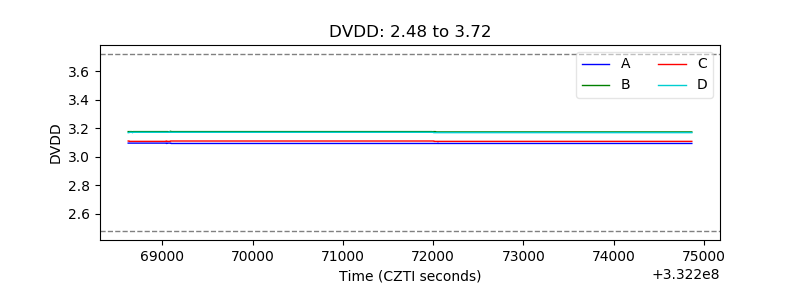 |
| Temperature 1 | 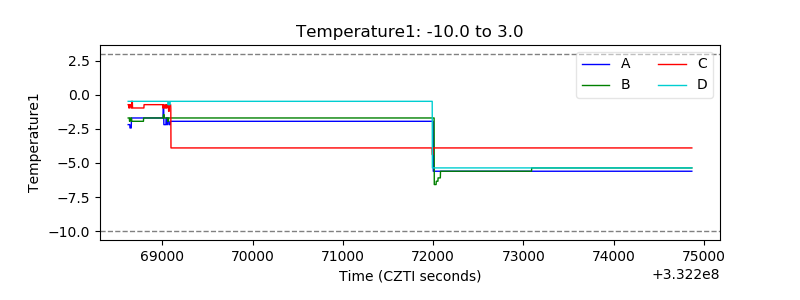 |
| Veto HV Monitor | 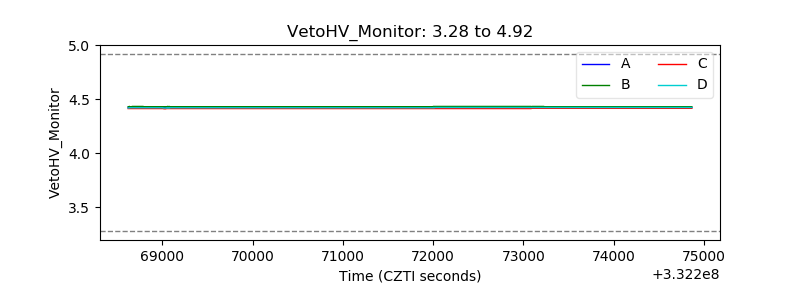 |
| Veto LLD | 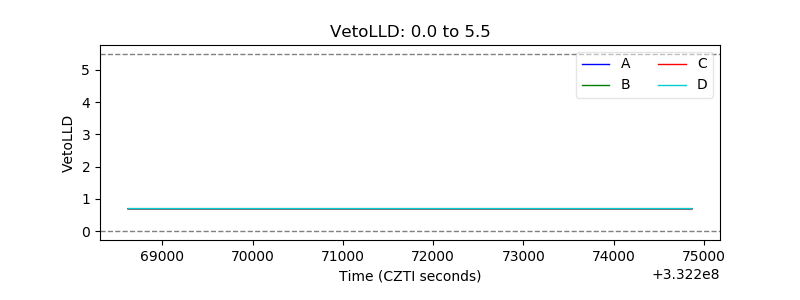 |
| Alpha Counter | 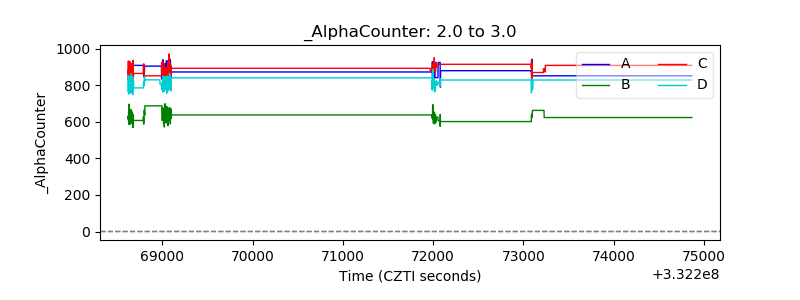 |
| _CPM_Rate | 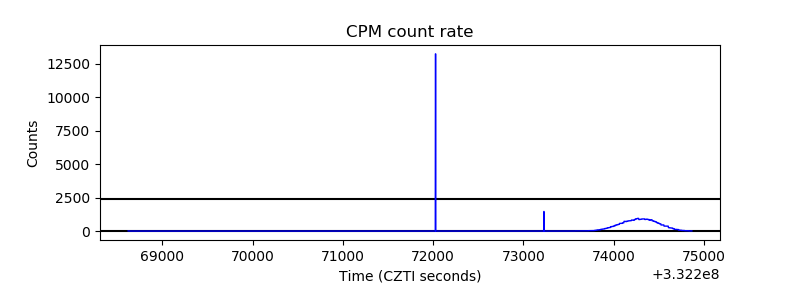 |
| CZT Counter | 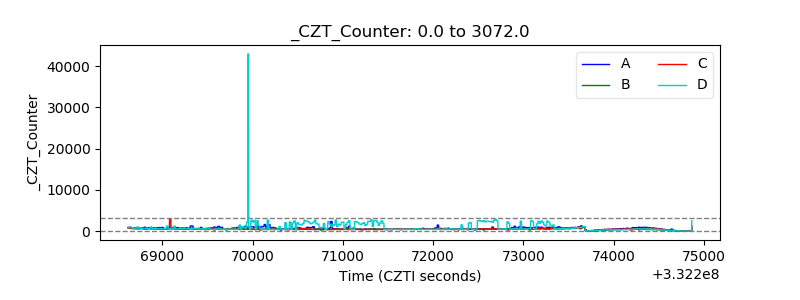 |
| +2.5 Volts monitor |  |
| +5 Volts monitor |  |
| _ROLL_ROT | 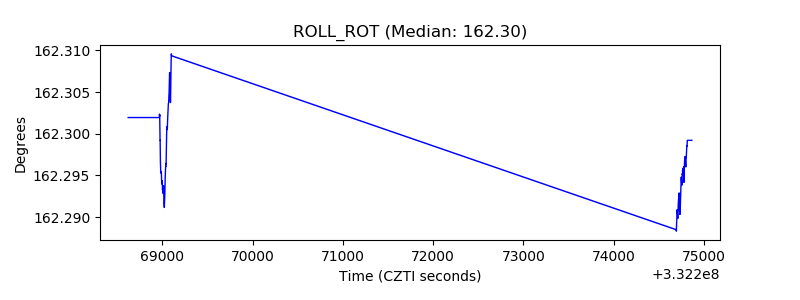 |
| _Roll_DEC | 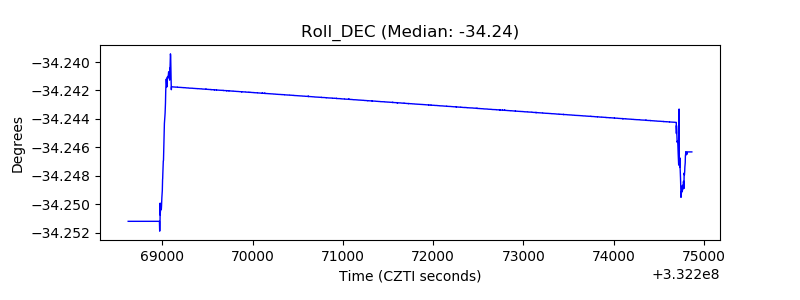 |
| _Roll_RA | 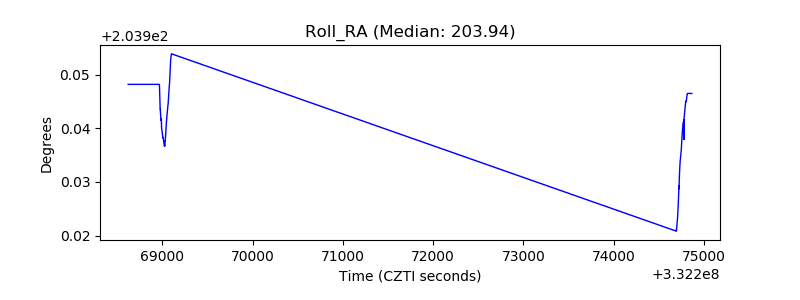 |
| Veto Counter | 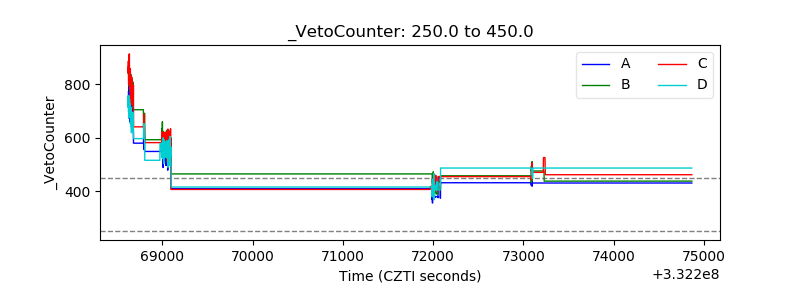 |