| Param | Original file | Final file |
|---|---|---|
| Filename | modeM0/AS1A07_068T01_9000003756_25898cztM0_level2.evt | modeM0/AS1A07_068T01_9000003756_25898cztM0_level2_quad_clean.evt |
| Size (bytes) | 1,348,945,920 | 204,134,400 |
| Size | 1.3 GB | 194.7 MB |
| Events in quadrant A | 11,261,293 | 1,310,711 |
| Events in quadrant B | 8,285,250 | 1,342,480 |
| Events in quadrant C | 7,694,260 | 1,256,917 |
| Events in quadrant D | 12,563,888 | 1,199,535 |
| Mode M0 | |||
|---|---|---|---|
| Quadrant | BADHDUFLAG | Total packets | Discarded packets |
| A | 0 | 44116 | 0 |
| B | 0 | 34188 | 0 |
| C | 0 | 32902 | 0 |
| D | 0 | 48045 | 0 |
| Mode M9 | |||
|---|---|---|---|
| Quadrant | BADHDUFLAG | Total packets | Discarded packets |
| A | 0 | 34 | 0 |
| B | 0 | 34 | 0 |
| C | 0 | 34 | 0 |
| D | 0 | 34 | 0 |
| Quadrant | Total seconds | Saturated seconds | Saturation percentage |
|---|---|---|---|
| A | 15540 | 472 | 3.037323% |
| B | 15541 | 204 | 1.312657% |
| C | 15542 | 236 | 1.518466% |
| D | 15542 | 1662 | 10.693604% |
Noise dominated data is calculated using 1-second bins in cleaned event files. If a bin has >2000 counts, and if more than 50% of those come from <1% of pixels, then it is considered to be noise-dominated and hence unusable.
| Quadrant | # 1 sec bins | Bins with >0 counts | Bins with >2000 counts | High rate bins dominated by noise | Noise dominated (total time) | Noise dominated (detector-on time) | Marked lightcurve |
|---|---|---|---|---|---|---|---|
| A | 18941 | 15544 | 150 | 150 | 0.79% | 0.97% | 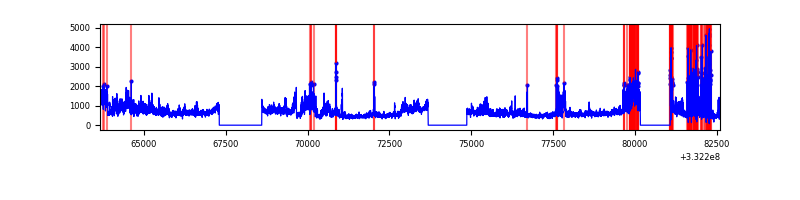 |
| B | 18941 | 15544 | 4 | 4 | 0.02% | 0.03% | 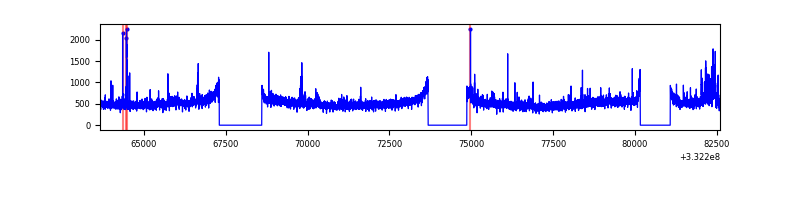 |
| C | 18942 | 15545 | 1 | 1 | 0.01% | 0.01% | 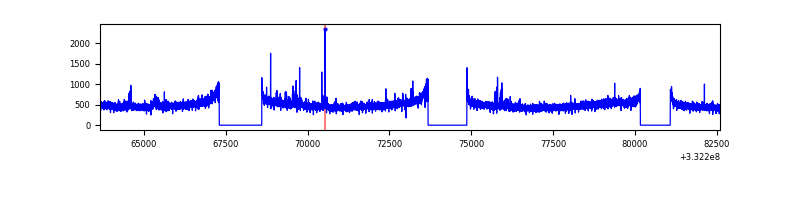 |
| D | 18942 | 15545 | 1269 | 1269 | 6.70% | 8.16% | 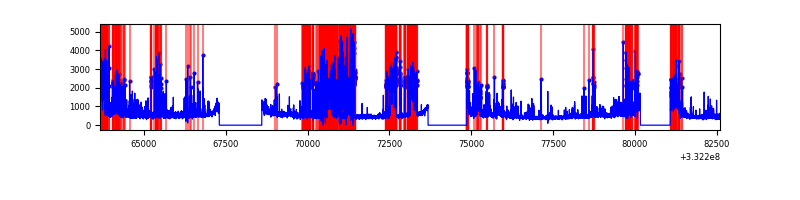 |
Top three noisy pixels from each quadrant. If the there are fewer than three noisy pixels in the level2.evt file, extra rows are filled as -1
| Pixel properties | Quadrant properties | ||||||
|---|---|---|---|---|---|---|---|
| Quadrant | DetID | PixID | Counts | Sigma | Mean | Median | Sigma |
| A | 0 | 13 | 3691537 | 9466.13 | 1961 | 1927 | 389.8 |
| A | 13 | 254 | 25776 | 61.19 | 1961 | 1927 | 389.8 |
| A | 3 | 137 | 17927 | 41.05 | 1961 | 1927 | 389.8 |
| B | 10 | 245 | 377311 | 1018.38 | 1951 | 1906 | 368.6 |
| B | 0 | 219 | 179054 | 480.56 | 1951 | 1906 | 368.6 |
| B | 12 | 111 | 44712 | 116.12 | 1951 | 1906 | 368.6 |
| C | 14 | 238 | 301839 | 696.13 | 1855 | 1867 | 430.9 |
| C | 3 | 233 | 160081 | 367.16 | 1855 | 1867 | 430.9 |
| C | 13 | 61 | 12675 | 25.08 | 1855 | 1867 | 430.9 |
| D | 1 | 52 | 5272835 | 12278.72 | 1802 | 1762 | 429.3 |
| D | 5 | 223 | 372303 | 863.16 | 1802 | 1762 | 429.3 |
| D | 2 | 234 | 62256 | 140.92 | 1802 | 1762 | 429.3 |
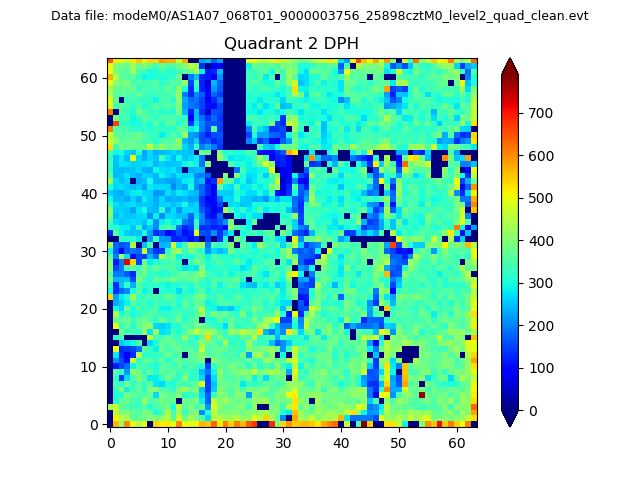
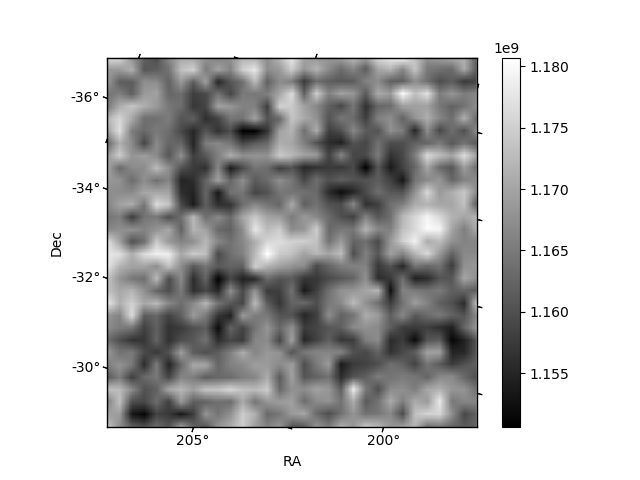
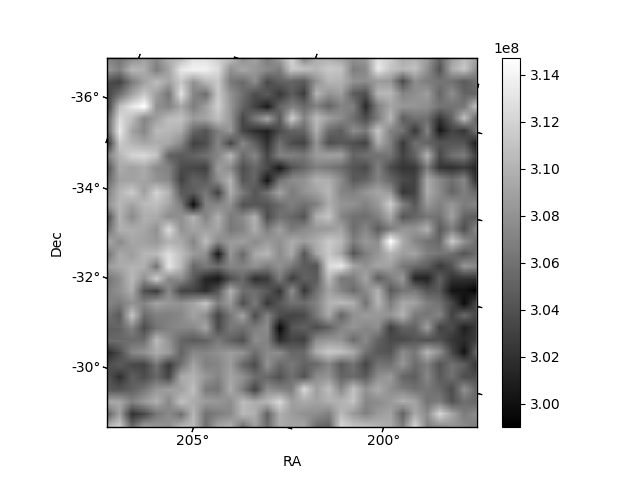
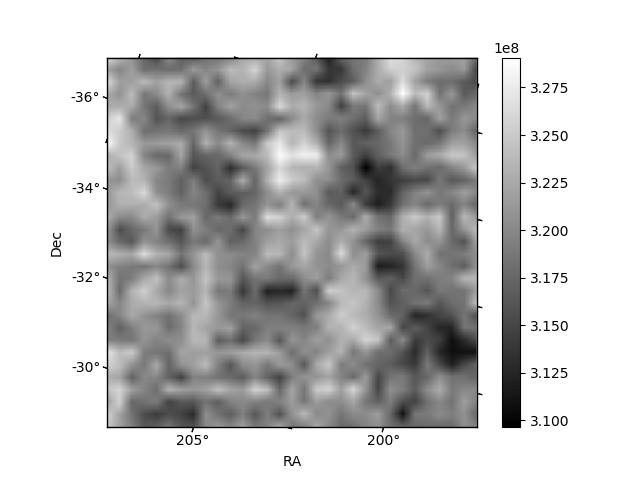
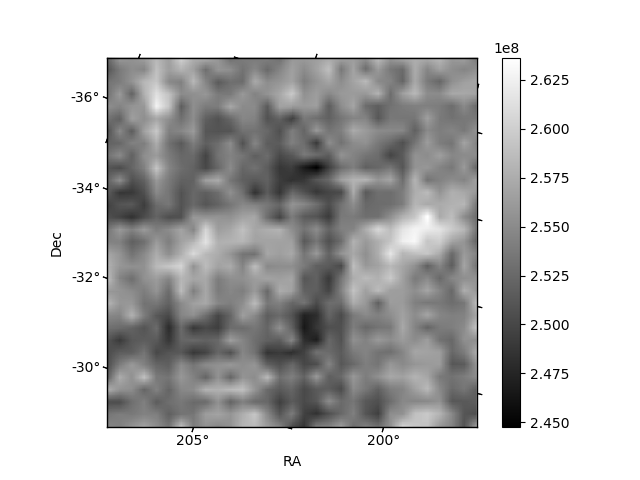
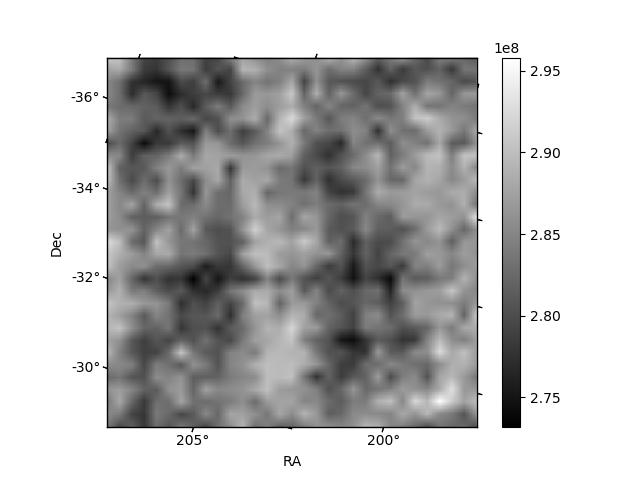
Histogram calculated using DETX and DETY for each event in the final _common_clean file
| Quadrant A | 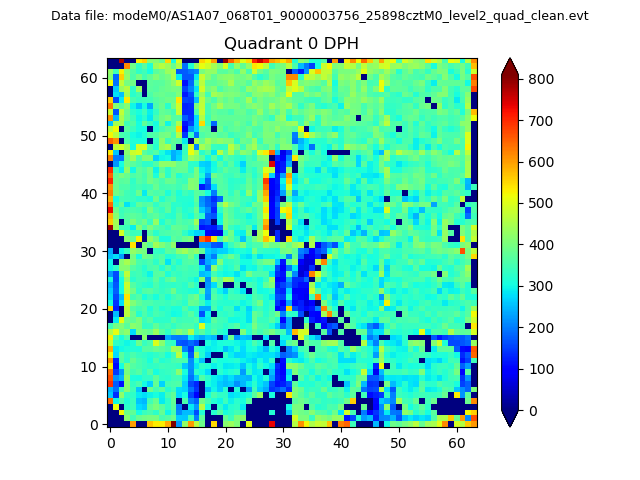 |
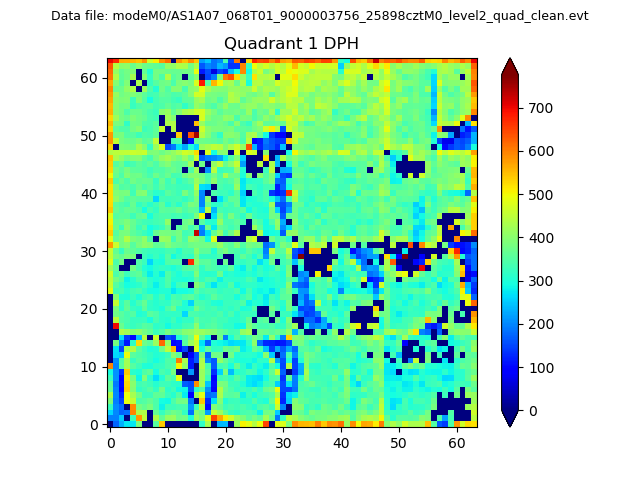 |
Quadrant B |
|---|---|---|---|
| Quadrant D | 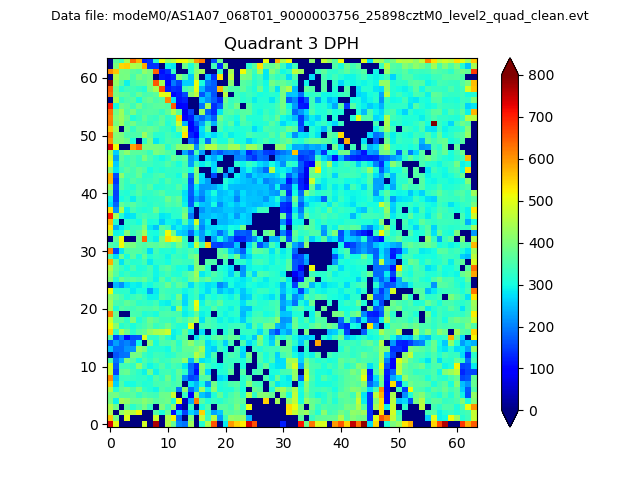 |
 |
Quadrant C |
| Plot type | Count rate plots | Images |
|---|---|---|
| Comparison with Poisson distribution Blue bars denote a histogram of data divided into 1 sec bins. Red curve is a Poisson curve with rate = median count rate of data. |
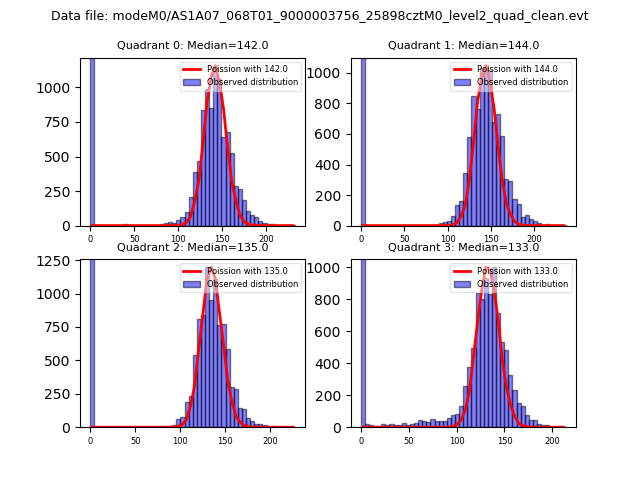 |
 |
| Quadrant-wise count rates Data is divided into 100 sec bins |
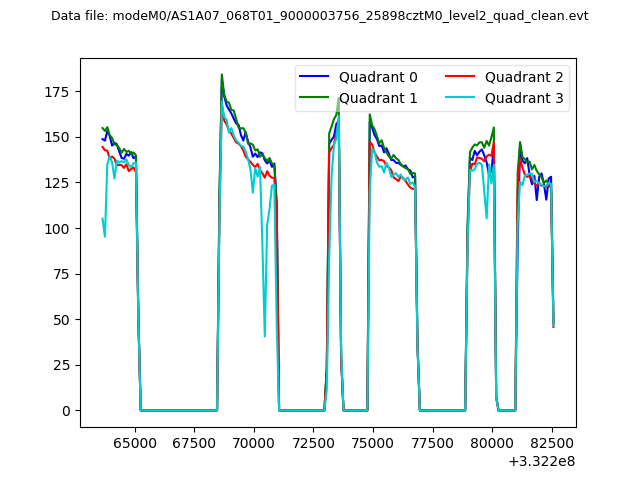 |
|
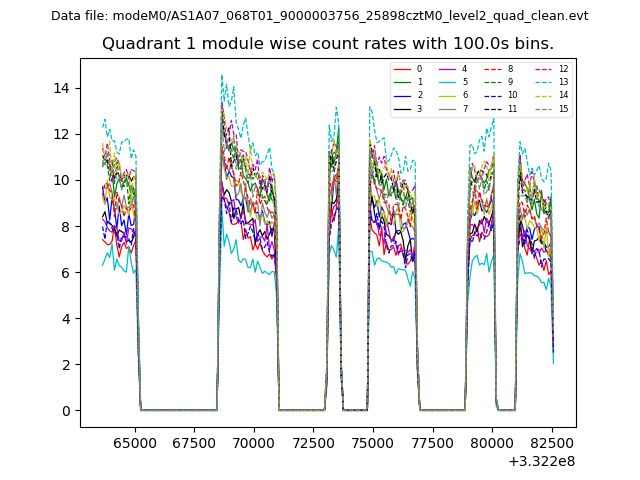
| Module-wise count rates for Quadrant A Data is divided into 100 sec bins |
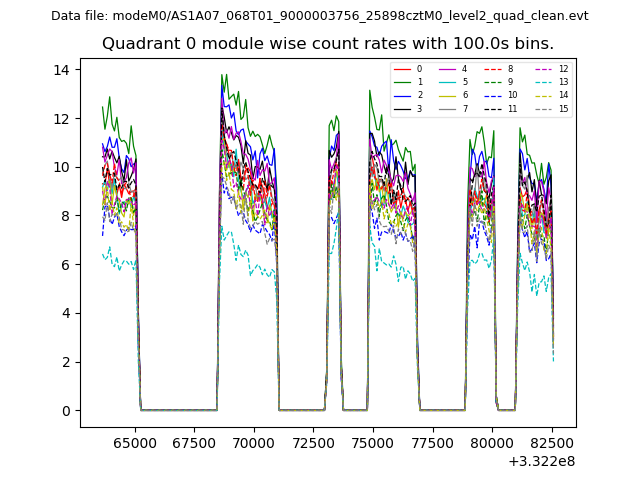 |
 |
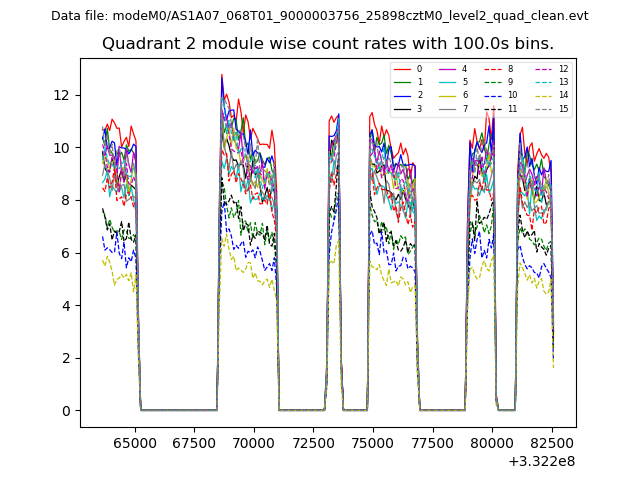
| Module-wise count rates for Quadrant B Data is divided into 100 sec bins |
 |
 |
| Module-wise count rates for Quadrant C Data is divided into 100 sec bins |
 |
 |
| Module-wise count rates for Quadrant D Data is divided into 100 sec bins |
 |
 |
| Parameter | Plot |
|---|---|
| CZT HV Monitor | 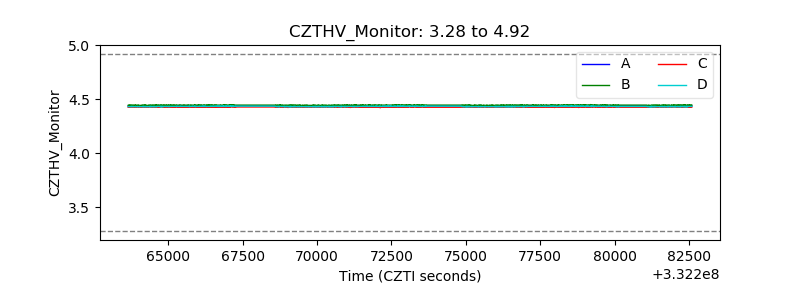 |
| D_VDD | 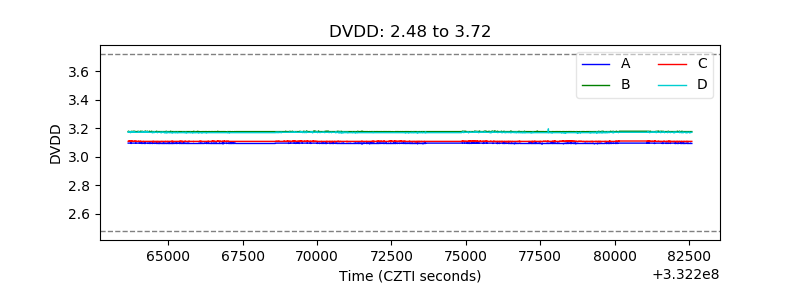 |
| Temperature 1 | 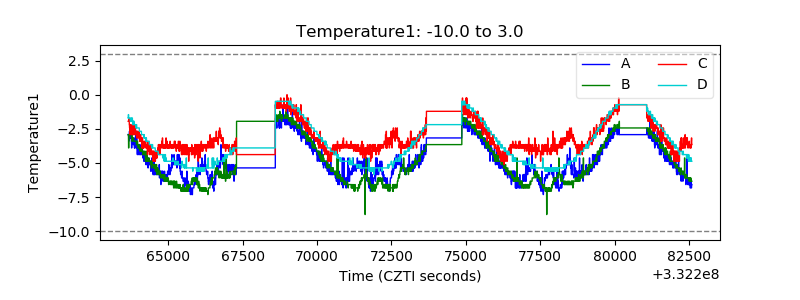 |
| Veto HV Monitor | 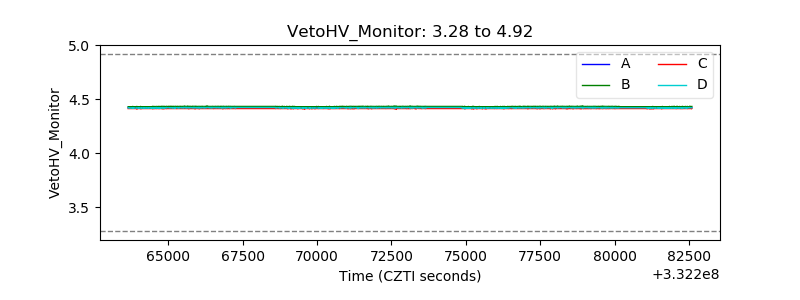 |
| Veto LLD |  |
| Alpha Counter | 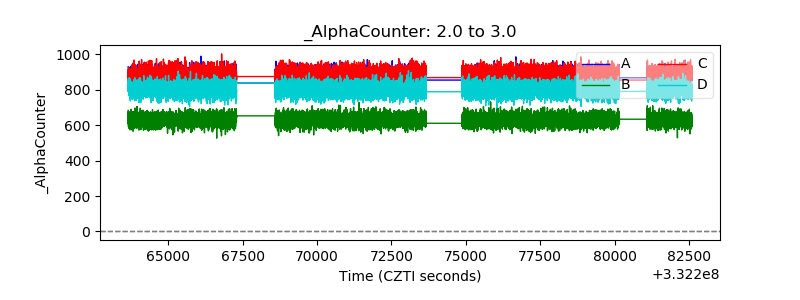 |
| _CPM_Rate |  |
| CZT Counter | 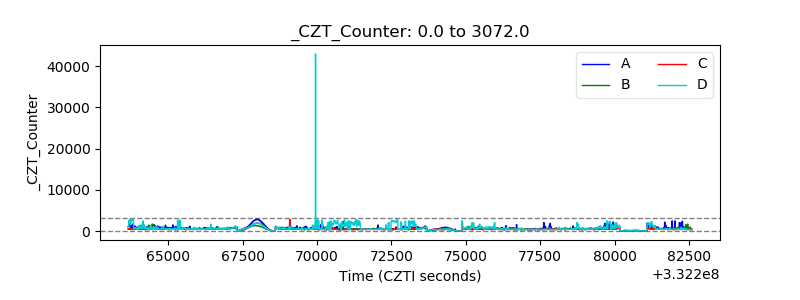 |
| +2.5 Volts monitor |  |
| +5 Volts monitor |  |
| _ROLL_ROT |  |
| _Roll_DEC | 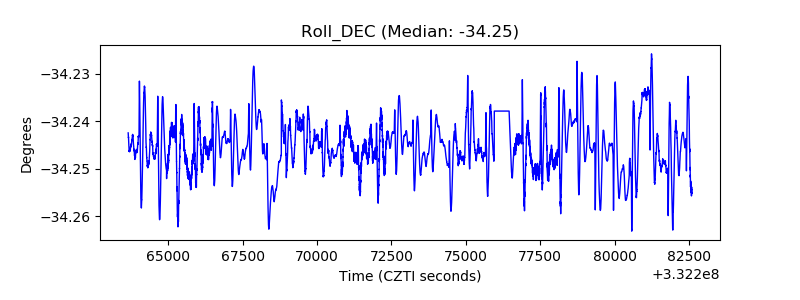 |
| _Roll_RA | 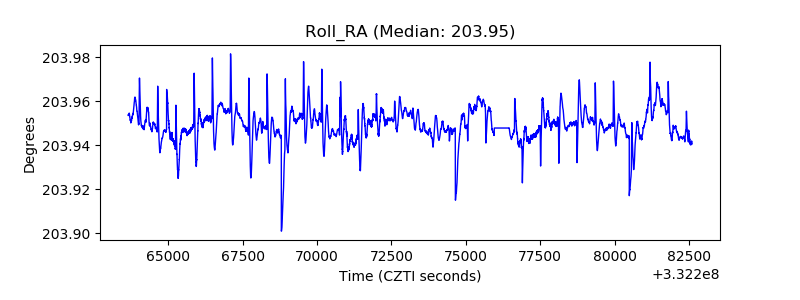 |
| Veto Counter |  |