| Param | Original file | Final file |
|---|---|---|
| Filename | modeM0/AS1A07_068T01_9000003756_25903cztM0_level2.evt | modeM0/AS1A07_068T01_9000003756_25903cztM0_level2_quad_clean.evt |
| Size (bytes) | 394,571,520 | 56,482,560 |
| Size | 376.3 MB | 53.9 MB |
| Events in quadrant A | 4,757,831 | 309,518 |
| Events in quadrant B | 2,298,683 | 363,276 |
| Events in quadrant C | 2,283,475 | 346,358 |
| Events in quadrant D | 2,276,888 | 347,552 |
| Mode M0 | |||
|---|---|---|---|
| Quadrant | BADHDUFLAG | Total packets | Discarded packets |
| A | 0 | 17519 | 0 |
| B | 0 | 10056 | 0 |
| C | 0 | 10039 | 0 |
| D | 0 | 10277 | 0 |
| Mode M9 | |||
|---|---|---|---|
| Quadrant | BADHDUFLAG | Total packets | Discarded packets |
| A | 0 | 5 | 0 |
| B | 0 | 5 | 0 |
| C | 0 | 5 | 0 |
| D | 0 | 5 | 0 |
| Quadrant | Total seconds | Saturated seconds | Saturation percentage |
|---|---|---|---|
| A | 4893 | 771 | 15.757204% |
| B | 4894 | 46 | 0.939926% |
| C | 4894 | 68 | 1.389456% |
| D | 4894 | 30 | 0.612996% |
Noise dominated data is calculated using 1-second bins in cleaned event files. If a bin has >2000 counts, and if more than 50% of those come from <1% of pixels, then it is considered to be noise-dominated and hence unusable.
| Quadrant | # 1 sec bins | Bins with >0 counts | Bins with >2000 counts | High rate bins dominated by noise | Noise dominated (total time) | Noise dominated (detector-on time) | Marked lightcurve |
|---|---|---|---|---|---|---|---|
| A | 5328 | 4894 | 651 | 651 | 12.22% | 13.30% | 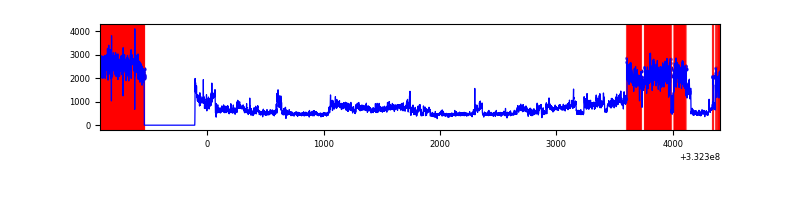 |
| B | 5329 | 4895 | 2 | 2 | 0.04% | 0.04% | 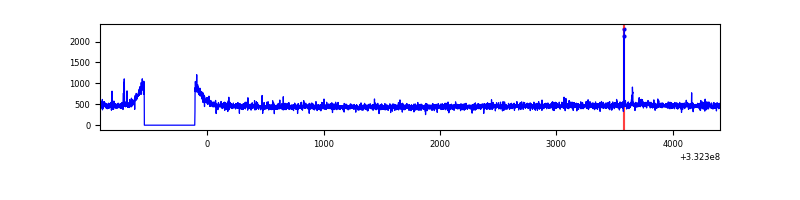 |
| C | 5329 | 4895 | 0 | 0 | 0.00% | 0.00% | 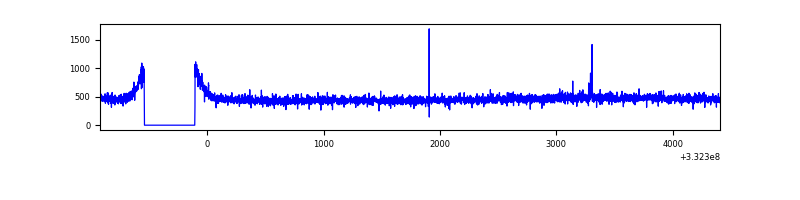 |
| D | 5329 | 4895 | 14 | 14 | 0.26% | 0.29% | 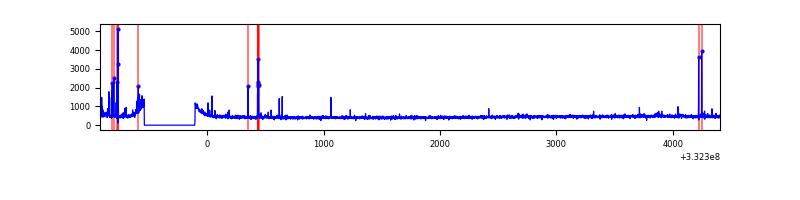 |
Top three noisy pixels from each quadrant. If the there are fewer than three noisy pixels in the level2.evt file, extra rows are filled as -1
| Pixel properties | Quadrant properties | ||||||
|---|---|---|---|---|---|---|---|
| Quadrant | DetID | PixID | Counts | Sigma | Mean | Median | Sigma |
| A | 0 | 13 | 2655764 | 23990.16 | 544 | 533 | 110.7 |
| A | 13 | 254 | 6095 | 50.25 | 544 | 533 | 110.7 |
| A | 3 | 137 | 5179 | 41.98 | 544 | 533 | 110.7 |
| B | 12 | 111 | 14044 | 119.51 | 580 | 565 | 112.8 |
| B | 11 | 111 | 12841 | 108.85 | 580 | 565 | 112.8 |
| B | 14 | 111 | 11616 | 97.98 | 580 | 565 | 112.8 |
| C | 14 | 238 | 89013 | 662.23 | 558 | 560 | 133.6 |
| C | 3 | 233 | 22245 | 162.35 | 558 | 560 | 133.6 |
| C | 13 | 61 | 3926 | 25.2 | 558 | 560 | 133.6 |
| D | 1 | 52 | 86838 | 629.88 | 566 | 550 | 137.0 |
| D | 2 | 234 | 21567 | 153.42 | 566 | 550 | 137.0 |
| D | 7 | 238 | 17403 | 123.02 | 566 | 550 | 137.0 |
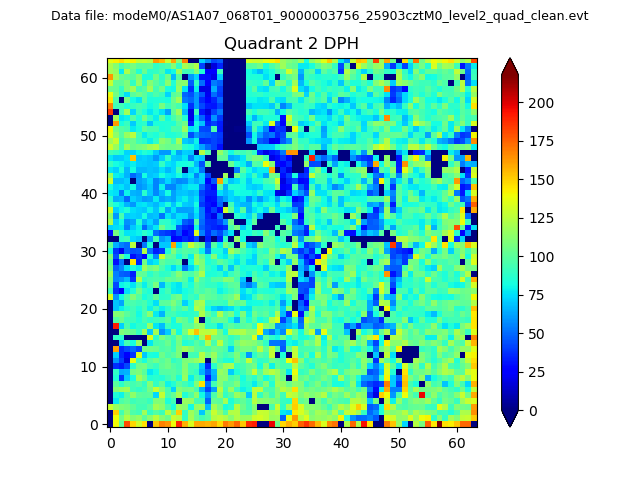
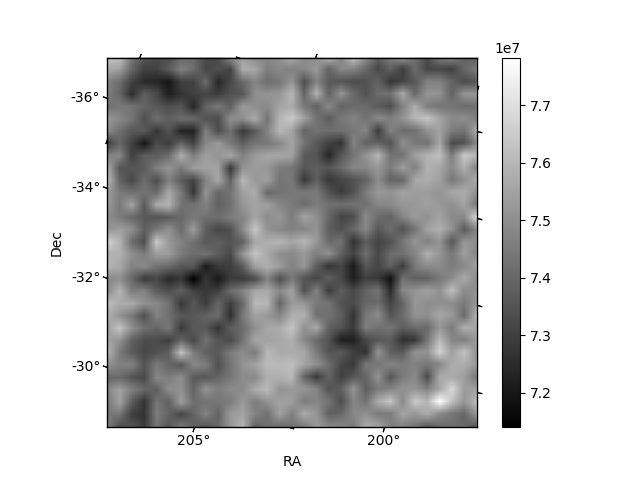
Histogram calculated using DETX and DETY for each event in the final _common_clean file
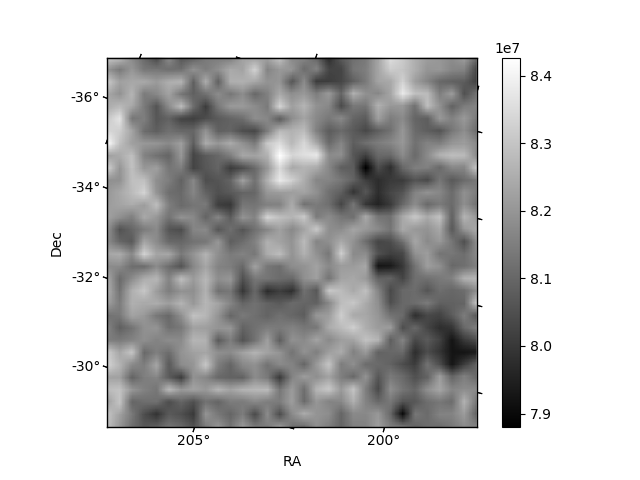
| Quadrant A | 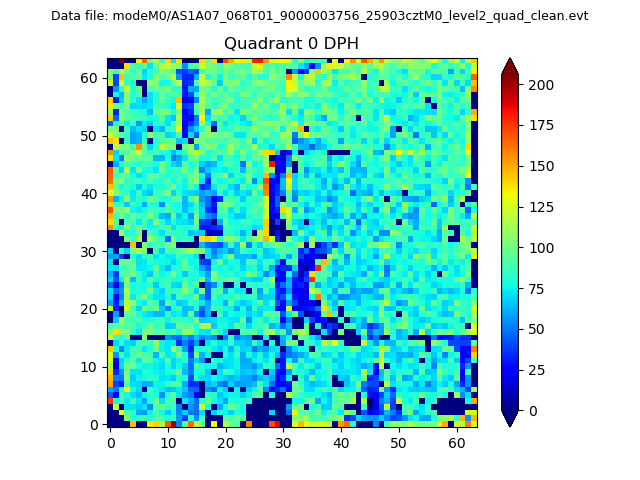 |
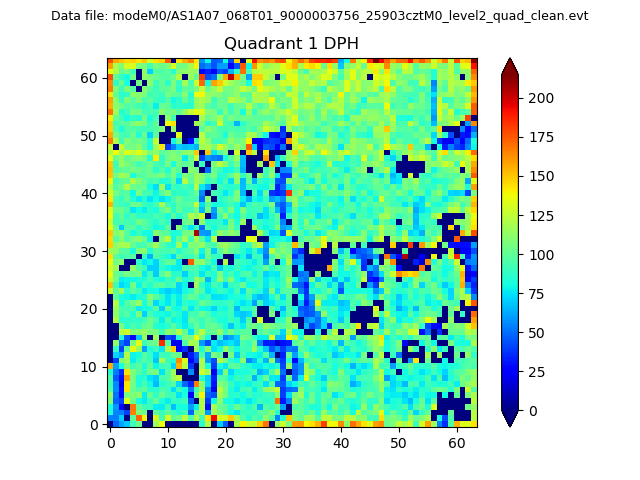 |
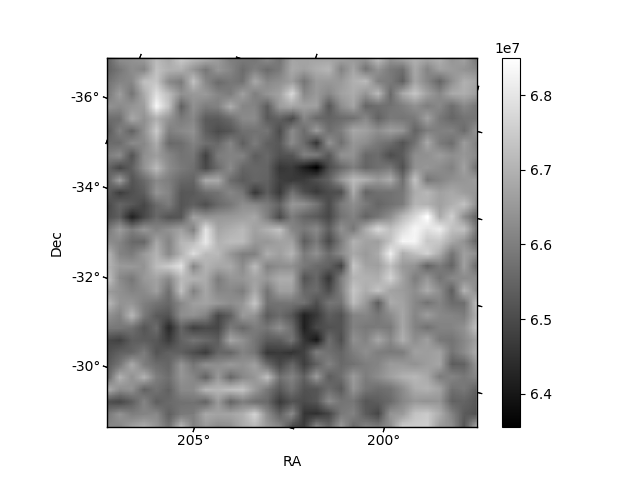
Quadrant B |
|---|---|---|---|
| Quadrant D | 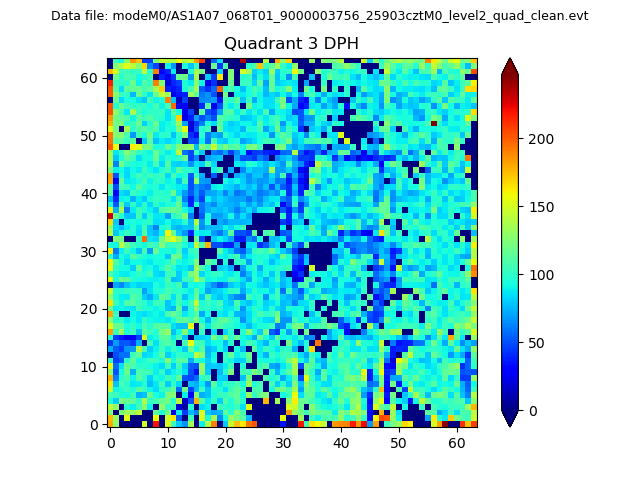 |
 |
Quadrant C |
| Plot type | Count rate plots | Images |
|---|---|---|
| Comparison with Poisson distribution Blue bars denote a histogram of data divided into 1 sec bins. Red curve is a Poisson curve with rate = median count rate of data. |
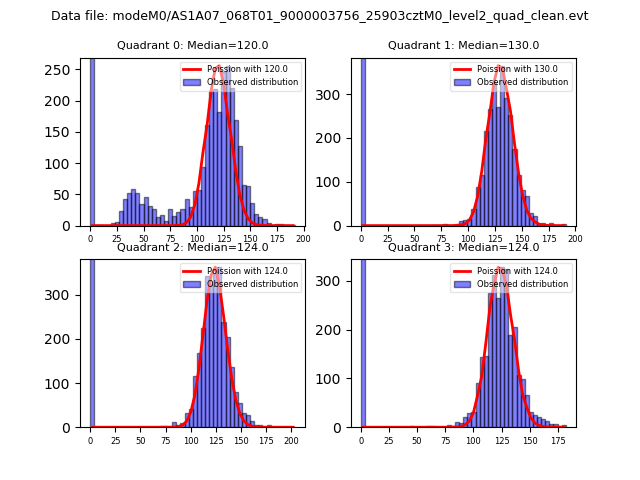 |
 |
| Quadrant-wise count rates Data is divided into 100 sec bins |
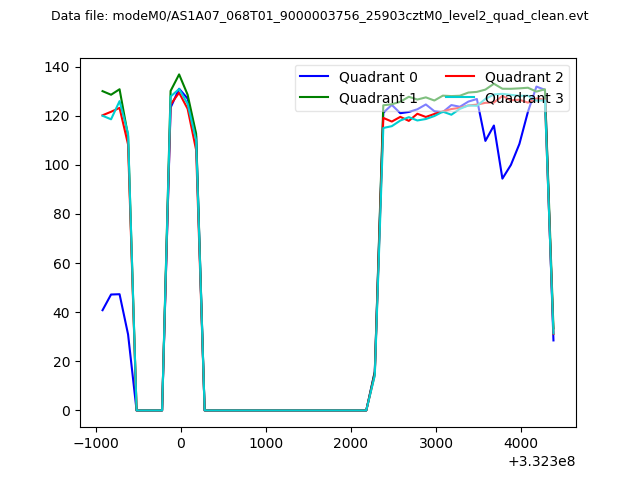 |
|
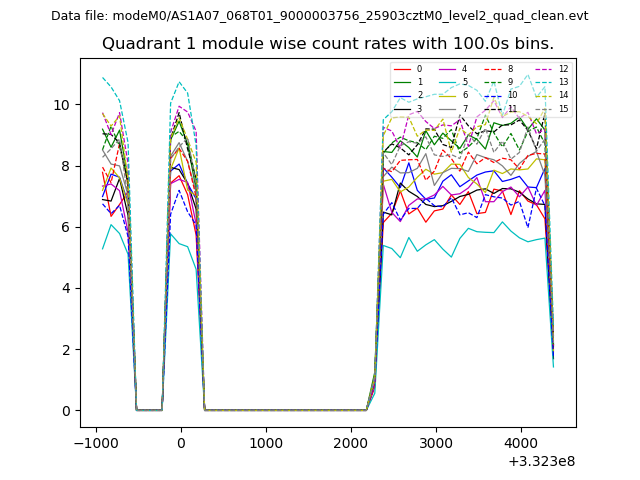
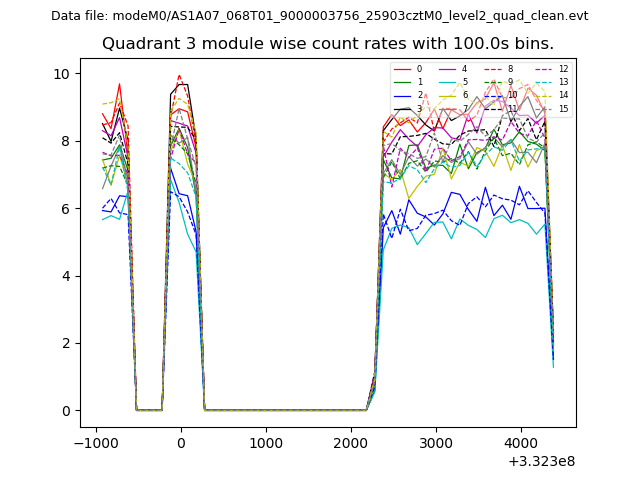
| Module-wise count rates for Quadrant A Data is divided into 100 sec bins |
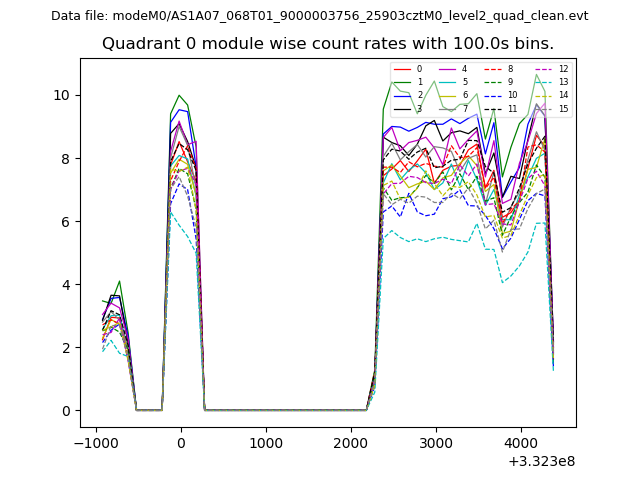 |
 |
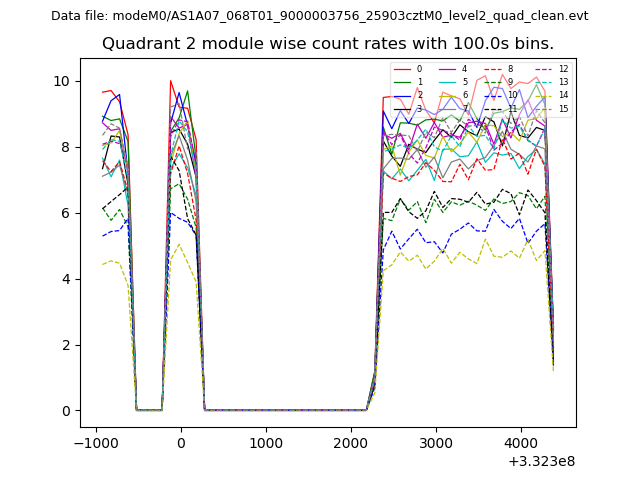
| Module-wise count rates for Quadrant B Data is divided into 100 sec bins |
 |
 |
| Module-wise count rates for Quadrant C Data is divided into 100 sec bins |
 |
 |
| Module-wise count rates for Quadrant D Data is divided into 100 sec bins |
 |
 |
| Parameter | Plot |
|---|---|
| CZT HV Monitor | 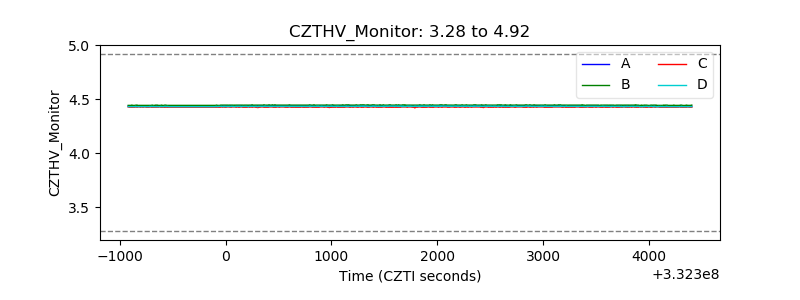 |
| D_VDD | 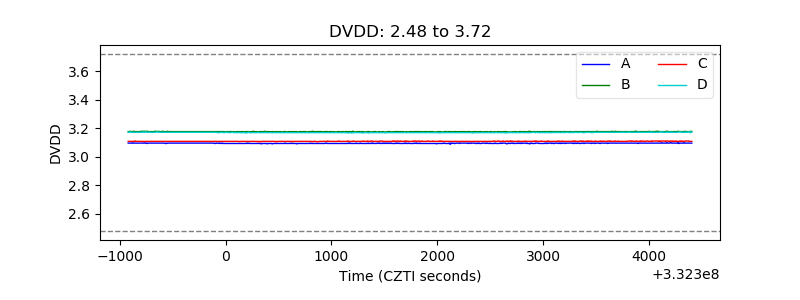 |
| Temperature 1 | 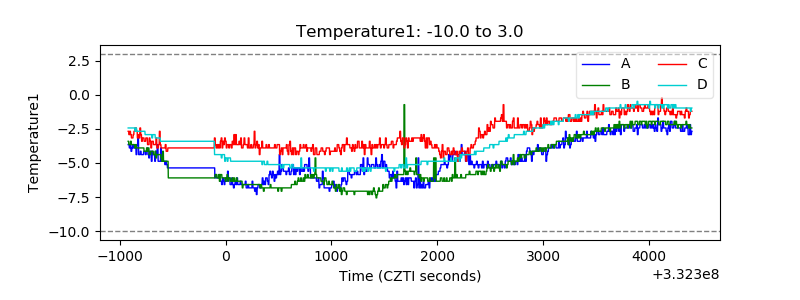 |
| Veto HV Monitor | 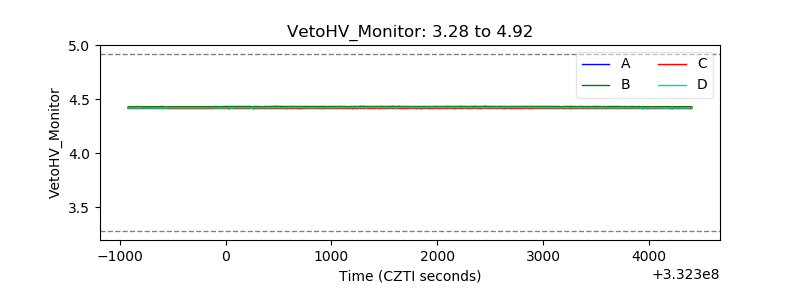 |
| Veto LLD | 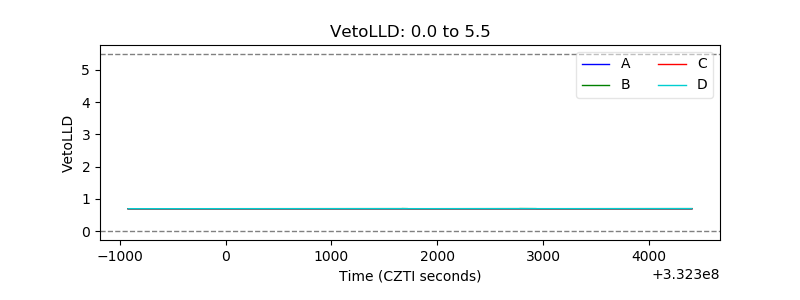 |
| Alpha Counter |  |
| _CPM_Rate | 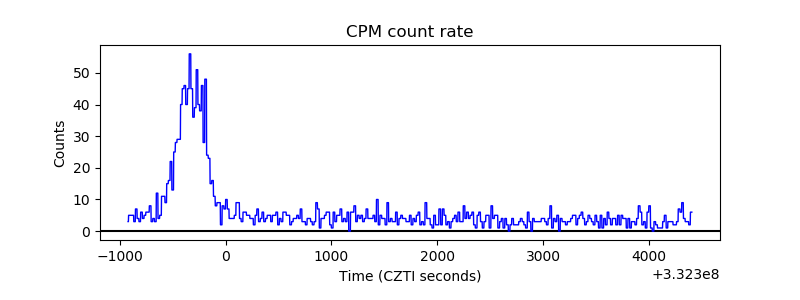 |
| CZT Counter |  |
| +2.5 Volts monitor |  |
| +5 Volts monitor |  |
| _ROLL_ROT | 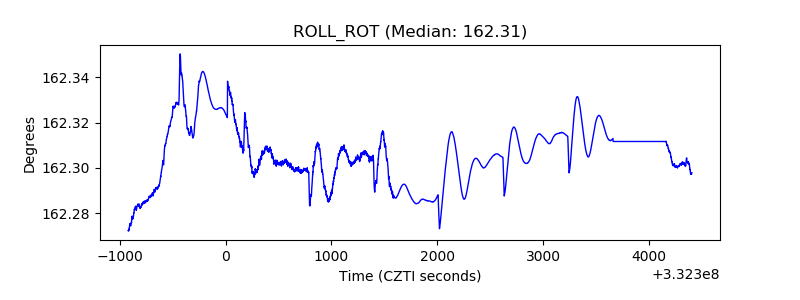 |
| _Roll_DEC | 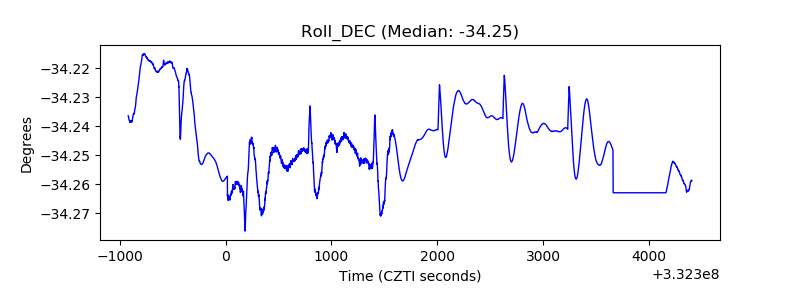 |
| _Roll_RA |  |
| Veto Counter | 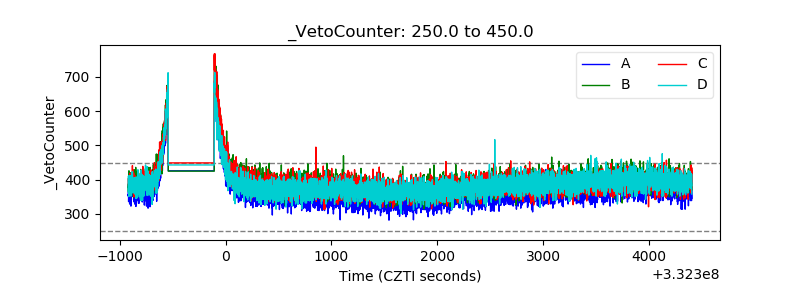 |