| Param | Original file | Final file |
|---|---|---|
| Filename | modeM0/AS1A07_068T01_9000003756_25904cztM0_level2.evt | modeM0/AS1A07_068T01_9000003756_25904cztM0_level2_quad_clean.evt |
| Size (bytes) | 1,282,723,200 | 181,696,320 |
| Size | 1.2 GB | 173.3 MB |
| Events in quadrant A | 14,813,552 | 1,110,892 |
| Events in quadrant B | 6,960,173 | 1,183,803 |
| Events in quadrant C | 6,663,599 | 1,130,744 |
| Events in quadrant D | 9,469,827 | 1,113,174 |
| Mode M0 | |||
|---|---|---|---|
| Quadrant | BADHDUFLAG | Total packets | Discarded packets |
| A | 0 | 53546 | 0 |
| B | 0 | 29385 | 0 |
| C | 0 | 28509 | 0 |
| D | 0 | 37473 | 0 |
| Mode M9 | |||
|---|---|---|---|
| Quadrant | BADHDUFLAG | Total packets | Discarded packets |
| A | 0 | 22 | 0 |
| B | 0 | 22 | 0 |
| C | 0 | 22 | 0 |
| D | 0 | 22 | 0 |
| Quadrant | Total seconds | Saturated seconds | Saturation percentage |
|---|---|---|---|
| A | 13954 | 1363 | 9.767809% |
| B | 13955 | 188 | 1.347187% |
| C | 13955 | 174 | 1.246865% |
| D | 13955 | 623 | 4.464350% |
Noise dominated data is calculated using 1-second bins in cleaned event files. If a bin has >2000 counts, and if more than 50% of those come from <1% of pixels, then it is considered to be noise-dominated and hence unusable.
| Quadrant | # 1 sec bins | Bins with >0 counts | Bins with >2000 counts | High rate bins dominated by noise | Noise dominated (total time) | Noise dominated (detector-on time) | Marked lightcurve |
|---|---|---|---|---|---|---|---|
| A | 16144 | 13956 | 846 | 846 | 5.24% | 6.06% | 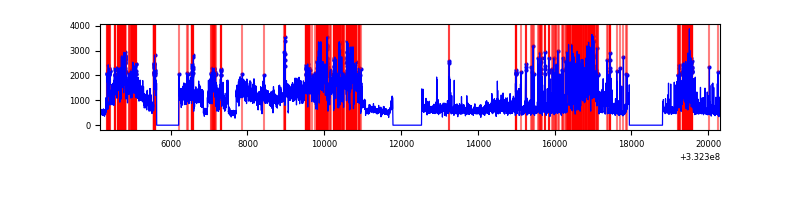 |
| B | 16145 | 13958 | 55 | 55 | 0.34% | 0.39% | 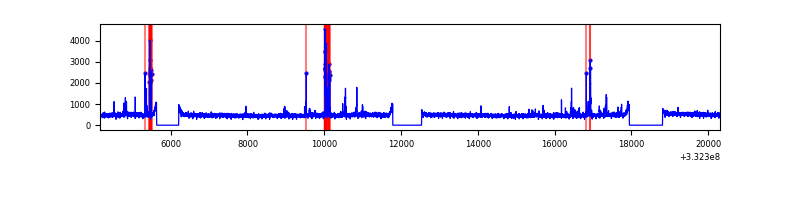 |
| C | 16145 | 13958 | 0 | 0 | 0.00% | 0.00% | 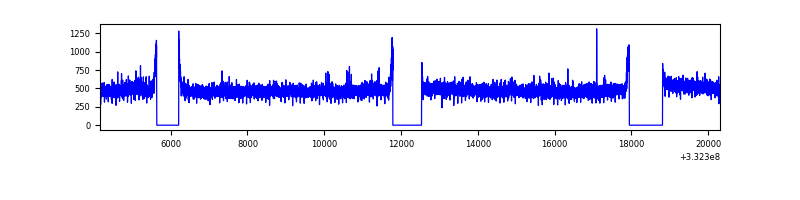 |
| D | 16145 | 13958 | 477 | 477 | 2.95% | 3.42% | 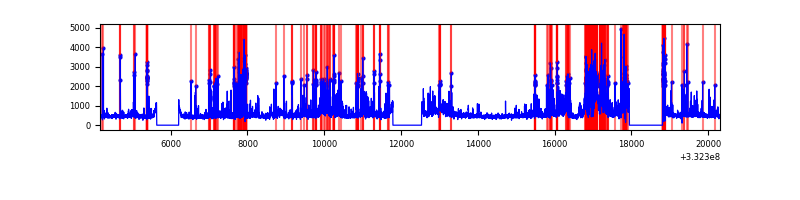 |
Top three noisy pixels from each quadrant. If the there are fewer than three noisy pixels in the level2.evt file, extra rows are filled as -1
| Pixel properties | Quadrant properties | ||||||
|---|---|---|---|---|---|---|---|
| Quadrant | DetID | PixID | Counts | Sigma | Mean | Median | Sigma |
| A | 0 | 13 | 8404036 | 25297.23 | 1662 | 1629 | 332.1 |
| A | 13 | 254 | 17967 | 49.19 | 1662 | 1629 | 332.1 |
| A | 3 | 137 | 15533 | 41.86 | 1662 | 1629 | 332.1 |
| B | 5 | 172 | 237523 | 736.28 | 1685 | 1644 | 320.4 |
| B | 10 | 245 | 65565 | 199.53 | 1685 | 1644 | 320.4 |
| B | 12 | 111 | 40833 | 122.33 | 1685 | 1644 | 320.4 |
| C | 14 | 238 | 258707 | 679.41 | 1622 | 1632 | 378.4 |
| C | 3 | 233 | 86183 | 223.45 | 1622 | 1632 | 378.4 |
| C | 13 | 61 | 11189 | 25.26 | 1622 | 1632 | 378.4 |
| D | 1 | 52 | 2829513 | 7328.36 | 1616 | 1578 | 385.9 |
| D | 7 | 238 | 464641 | 1199.99 | 1616 | 1578 | 385.9 |
| D | 2 | 234 | 55794 | 140.5 | 1616 | 1578 | 385.9 |
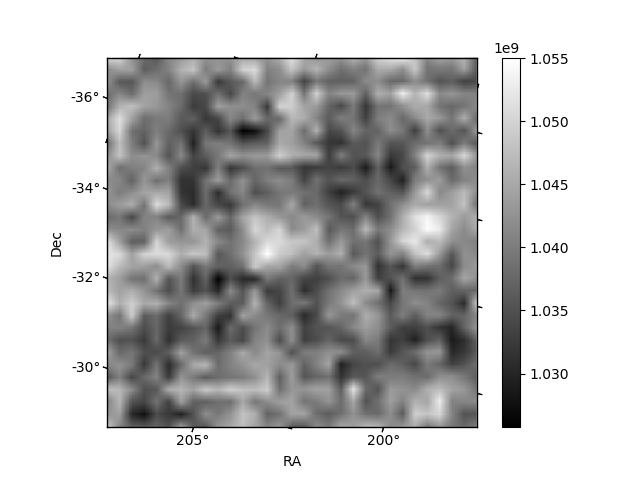
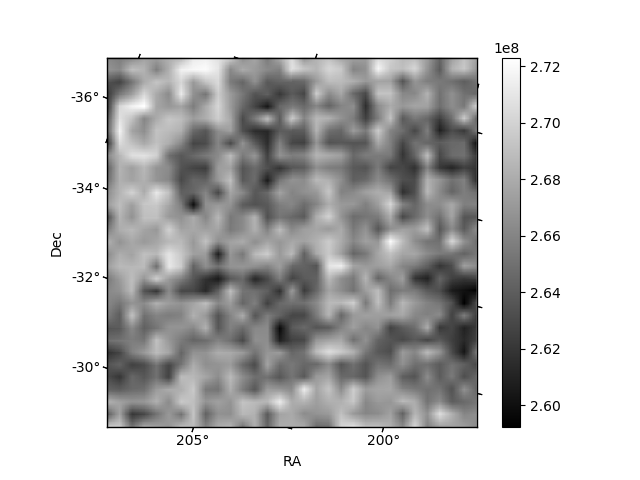
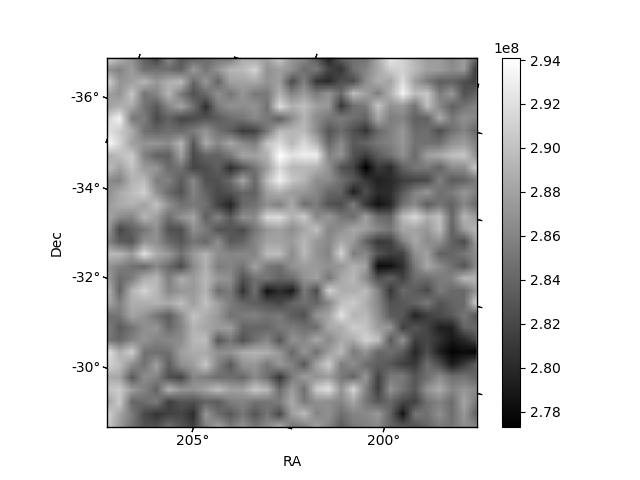
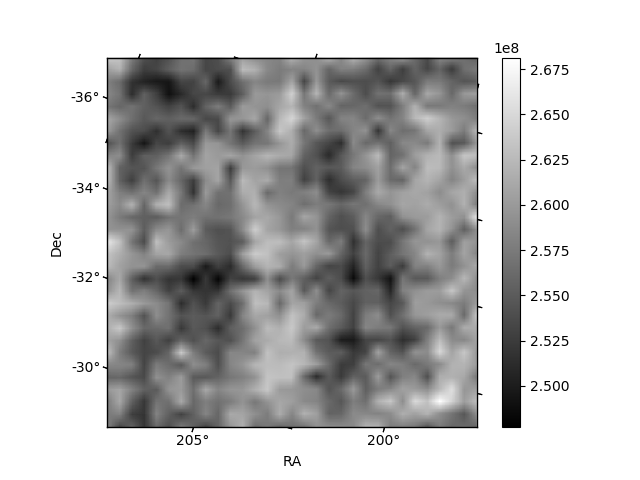
Histogram calculated using DETX and DETY for each event in the final _common_clean file
| Quadrant A | 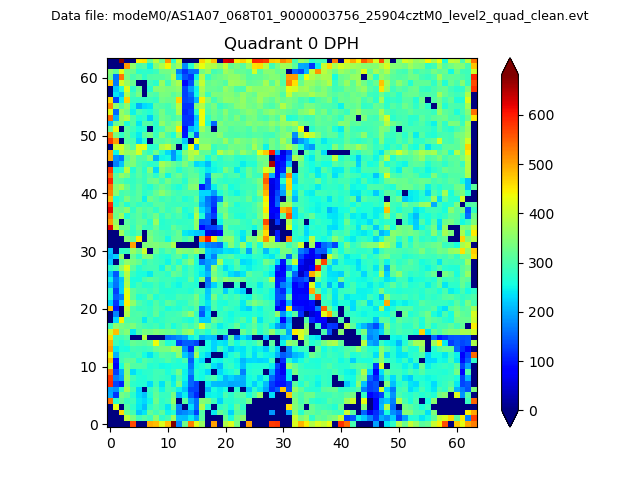 |
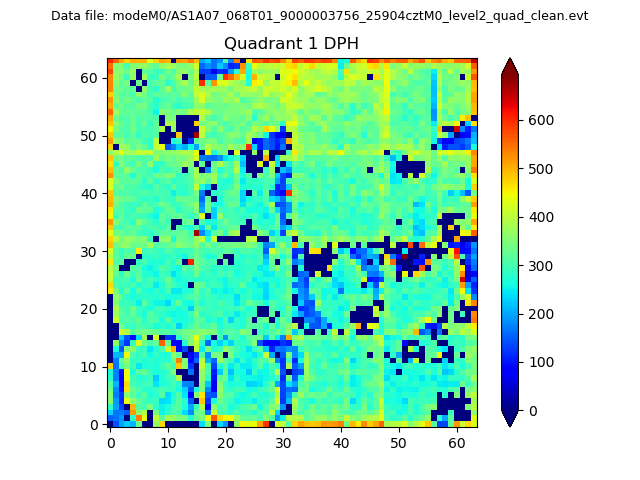 |
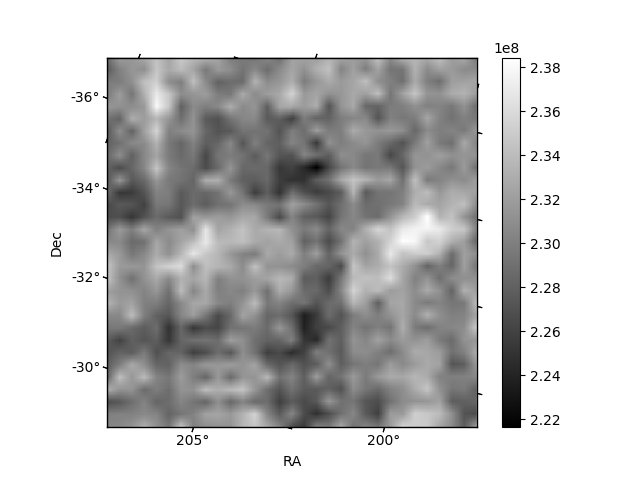
Quadrant B |
|---|---|---|---|
| Quadrant D | 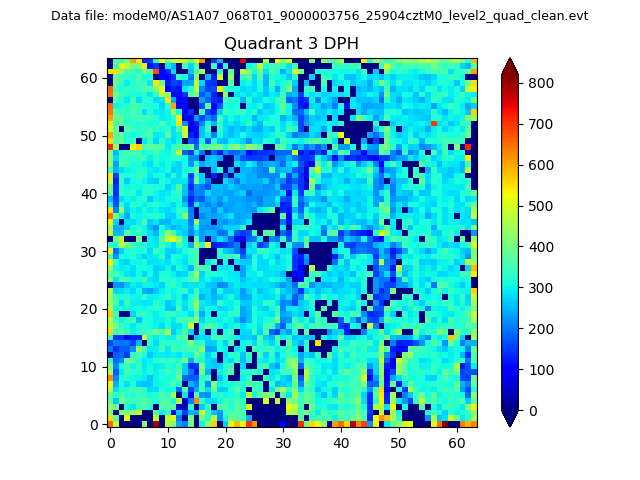 |
 |
Quadrant C |
| Plot type | Count rate plots | Images |
|---|---|---|
| Comparison with Poisson distribution Blue bars denote a histogram of data divided into 1 sec bins. Red curve is a Poisson curve with rate = median count rate of data. |
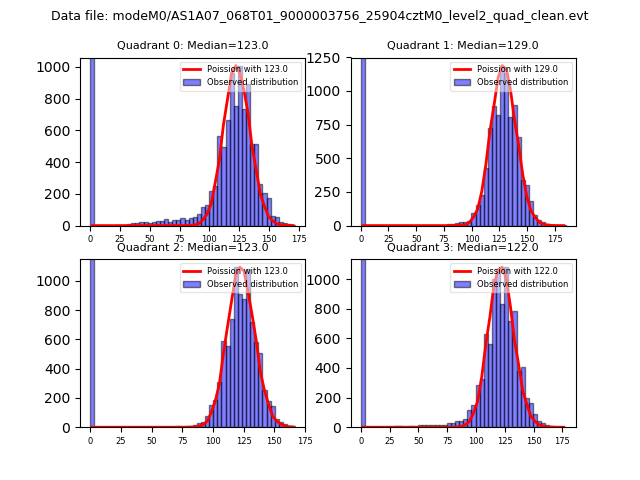 |
 |
| Quadrant-wise count rates Data is divided into 100 sec bins |
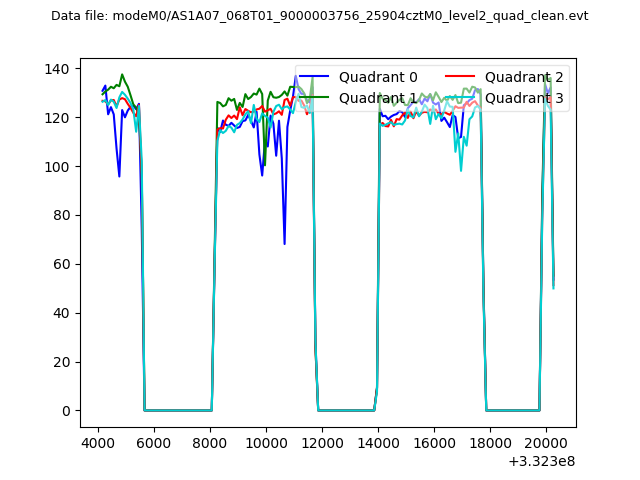 |
|
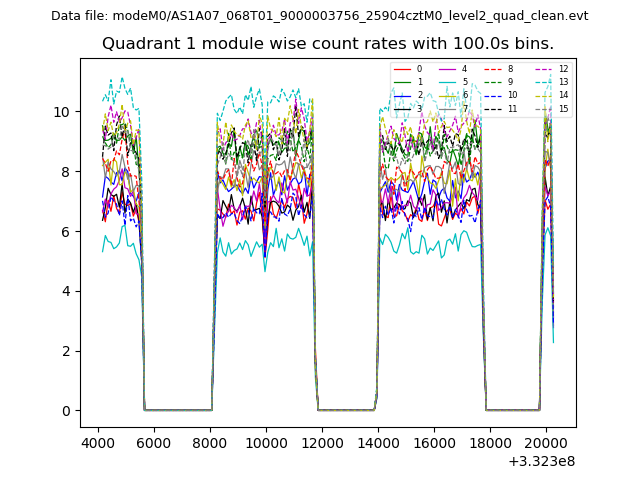
| Module-wise count rates for Quadrant A Data is divided into 100 sec bins |
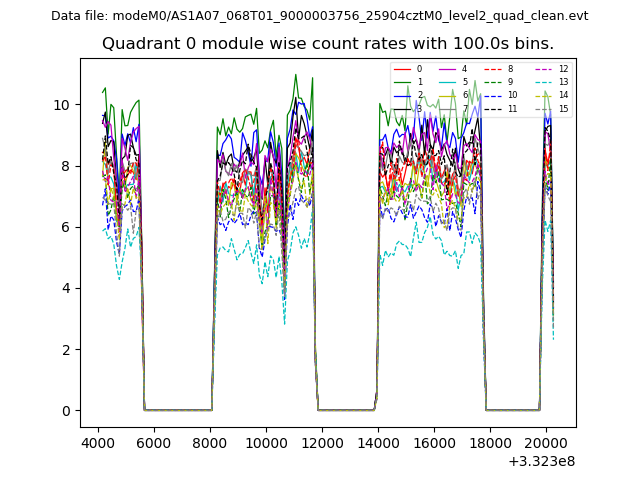 |
 |
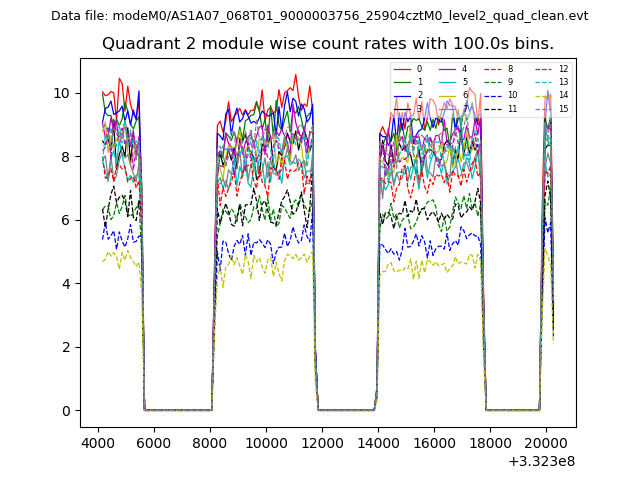
| Module-wise count rates for Quadrant B Data is divided into 100 sec bins |
 |
 |
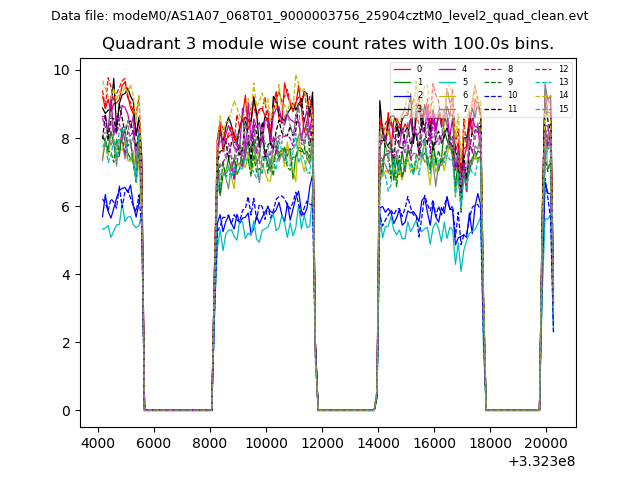
| Module-wise count rates for Quadrant C Data is divided into 100 sec bins |
 |
 |
| Module-wise count rates for Quadrant D Data is divided into 100 sec bins |
 |
 |
| Parameter | Plot |
|---|---|
| CZT HV Monitor | 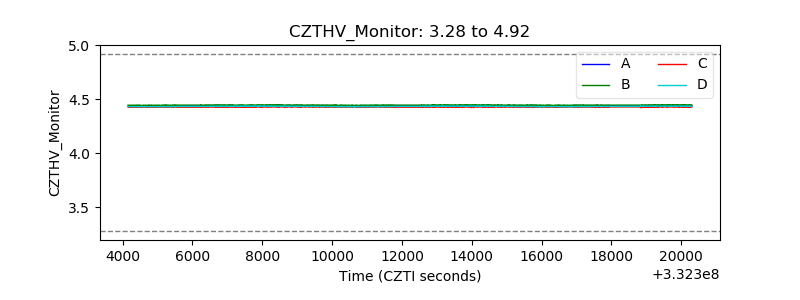 |
| D_VDD | 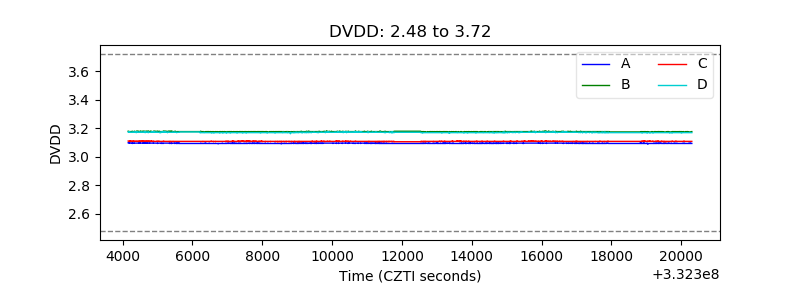 |
| Temperature 1 | 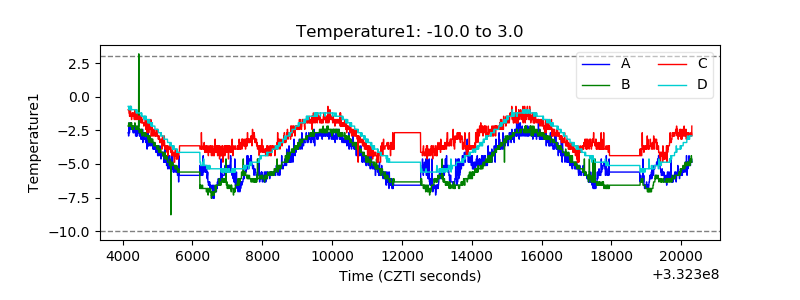 |
| Veto HV Monitor | 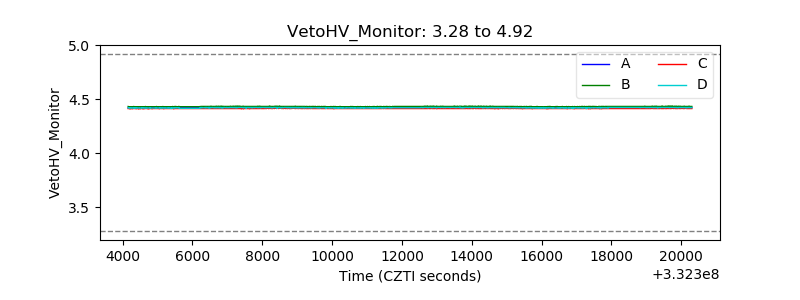 |
| Veto LLD | 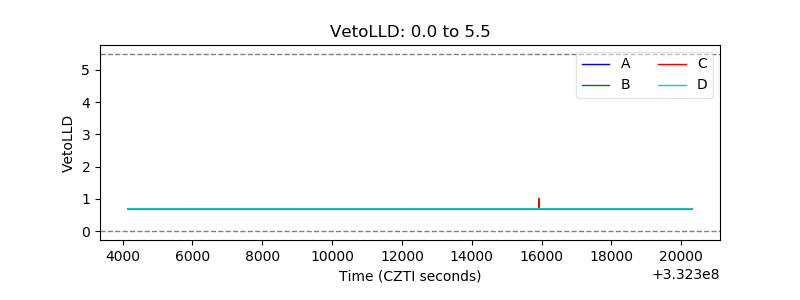 |
| Alpha Counter |  |
| _CPM_Rate | 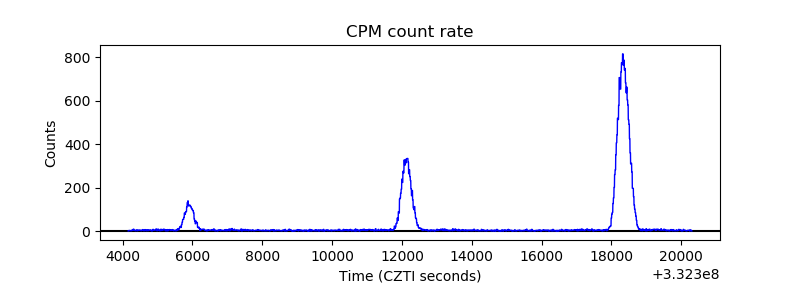 |
| CZT Counter | 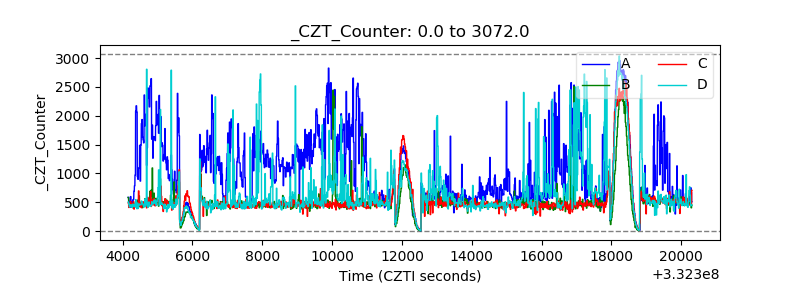 |
| +2.5 Volts monitor |  |
| +5 Volts monitor | 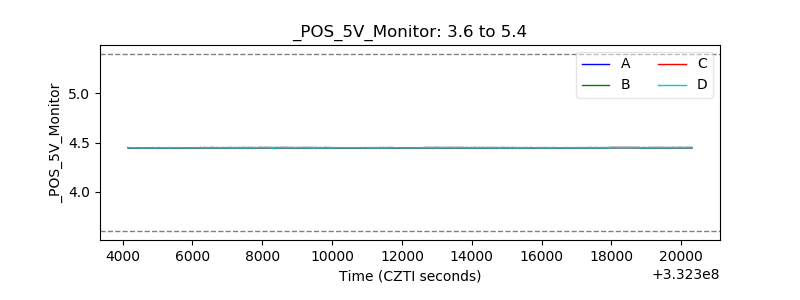 |
| _ROLL_ROT | 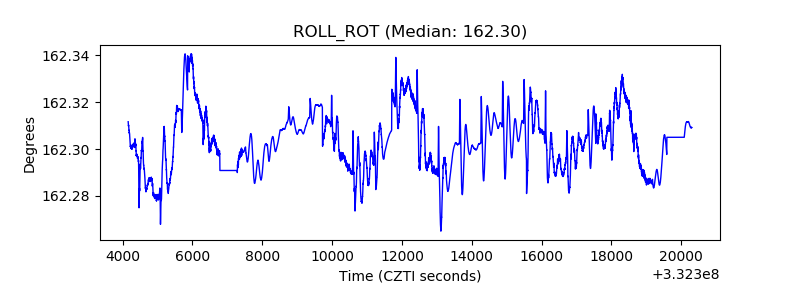 |
| _Roll_DEC | 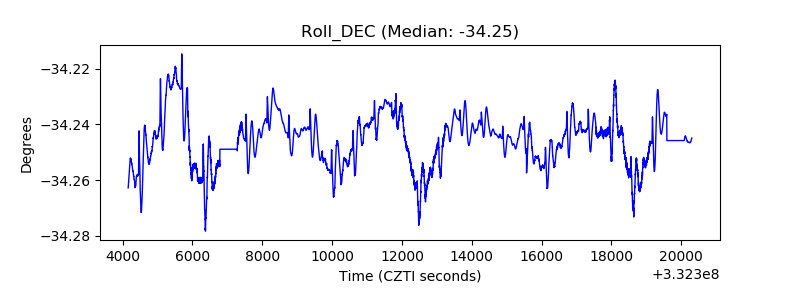 |
| _Roll_RA | 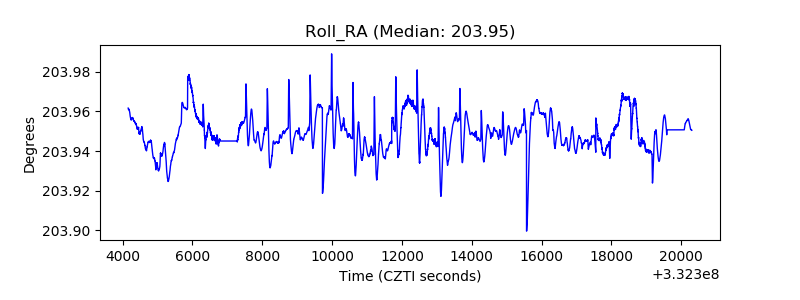 |
| Veto Counter | 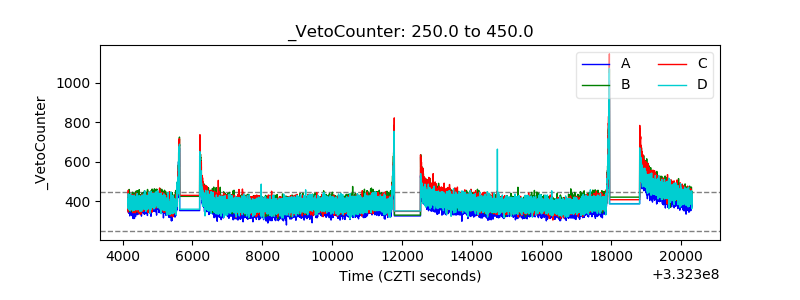 |