| Param | Original file | Final file |
|---|---|---|
| Filename | modeM0/AS1A07_068T01_9000003756_25905cztM0_level2.evt | modeM0/AS1A07_068T01_9000003756_25905cztM0_level2_quad_clean.evt |
| Size (bytes) | 3,571,822,080 | 521,187,840 |
| Size | 3.3 GB | 497.0 MB |
| Events in quadrant A | 43,463,938 | 3,088,318 |
| Events in quadrant B | 19,834,396 | 3,422,378 |
| Events in quadrant C | 19,034,442 | 3,260,418 |
| Events in quadrant D | 23,129,594 | 3,248,647 |
| Mode M0 | |||
|---|---|---|---|
| Quadrant | BADHDUFLAG | Total packets | Discarded packets |
| A | 0 | 156124 | 0 |
| B | 0 | 84461 | 0 |
| C | 0 | 82484 | 0 |
| D | 0 | 96239 | 0 |
| Mode M9 | |||
|---|---|---|---|
| Quadrant | BADHDUFLAG | Total packets | Discarded packets |
| A | 0 | 46 | 0 |
| B | 0 | 46 | 0 |
| C | 0 | 46 | 0 |
| D | 0 | 46 | 0 |
| Quadrant | Total seconds | Saturated seconds | Saturation percentage |
|---|---|---|---|
| A | 40270 | 7770 | 19.294760% |
| B | 40271 | 402 | 0.998237% |
| C | 40272 | 452 | 1.122368% |
| D | 40272 | 904 | 2.244736% |
Noise dominated data is calculated using 1-second bins in cleaned event files. If a bin has >2000 counts, and if more than 50% of those come from <1% of pixels, then it is considered to be noise-dominated and hence unusable.
| Quadrant | # 1 sec bins | Bins with >0 counts | Bins with >2000 counts | High rate bins dominated by noise | Noise dominated (total time) | Noise dominated (detector-on time) | Marked lightcurve |
|---|---|---|---|---|---|---|---|
| A | 44791 | 40277 | 6409 | 6409 | 14.31% | 15.91% | 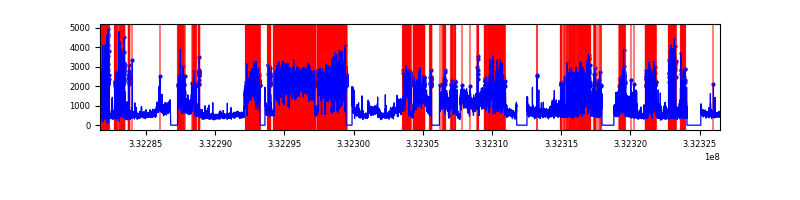 |
| B | 44791 | 40278 | 57 | 57 | 0.13% | 0.14% | 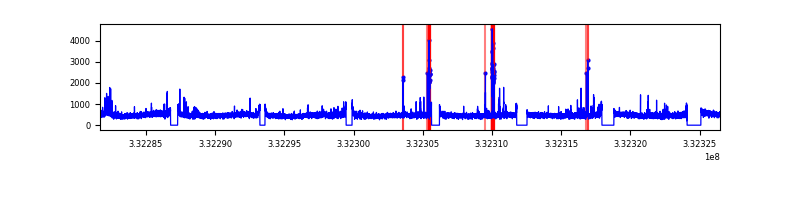 |
| C | 44792 | 40279 | 0 | 0 | 0.00% | 0.00% | 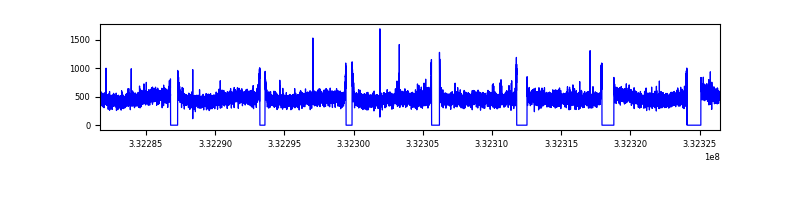 |
| D | 44792 | 40279 | 691 | 691 | 1.54% | 1.72% | 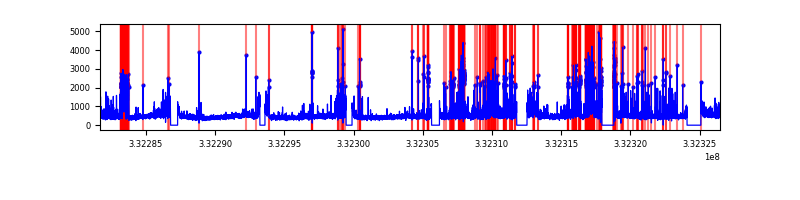 |
Top three noisy pixels from each quadrant. If the there are fewer than three noisy pixels in the level2.evt file, extra rows are filled as -1
| Pixel properties | Quadrant properties | ||||||
|---|---|---|---|---|---|---|---|
| Quadrant | DetID | PixID | Counts | Sigma | Mean | Median | Sigma |
| A | 0 | 13 | 25729503 | 28089.65 | 4602 | 4510 | 915.8 |
| A | 13 | 254 | 50650 | 50.38 | 4602 | 4510 | 915.8 |
| A | 3 | 137 | 42783 | 41.79 | 4602 | 4510 | 915.8 |
| B | 10 | 245 | 336536 | 360.13 | 4847 | 4724 | 921.4 |
| B | 5 | 172 | 259448 | 276.47 | 4847 | 4724 | 921.4 |
| B | 12 | 111 | 116574 | 121.4 | 4847 | 4724 | 921.4 |
| C | 14 | 238 | 743957 | 682.37 | 4656 | 4682 | 1083.4 |
| C | 3 | 233 | 160863 | 144.16 | 4656 | 4682 | 1083.4 |
| C | 13 | 61 | 32089 | 25.3 | 4656 | 4682 | 1083.4 |
| D | 1 | 52 | 4313574 | 3850.96 | 4701 | 4580 | 1118.9 |
| D | 7 | 238 | 524611 | 464.75 | 4701 | 4580 | 1118.9 |
| D | 5 | 223 | 240237 | 210.61 | 4701 | 4580 | 1118.9 |
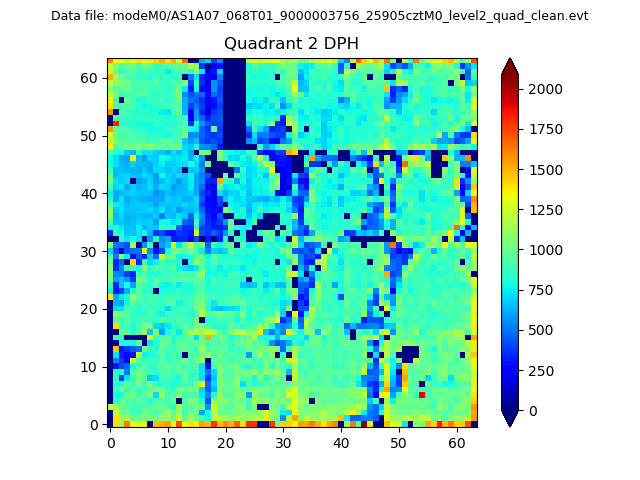
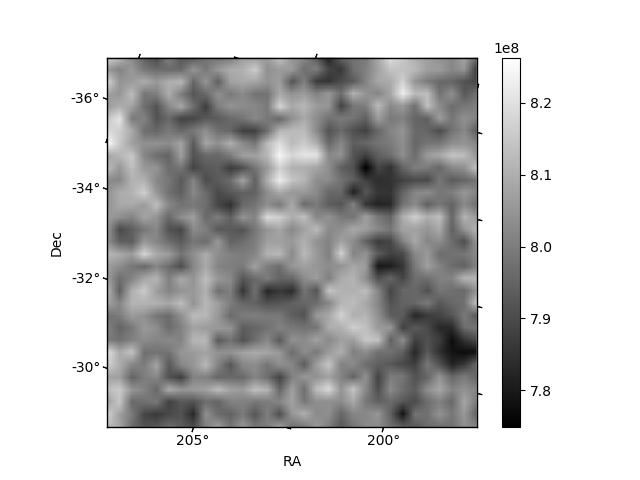
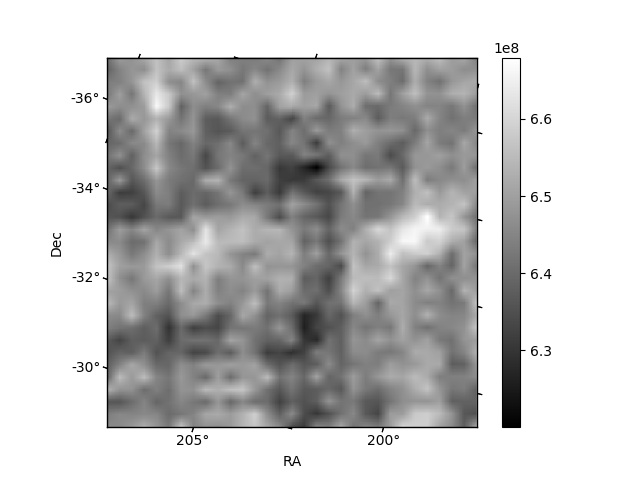
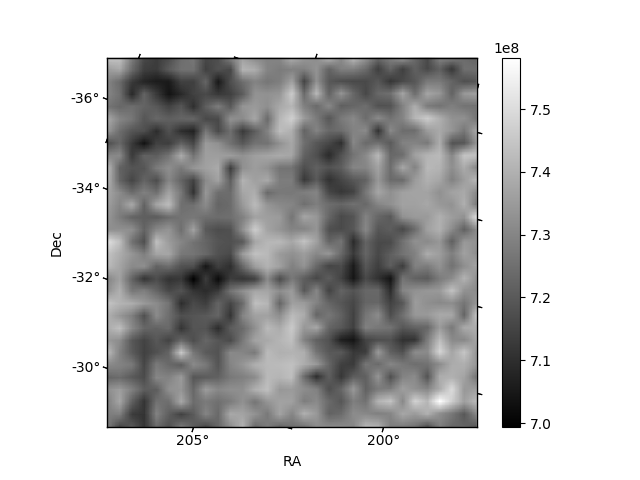
Histogram calculated using DETX and DETY for each event in the final _common_clean file
| Quadrant A | 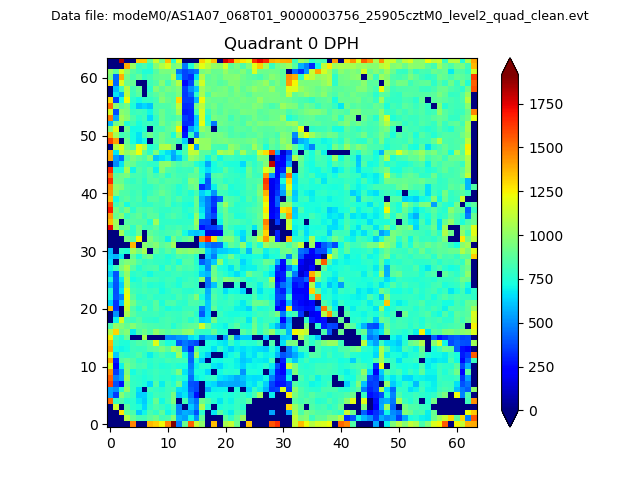 |
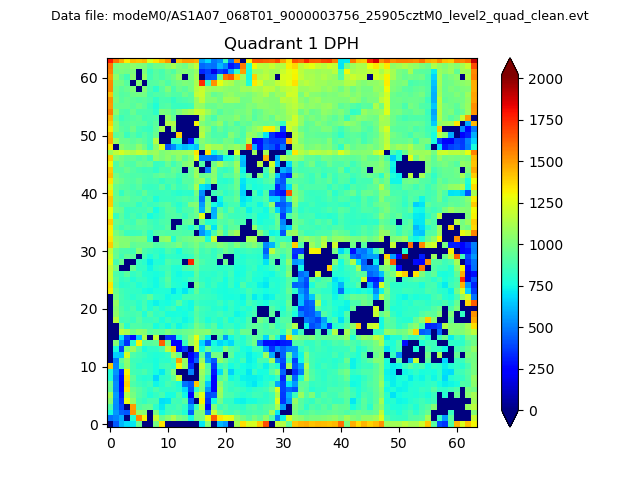 |
Quadrant B |
|---|---|---|---|
| Quadrant D | 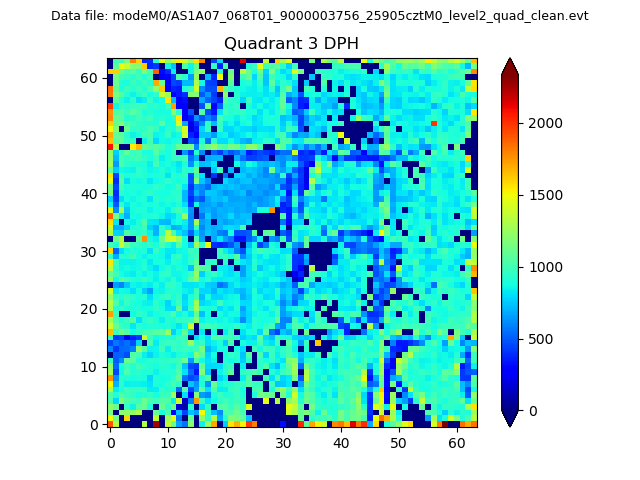 |
 |
Quadrant C |
| Plot type | Count rate plots | Images |
|---|---|---|
| Comparison with Poisson distribution Blue bars denote a histogram of data divided into 1 sec bins. Red curve is a Poisson curve with rate = median count rate of data. |
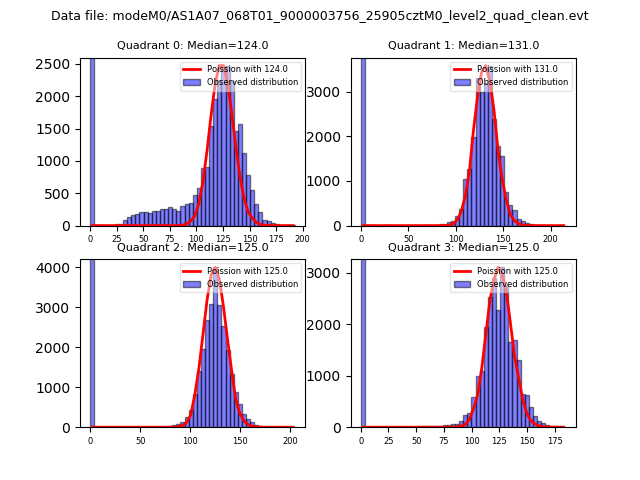 |
 |
| Quadrant-wise count rates Data is divided into 100 sec bins |
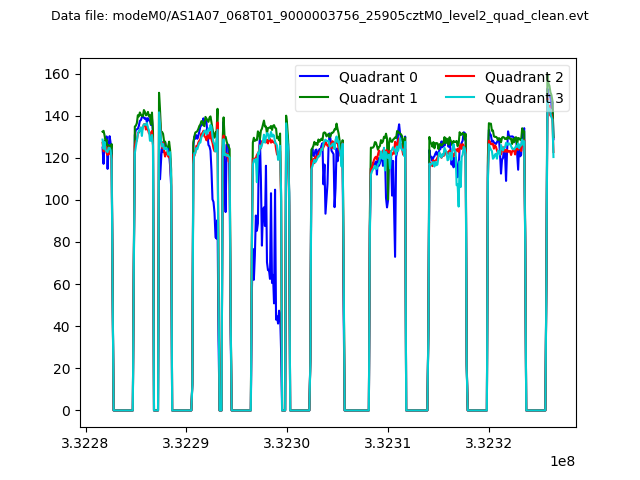 |
|
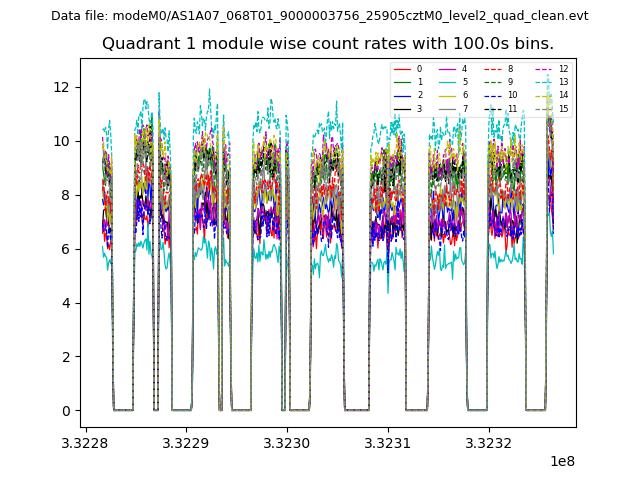
| Module-wise count rates for Quadrant A Data is divided into 100 sec bins |
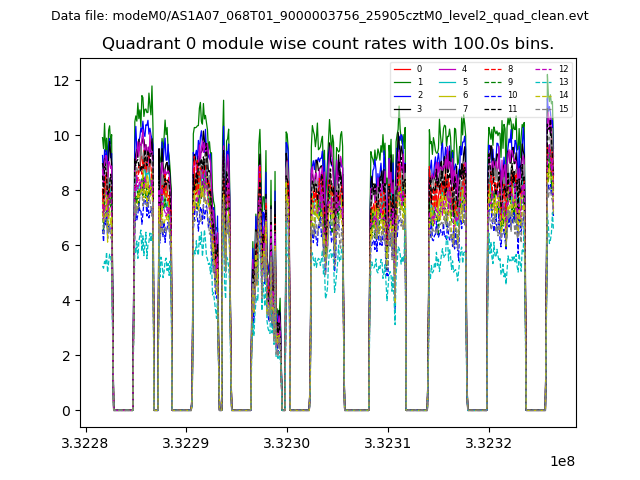 |
 |
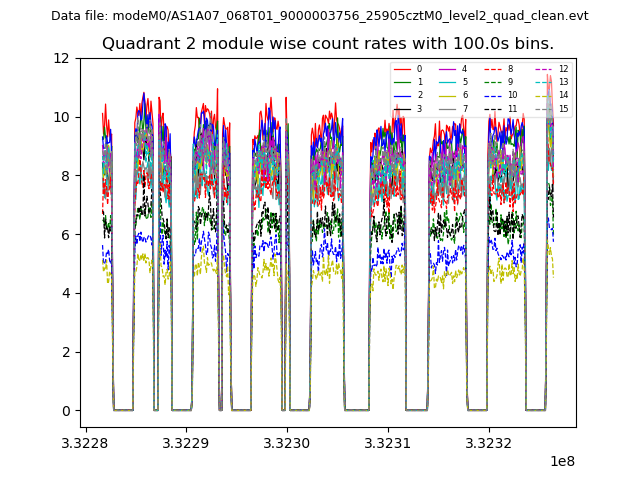
| Module-wise count rates for Quadrant B Data is divided into 100 sec bins |
 |
 |
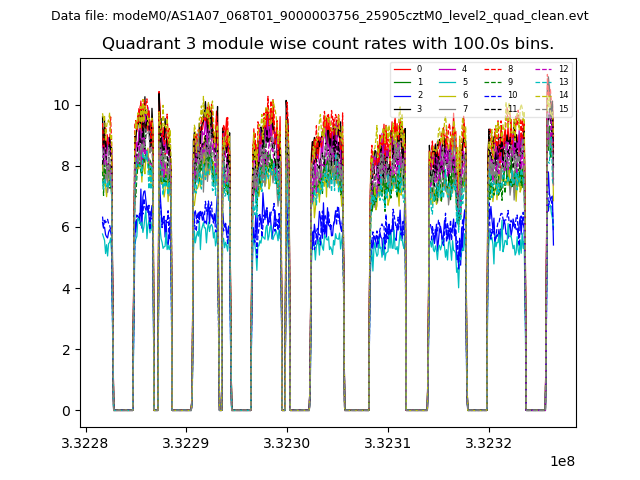
| Module-wise count rates for Quadrant C Data is divided into 100 sec bins |
 |
 |
| Module-wise count rates for Quadrant D Data is divided into 100 sec bins |
 |
 |
| Parameter | Plot |
|---|---|
| CZT HV Monitor | 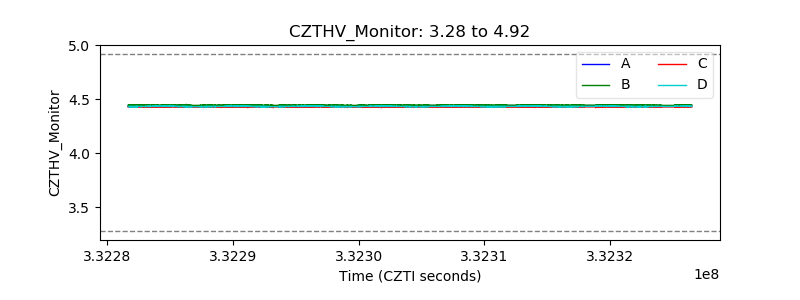 |
| D_VDD | 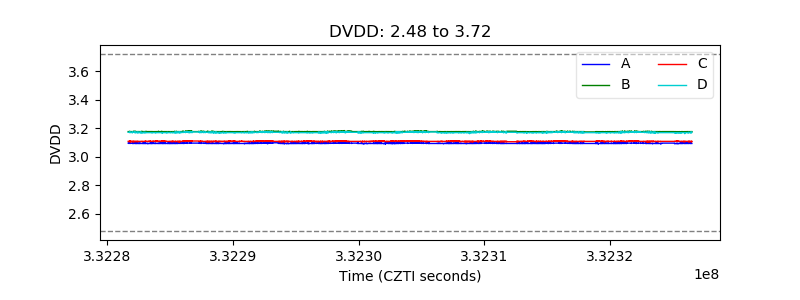 |
| Temperature 1 | 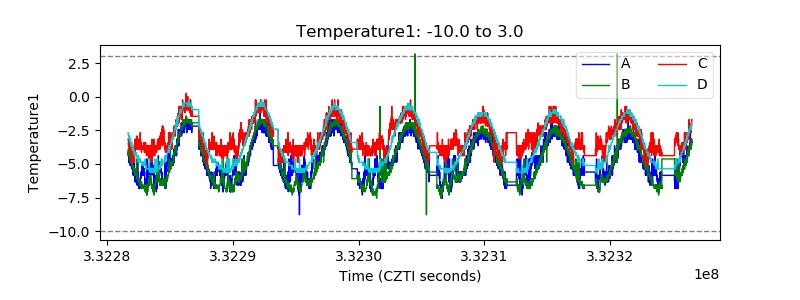 |
| Veto HV Monitor | 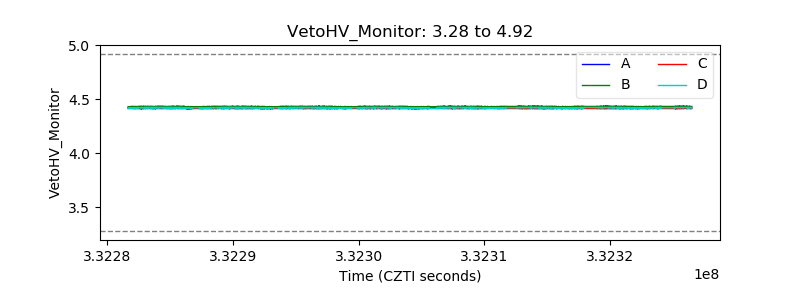 |
| Veto LLD | 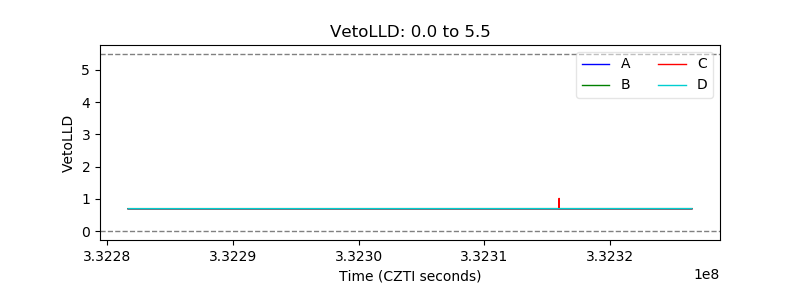 |
| Alpha Counter | 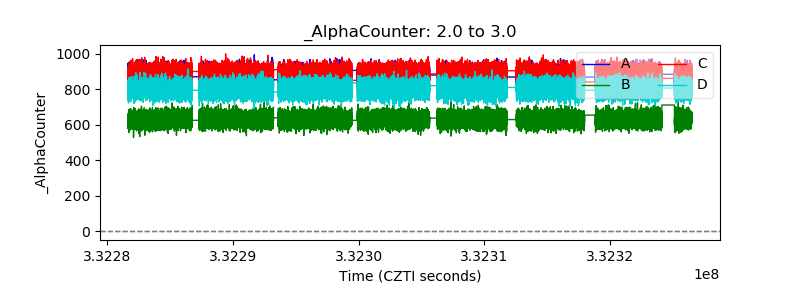 |
| _CPM_Rate | 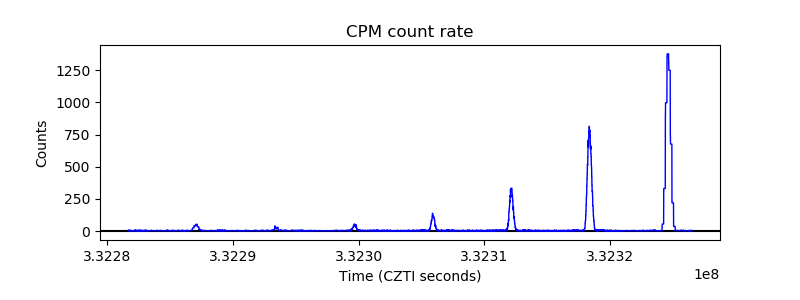 |
| CZT Counter | 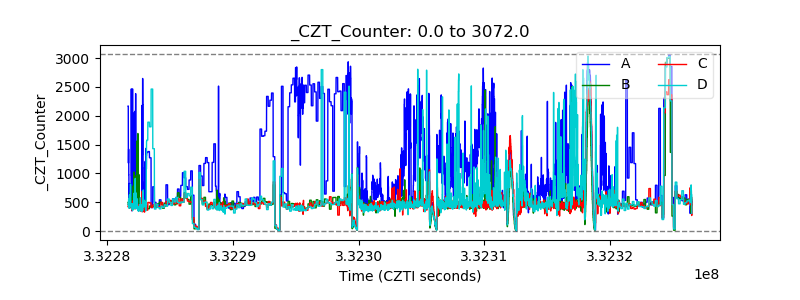 |
| +2.5 Volts monitor |  |
| +5 Volts monitor |  |
| _ROLL_ROT | 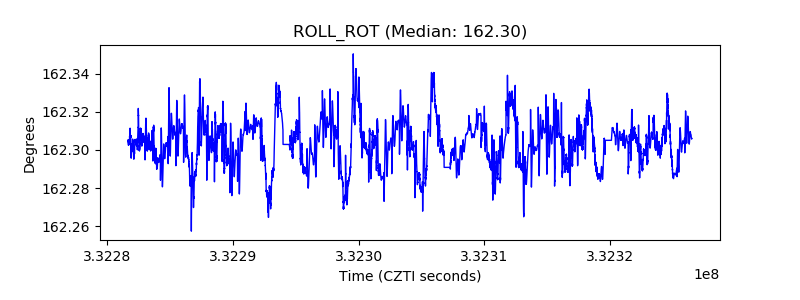 |
| _Roll_DEC | 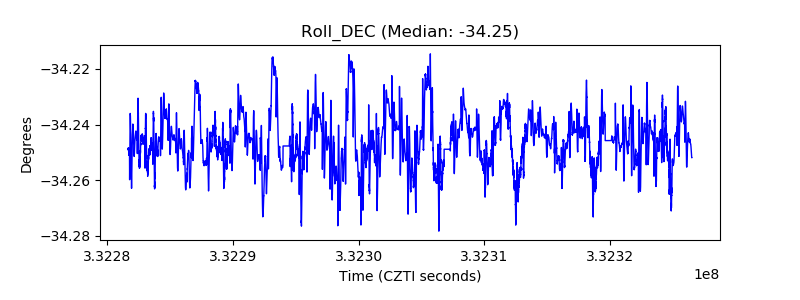 |
| _Roll_RA | 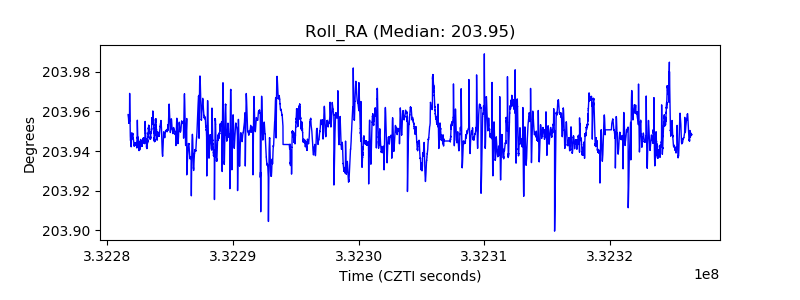 |
| Veto Counter | 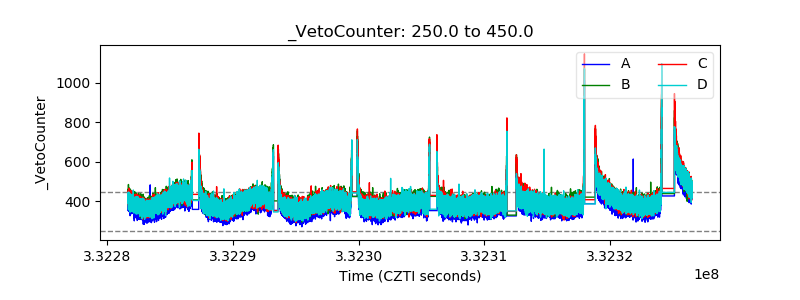 |