| Param | Original file | Final file |
|---|---|---|
| Filename | modeM0/AS1A07_068T01_9000003756_25907cztM0_level2.evt | modeM0/AS1A07_068T01_9000003756_25907cztM0_level2_quad_clean.evt |
| Size (bytes) | 449,012,160 | 104,627,520 |
| Size | 428.2 MB | 99.8 MB |
| Events in quadrant A | 3,807,375 | 699,179 |
| Events in quadrant B | 3,013,629 | 709,501 |
| Events in quadrant C | 3,039,431 | 670,878 |
| Events in quadrant D | 3,338,284 | 678,022 |
| Mode M0 | |||
|---|---|---|---|
| Quadrant | BADHDUFLAG | Total packets | Discarded packets |
| A | 0 | 15239 | 0 |
| B | 0 | 12675 | 0 |
| C | 0 | 12837 | 0 |
| D | 0 | 13686 | 0 |
| Mode M9 | |||
|---|---|---|---|
| Quadrant | BADHDUFLAG | Total packets | Discarded packets |
| A | 0 | 11 | 0 |
| B | 0 | 11 | 0 |
| C | 0 | 11 | 0 |
| D | 0 | 11 | 0 |
| Quadrant | Total seconds | Saturated seconds | Saturation percentage |
|---|---|---|---|
| A | 5882 | 189 | 3.213193% |
| B | 5883 | 67 | 1.138875% |
| C | 5883 | 90 | 1.529832% |
| D | 5883 | 72 | 1.223865% |
Noise dominated data is calculated using 1-second bins in cleaned event files. If a bin has >2000 counts, and if more than 50% of those come from <1% of pixels, then it is considered to be noise-dominated and hence unusable.
| Quadrant | # 1 sec bins | Bins with >0 counts | Bins with >2000 counts | High rate bins dominated by noise | Noise dominated (total time) | Noise dominated (detector-on time) | Marked lightcurve |
|---|---|---|---|---|---|---|---|
| A | 7002 | 5883 | 113 | 113 | 1.61% | 1.92% | 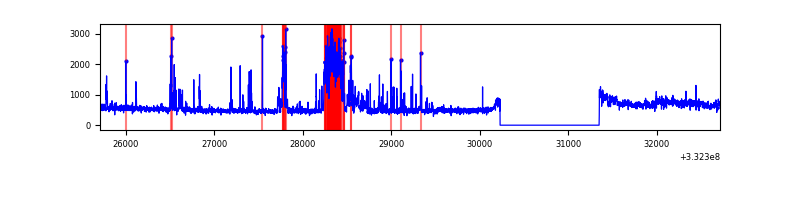 |
| B | 7003 | 5884 | 2 | 2 | 0.03% | 0.03% | 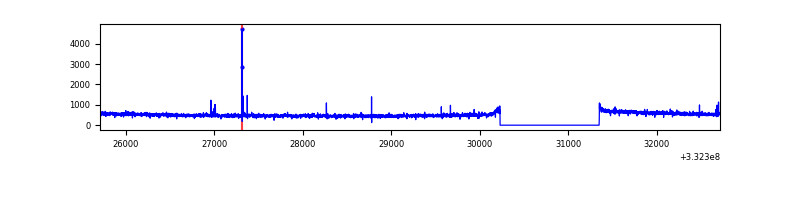 |
| C | 7003 | 5884 | 1 | 1 | 0.01% | 0.02% | 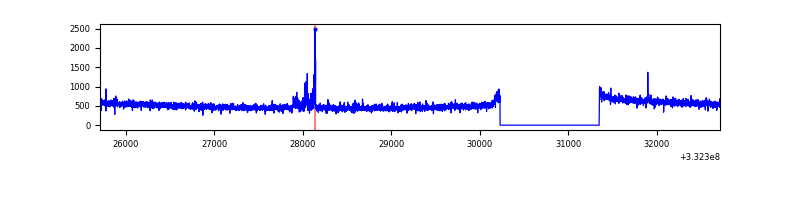 |
| D | 7003 | 5884 | 19 | 19 | 0.27% | 0.32% | 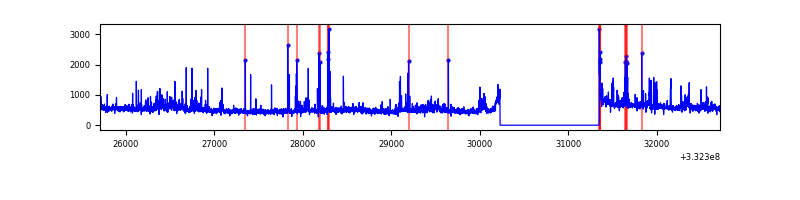 |
Top three noisy pixels from each quadrant. If the there are fewer than three noisy pixels in the level2.evt file, extra rows are filled as -1
| Pixel properties | Quadrant properties | ||||||
|---|---|---|---|---|---|---|---|
| Quadrant | DetID | PixID | Counts | Sigma | Mean | Median | Sigma |
| A | 0 | 13 | 827664 | 5368.18 | 772 | 759 | 154.0 |
| A | 13 | 254 | 7589 | 44.34 | 772 | 759 | 154.0 |
| A | 0 | 226 | 6741 | 38.83 | 772 | 759 | 154.0 |
| B | 12 | 111 | 17259 | 114.75 | 758 | 740 | 144.0 |
| B | 11 | 111 | 15577 | 103.07 | 758 | 740 | 144.0 |
| B | 14 | 111 | 14368 | 94.67 | 758 | 740 | 144.0 |
| C | 14 | 238 | 119581 | 695.79 | 731 | 735 | 170.8 |
| C | 3 | 233 | 70519 | 408.56 | 731 | 735 | 170.8 |
| C | 13 | 61 | 4813 | 23.87 | 731 | 735 | 170.8 |
| D | 1 | 52 | 471035 | 2643.35 | 749 | 733 | 177.9 |
| D | 2 | 234 | 22342 | 121.45 | 749 | 733 | 177.9 |
| D | 2 | 153 | 11194 | 58.8 | 749 | 733 | 177.9 |
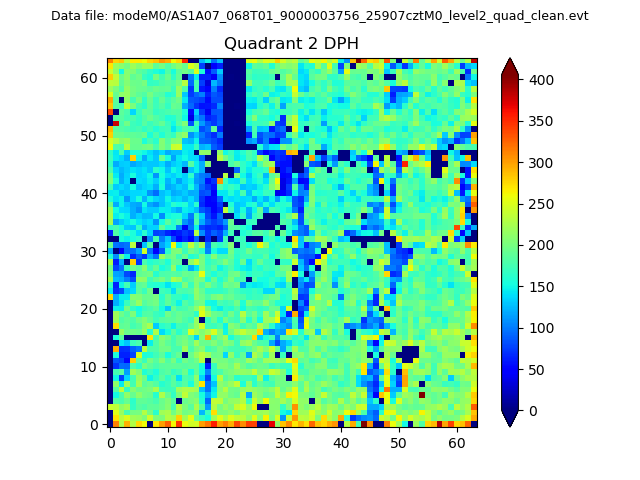
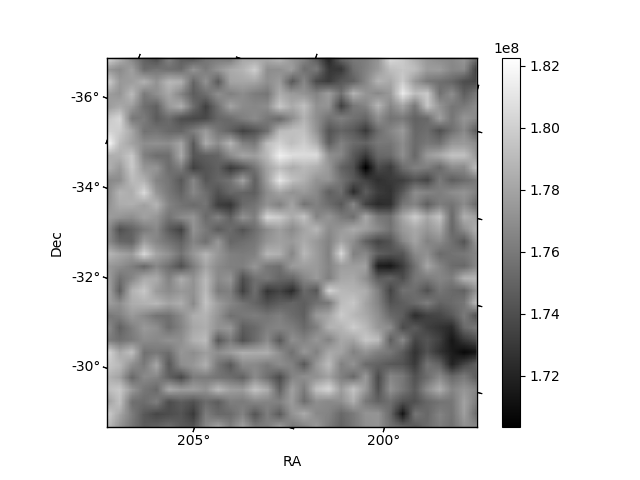
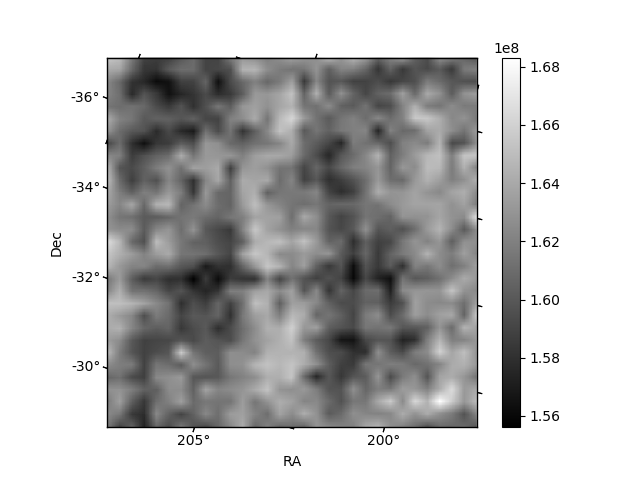
Histogram calculated using DETX and DETY for each event in the final _common_clean file
| Quadrant A | 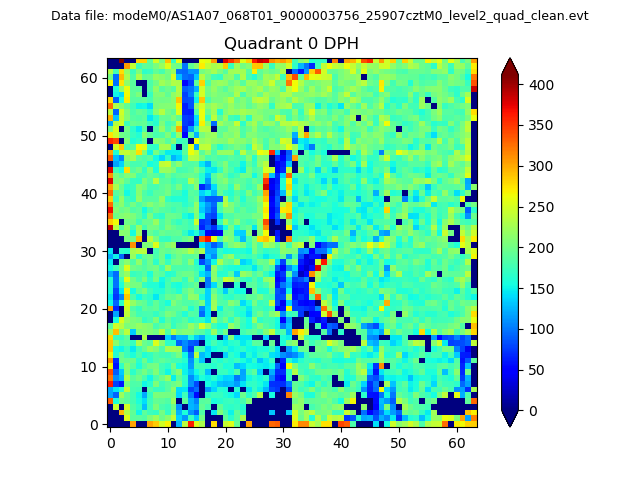 |
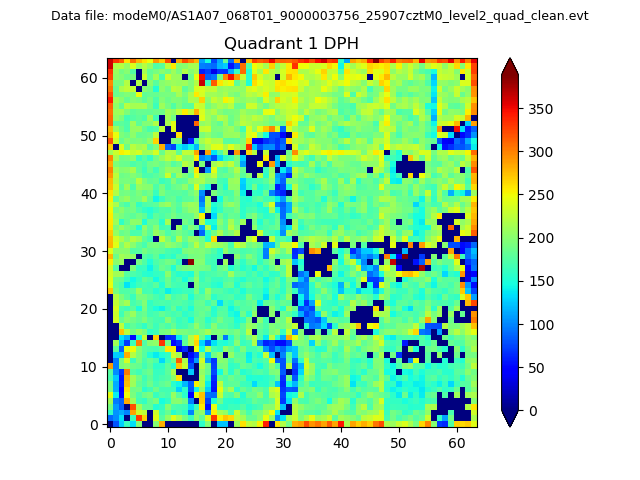 |
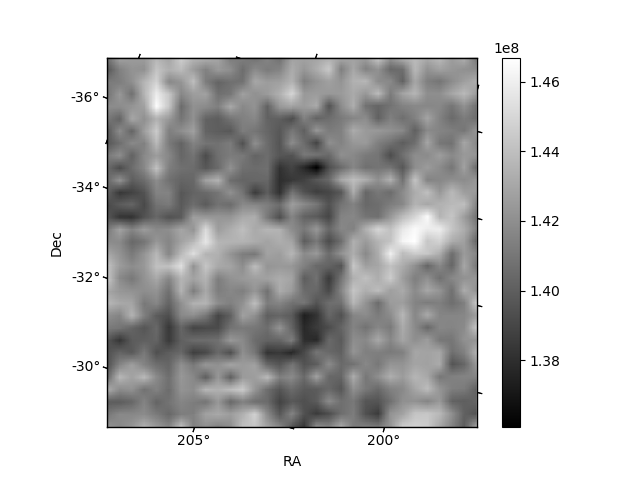
Quadrant B |
|---|---|---|---|
| Quadrant D | 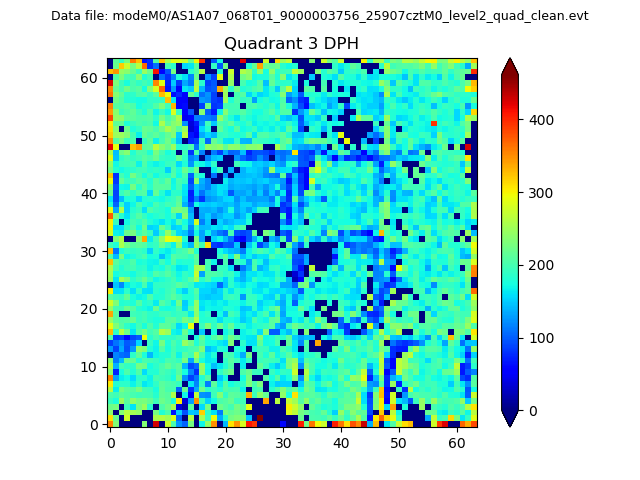 |
 |
Quadrant C |
| Plot type | Count rate plots | Images |
|---|---|---|
| Comparison with Poisson distribution Blue bars denote a histogram of data divided into 1 sec bins. Red curve is a Poisson curve with rate = median count rate of data. |
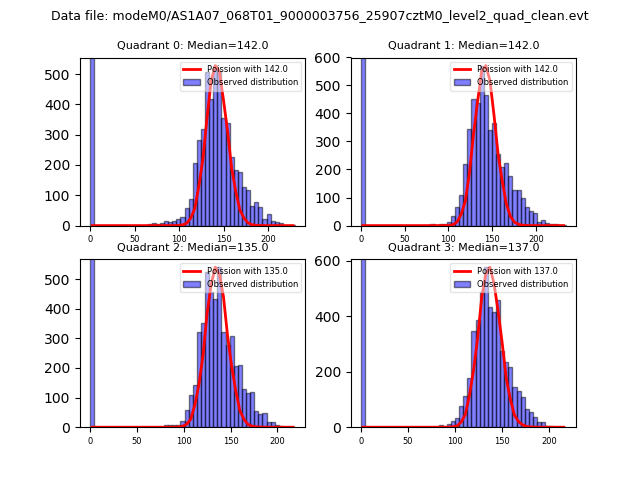 |
 |
| Quadrant-wise count rates Data is divided into 100 sec bins |
 |
|
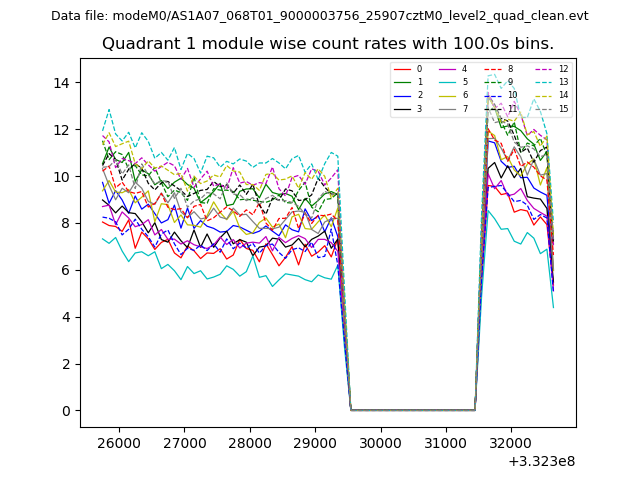
| Module-wise count rates for Quadrant A Data is divided into 100 sec bins |
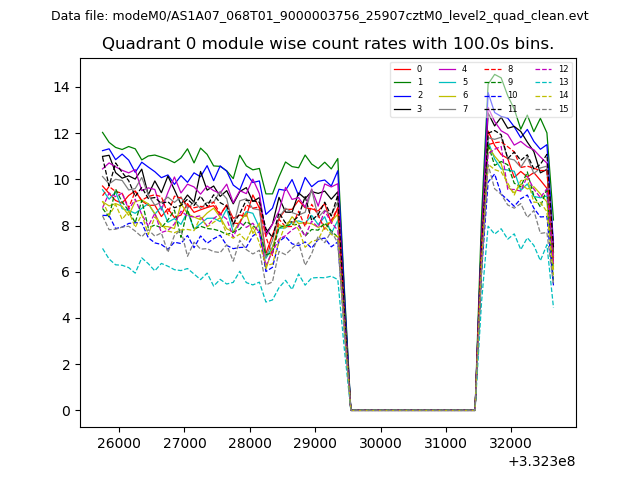 |
 |
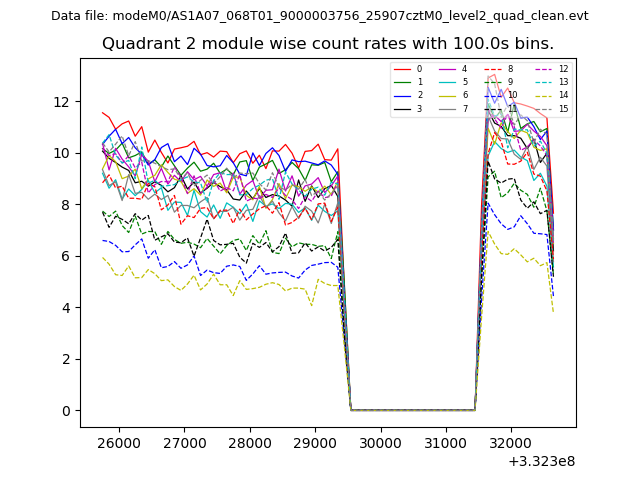
| Module-wise count rates for Quadrant B Data is divided into 100 sec bins |
 |
 |
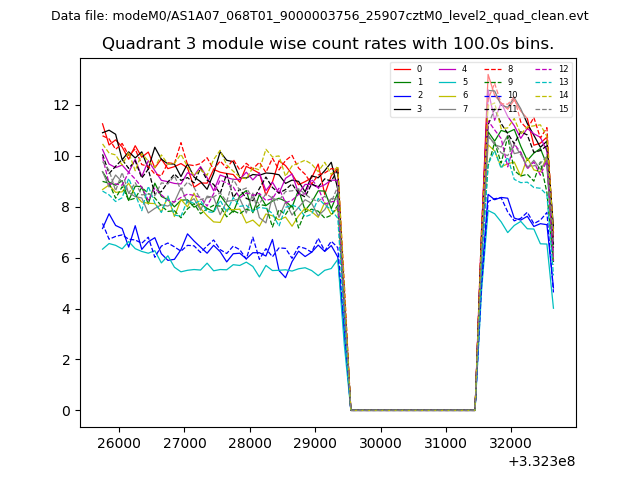
| Module-wise count rates for Quadrant C Data is divided into 100 sec bins |
 |
 |
| Module-wise count rates for Quadrant D Data is divided into 100 sec bins |
 |
 |
| Parameter | Plot |
|---|---|
| CZT HV Monitor | 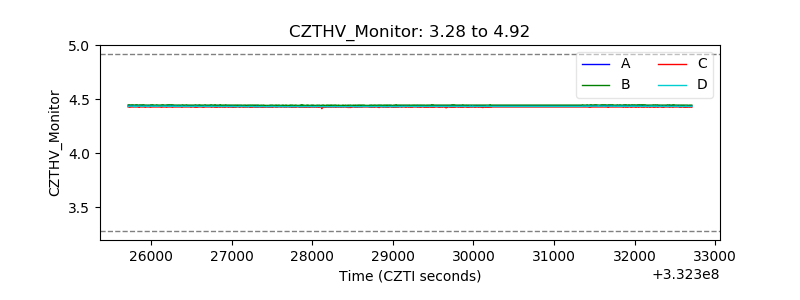 |
| D_VDD | 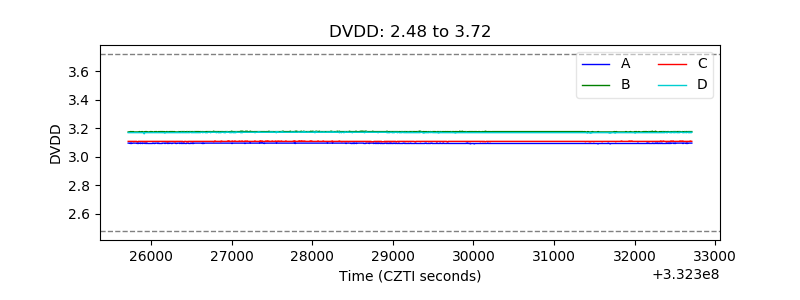 |
| Temperature 1 | 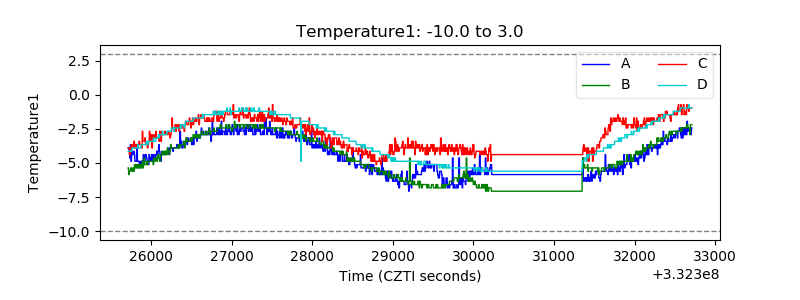 |
| Veto HV Monitor |  |
| Veto LLD |  |
| Alpha Counter |  |
| _CPM_Rate | 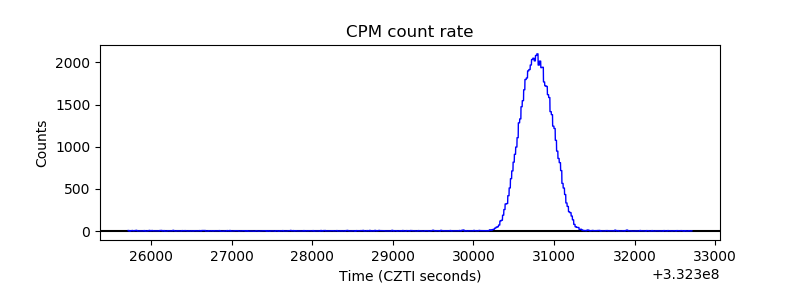 |
| CZT Counter | 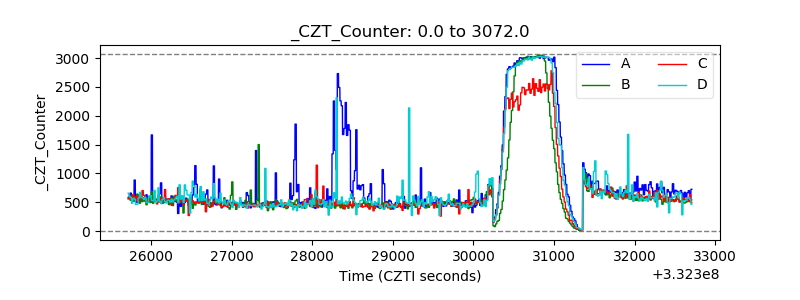 |
| +2.5 Volts monitor | 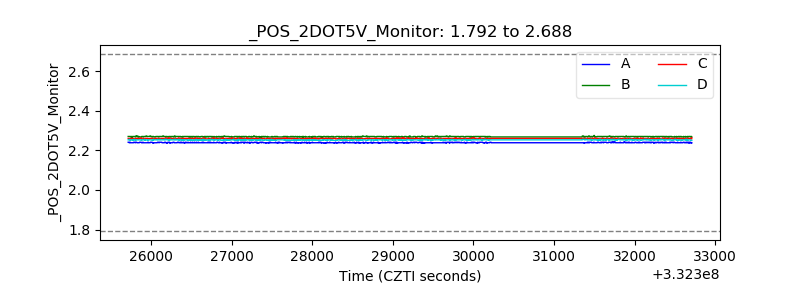 |
| +5 Volts monitor |  |
| _ROLL_ROT | 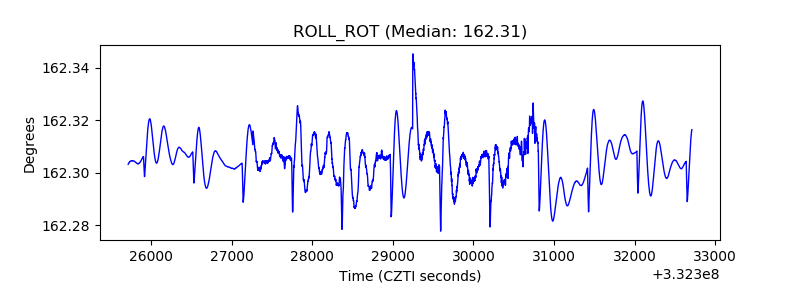 |
| _Roll_DEC | 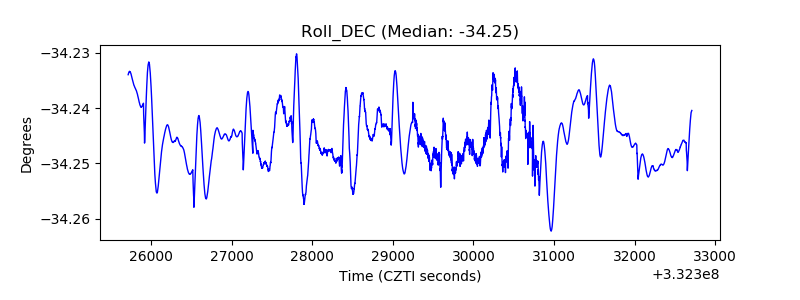 |
| _Roll_RA | 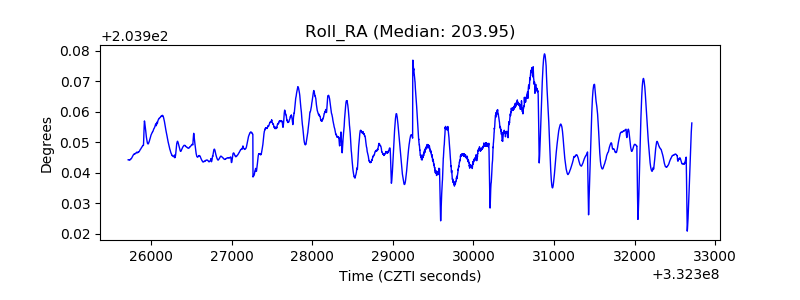 |
| Veto Counter | 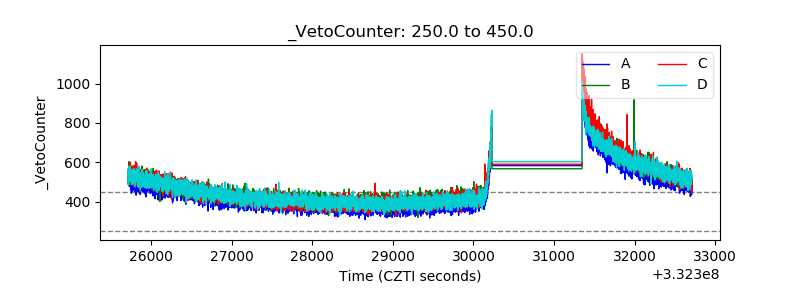 |