| Param | Original file | Final file |
|---|---|---|
| Filename | modeM0/AS1A07_068T01_9000003756_25908cztM0_level2.evt | modeM0/AS1A07_068T01_9000003756_25908cztM0_level2_quad_clean.evt |
| Size (bytes) | 570,242,880 | 125,112,960 |
| Size | 543.8 MB | 119.3 MB |
| Events in quadrant A | 4,770,835 | 859,489 |
| Events in quadrant B | 3,606,446 | 858,732 |
| Events in quadrant C | 3,559,238 | 803,724 |
| Events in quadrant D | 4,881,932 | 802,708 |
| Mode M0 | |||
|---|---|---|---|
| Quadrant | BADHDUFLAG | Total packets | Discarded packets |
| A | 0 | 18872 | 0 |
| B | 0 | 15025 | 0 |
| C | 0 | 15013 | 0 |
| D | 0 | 19112 | 0 |
| Mode M9 | |||
|---|---|---|---|
| Quadrant | BADHDUFLAG | Total packets | Discarded packets |
| A | 0 | 12 | 0 |
| B | 0 | 13 | 0 |
| C | 0 | 13 | 0 |
| D | 0 | 13 | 0 |
| Quadrant | Total seconds | Saturated seconds | Saturation percentage |
|---|---|---|---|
| A | 6665 | 325 | 4.876219% |
| B | 6665 | 88 | 1.320330% |
| C | 6665 | 122 | 1.830458% |
| D | 6665 | 295 | 4.426107% |
Noise dominated data is calculated using 1-second bins in cleaned event files. If a bin has >2000 counts, and if more than 50% of those come from <1% of pixels, then it is considered to be noise-dominated and hence unusable.
| Quadrant | # 1 sec bins | Bins with >0 counts | Bins with >2000 counts | High rate bins dominated by noise | Noise dominated (total time) | Noise dominated (detector-on time) | Marked lightcurve |
|---|---|---|---|---|---|---|---|
| A | 7895 | 6666 | 169 | 169 | 2.14% | 2.54% | 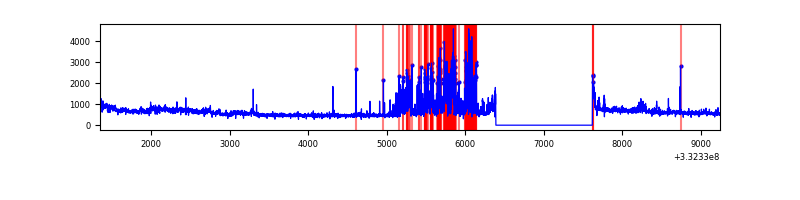 |
| B | 7895 | 6666 | 11 | 11 | 0.14% | 0.17% | 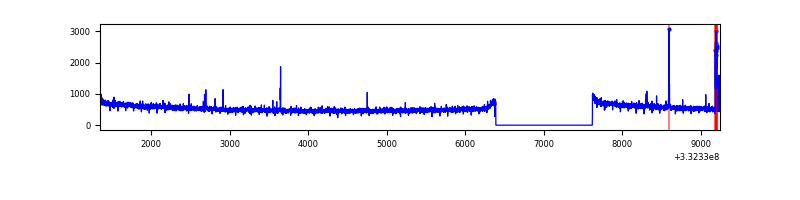 |
| C | 7895 | 6666 | 0 | 0 | 0.00% | 0.00% | 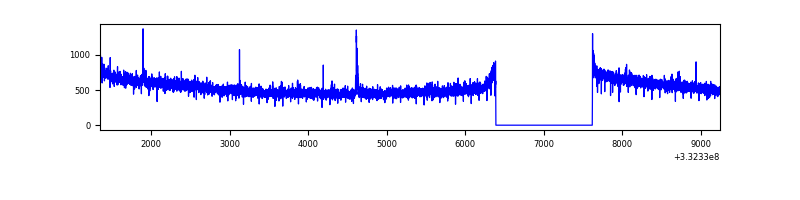 |
| D | 7895 | 6665 | 178 | 178 | 2.25% | 2.67% | 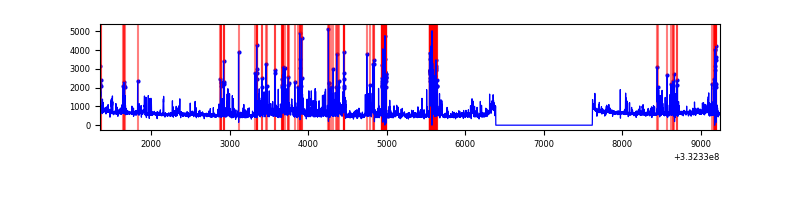 |
Top three noisy pixels from each quadrant. If the there are fewer than three noisy pixels in the level2.evt file, extra rows are filled as -1
| Pixel properties | Quadrant properties | ||||||
|---|---|---|---|---|---|---|---|
| Quadrant | DetID | PixID | Counts | Sigma | Mean | Median | Sigma |
| A | 0 | 13 | 1219930 | 6729.43 | 921 | 904 | 181.1 |
| A | 13 | 254 | 9312 | 46.41 | 921 | 904 | 181.1 |
| A | 0 | 226 | 8029 | 39.33 | 921 | 904 | 181.1 |
| B | 10 | 245 | 43218 | 251.58 | 902 | 882 | 168.3 |
| B | 12 | 111 | 19975 | 113.46 | 902 | 882 | 168.3 |
| B | 11 | 111 | 18413 | 104.18 | 902 | 882 | 168.3 |
| C | 14 | 238 | 142999 | 714.81 | 867 | 872 | 198.8 |
| C | 3 | 233 | 25228 | 122.5 | 867 | 872 | 198.8 |
| C | 10 | 22 | 10805 | 49.96 | 867 | 872 | 198.8 |
| D | 1 | 52 | 1440977 | 6840.12 | 884 | 863 | 210.5 |
| D | 7 | 80 | 45443 | 211.74 | 884 | 863 | 210.5 |
| D | 2 | 234 | 24123 | 110.48 | 884 | 863 | 210.5 |
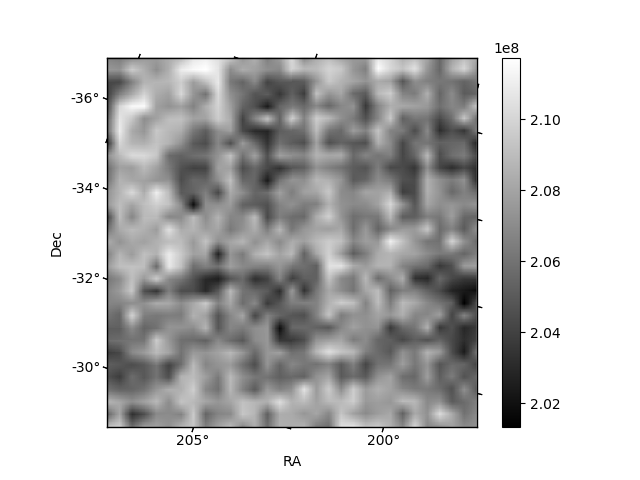
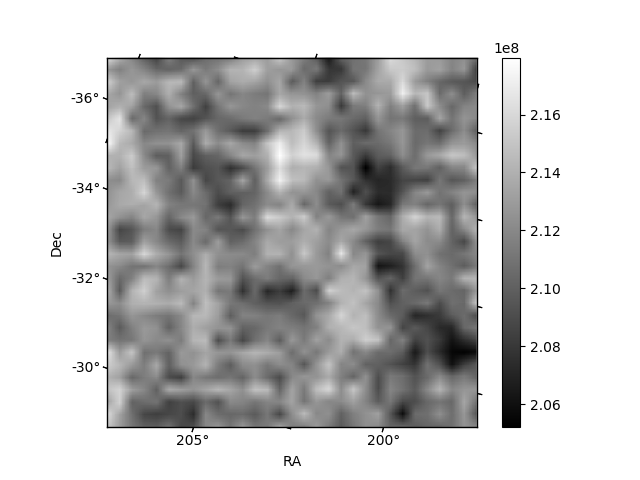
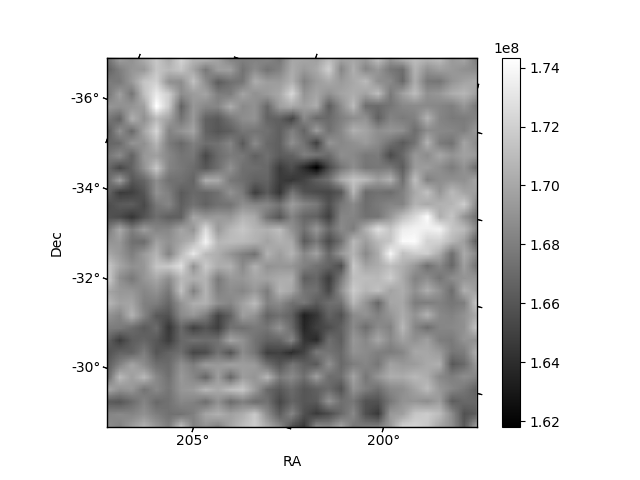
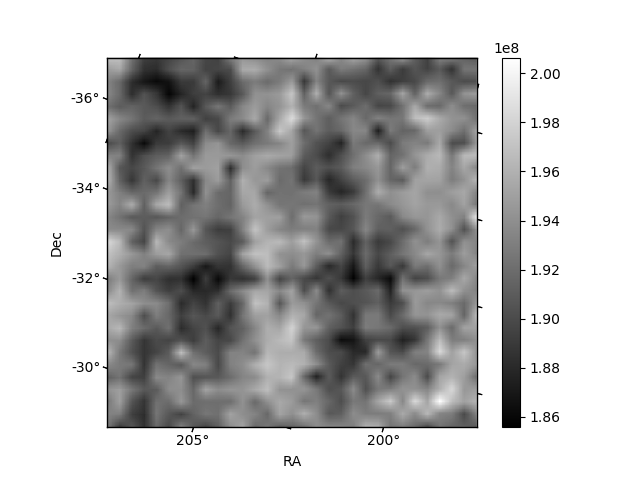
Histogram calculated using DETX and DETY for each event in the final _common_clean file
| Quadrant A |  |
 |
Quadrant B |
|---|---|---|---|
| Quadrant D |  |
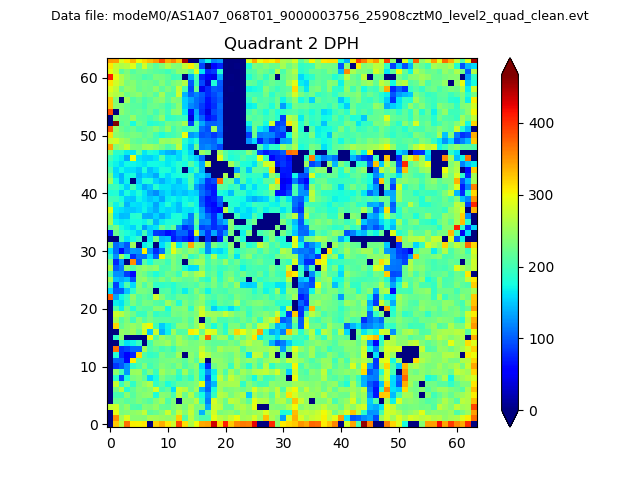 |
Quadrant C |
| Plot type | Count rate plots | Images |
|---|---|---|
| Comparison with Poisson distribution Blue bars denote a histogram of data divided into 1 sec bins. Red curve is a Poisson curve with rate = median count rate of data. |
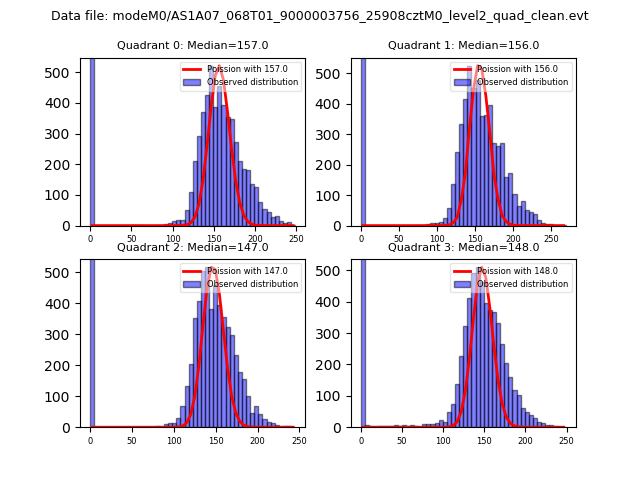 |
 |
| Quadrant-wise count rates Data is divided into 100 sec bins |
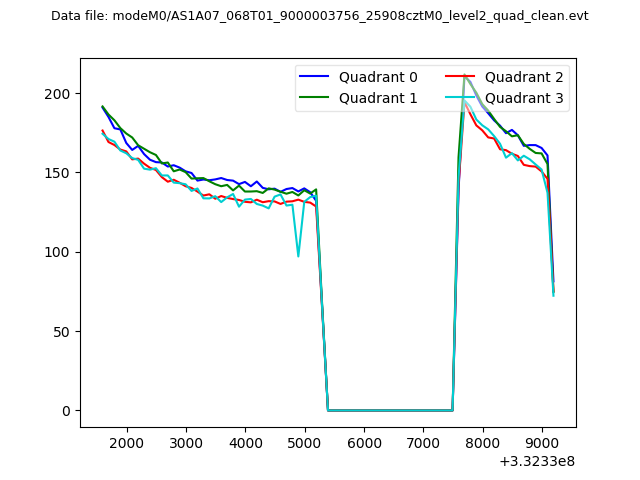 |
|
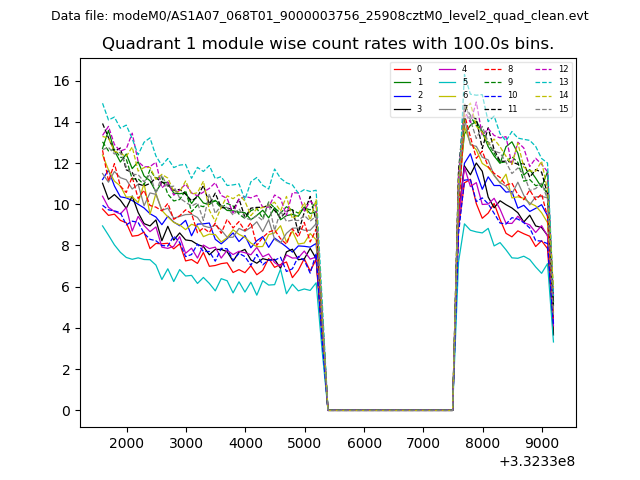
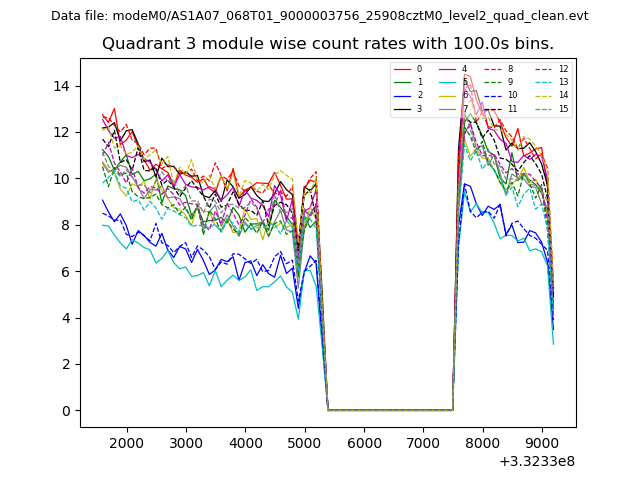
| Module-wise count rates for Quadrant A Data is divided into 100 sec bins |
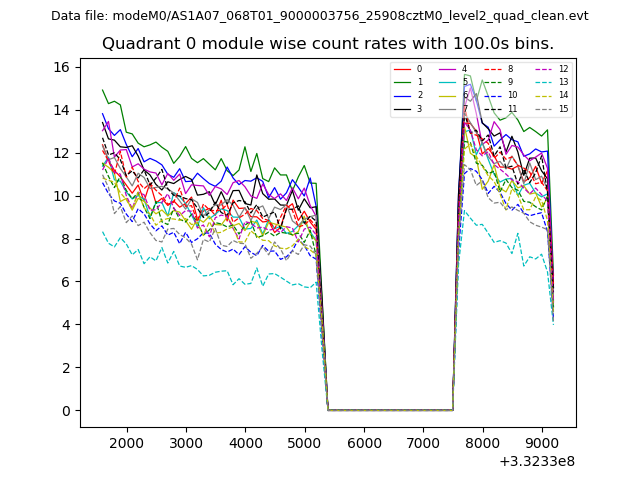 |
 |
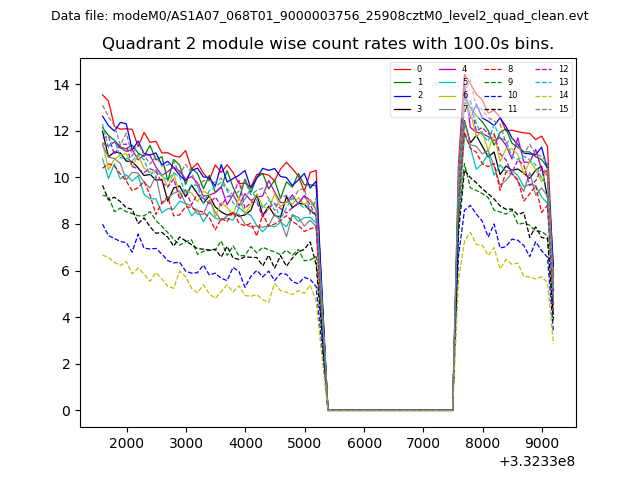
| Module-wise count rates for Quadrant B Data is divided into 100 sec bins |
 |
 |
| Module-wise count rates for Quadrant C Data is divided into 100 sec bins |
 |
 |
| Module-wise count rates for Quadrant D Data is divided into 100 sec bins |
 |
 |
| Parameter | Plot |
|---|---|
| CZT HV Monitor |  |
| D_VDD | 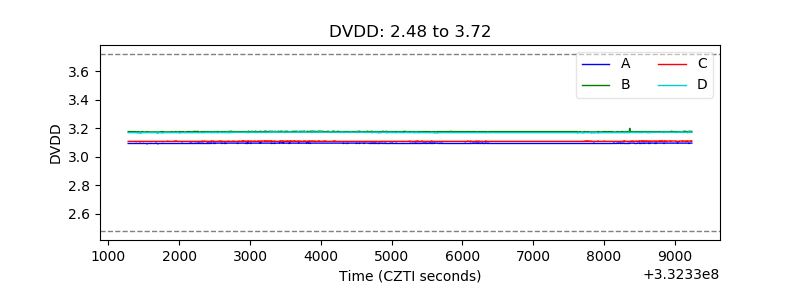 |
| Temperature 1 | 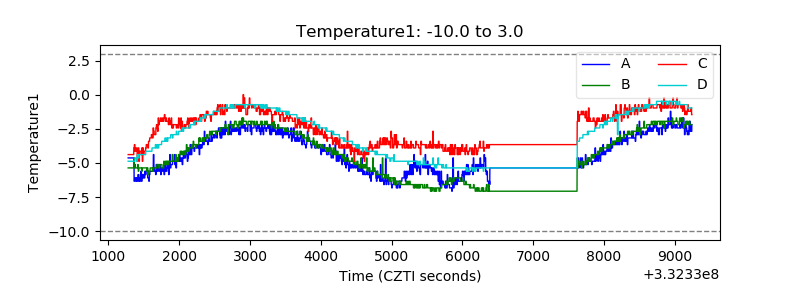 |
| Veto HV Monitor | 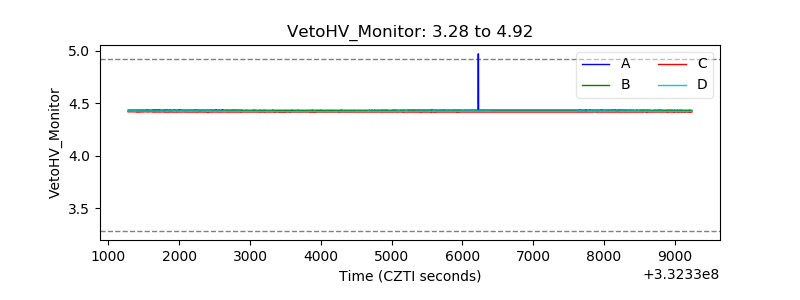 |
| Veto LLD | 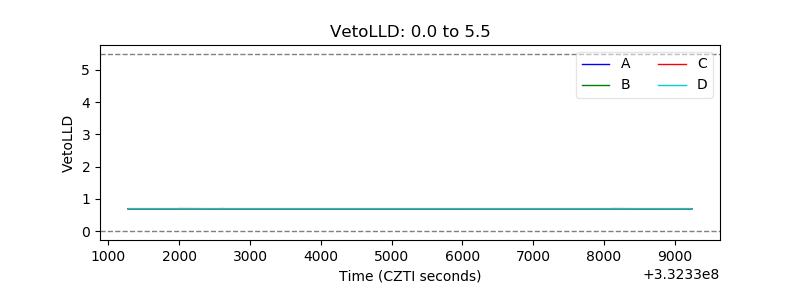 |
| Alpha Counter | 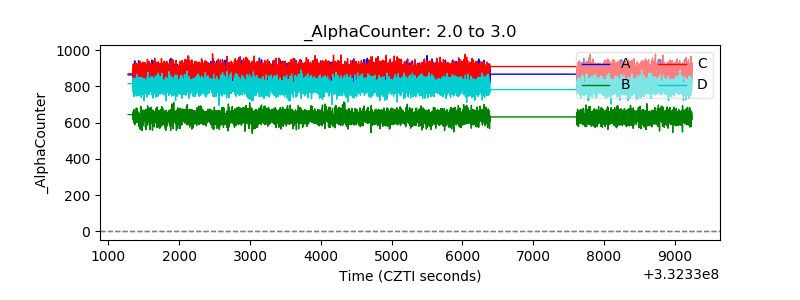 |
| _CPM_Rate | 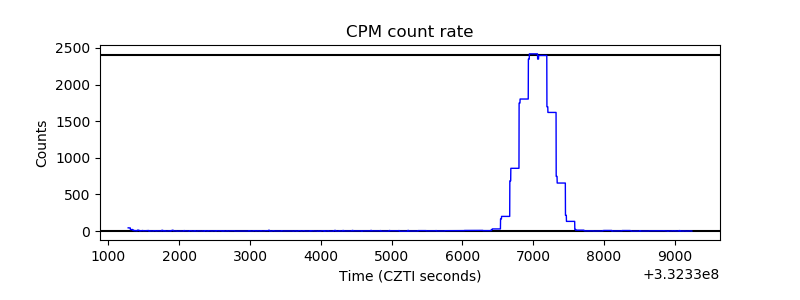 |
| CZT Counter |  |
| +2.5 Volts monitor |  |
| +5 Volts monitor | 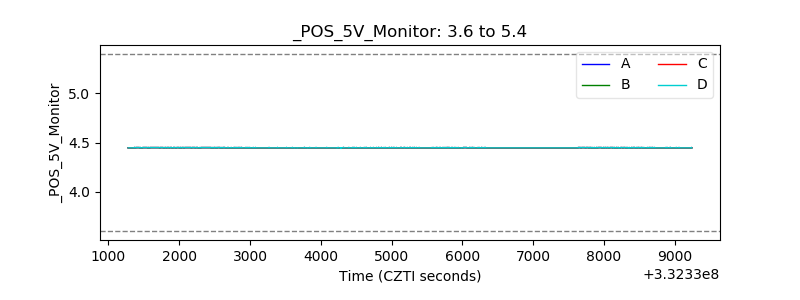 |
| _ROLL_ROT | 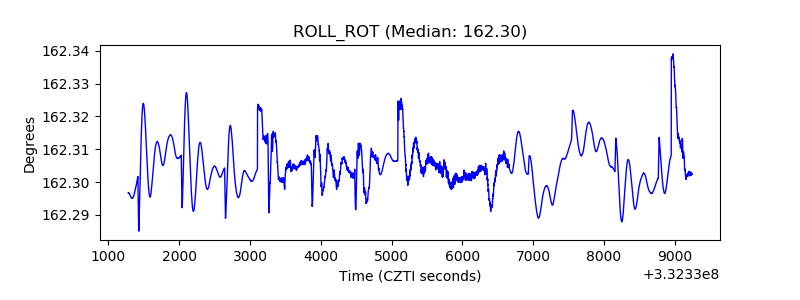 |
| _Roll_DEC | 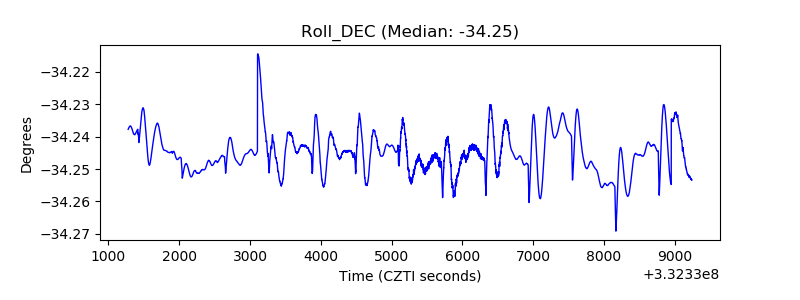 |
| _Roll_RA |  |
| Veto Counter | 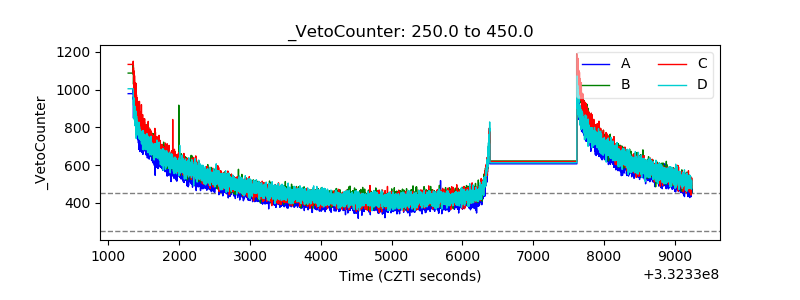 |