| Param | Original file | Final file |
|---|---|---|
| Filename | modeM0/AS1A07_068T01_9000003756_25909cztM0_level2.evt | modeM0/AS1A07_068T01_9000003756_25909cztM0_level2_quad_clean.evt |
| Size (bytes) | 483,776,640 | 97,064,640 |
| Size | 461.4 MB | 92.6 MB |
| Events in quadrant A | 3,313,432 | 672,066 |
| Events in quadrant B | 2,957,956 | 666,635 |
| Events in quadrant C | 2,938,237 | 621,934 |
| Events in quadrant D | 5,066,483 | 591,937 |
| Mode M0 | |||
|---|---|---|---|
| Quadrant | BADHDUFLAG | Total packets | Discarded packets |
| A | 0 | 13549 | 0 |
| B | 0 | 12197 | 0 |
| C | 0 | 12210 | 0 |
| D | 0 | 18917 | 0 |
| Mode M9 | |||
|---|---|---|---|
| Quadrant | BADHDUFLAG | Total packets | Discarded packets |
| A | 0 | 12 | 0 |
| B | 0 | 12 | 0 |
| C | 0 | 12 | 0 |
| D | 0 | 12 | 0 |
| Quadrant | Total seconds | Saturated seconds | Saturation percentage |
|---|---|---|---|
| A | 5525 | 99 | 1.791855% |
| B | 5526 | 98 | 1.773435% |
| C | 5526 | 116 | 2.099168% |
| D | 5526 | 539 | 9.753891% |
Noise dominated data is calculated using 1-second bins in cleaned event files. If a bin has >2000 counts, and if more than 50% of those come from <1% of pixels, then it is considered to be noise-dominated and hence unusable.
| Quadrant | # 1 sec bins | Bins with >0 counts | Bins with >2000 counts | High rate bins dominated by noise | Noise dominated (total time) | Noise dominated (detector-on time) | Marked lightcurve |
|---|---|---|---|---|---|---|---|
| A | 6800 | 5526 | 1 | 1 | 0.01% | 0.02% | 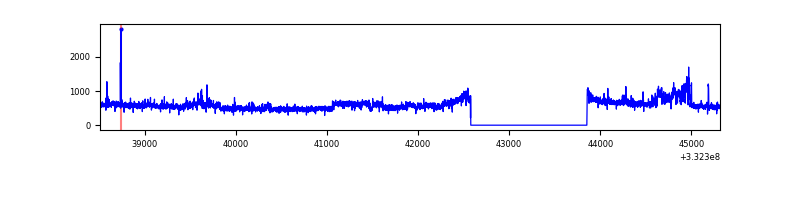 |
| B | 6801 | 5527 | 12 | 12 | 0.18% | 0.22% | 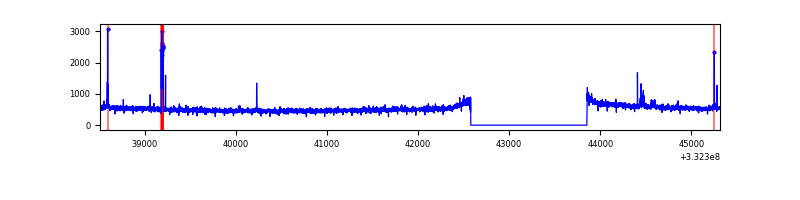 |
| C | 6801 | 5527 | 0 | 0 | 0.00% | 0.00% | 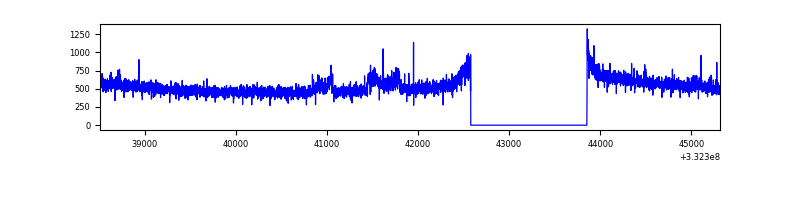 |
| D | 6801 | 5526 | 409 | 409 | 6.01% | 7.40% | 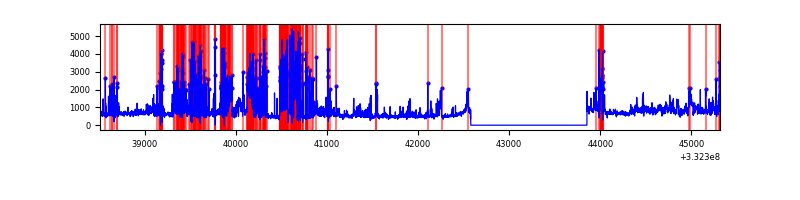 |
Top three noisy pixels from each quadrant. If the there are fewer than three noisy pixels in the level2.evt file, extra rows are filled as -1
| Pixel properties | Quadrant properties | ||||||
|---|---|---|---|---|---|---|---|
| Quadrant | DetID | PixID | Counts | Sigma | Mean | Median | Sigma |
| A | 0 | 13 | 393813 | 2590.72 | 757 | 744 | 151.7 |
| A | 13 | 254 | 7791 | 46.45 | 757 | 744 | 151.7 |
| A | 0 | 226 | 6693 | 39.21 | 757 | 744 | 151.7 |
| B | 10 | 245 | 49352 | 349.32 | 735 | 719 | 139.2 |
| B | 0 | 190 | 19060 | 131.74 | 735 | 719 | 139.2 |
| B | 12 | 111 | 16077 | 110.31 | 735 | 719 | 139.2 |
| C | 14 | 238 | 113873 | 695.98 | 701 | 706 | 162.6 |
| C | 3 | 233 | 92376 | 563.77 | 701 | 706 | 162.6 |
| C | 13 | 61 | 4969 | 26.22 | 701 | 706 | 162.6 |
| D | 1 | 52 | 2158517 | 12984.71 | 697 | 679 | 166.2 |
| D | 7 | 80 | 215018 | 1289.78 | 697 | 679 | 166.2 |
| D | 13 | 168 | 34161 | 201.48 | 697 | 679 | 166.2 |
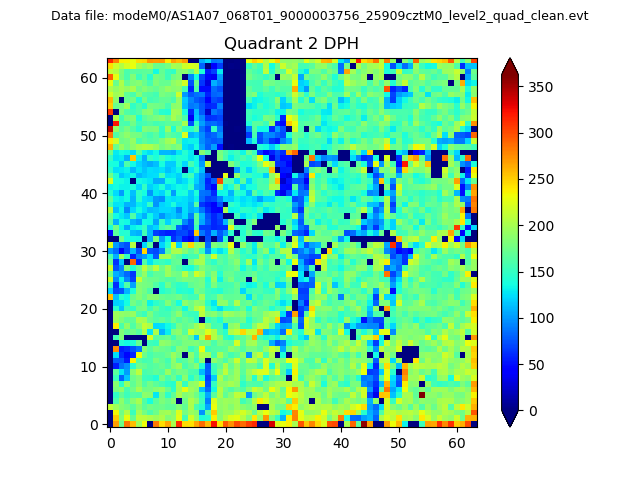
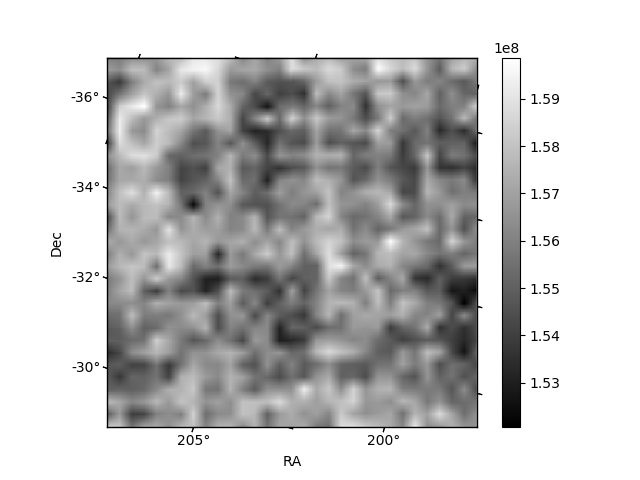
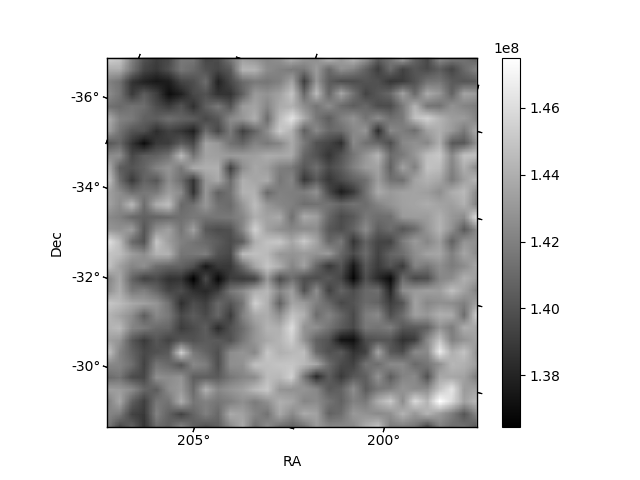
Histogram calculated using DETX and DETY for each event in the final _common_clean file
| Quadrant A |  |
 |
Quadrant B |
|---|---|---|---|
| Quadrant D | 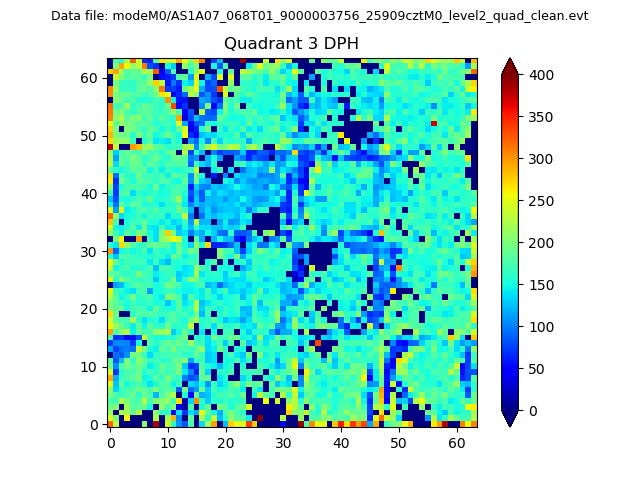 |
 |
Quadrant C |
| Plot type | Count rate plots | Images |
|---|---|---|
| Comparison with Poisson distribution Blue bars denote a histogram of data divided into 1 sec bins. Red curve is a Poisson curve with rate = median count rate of data. |
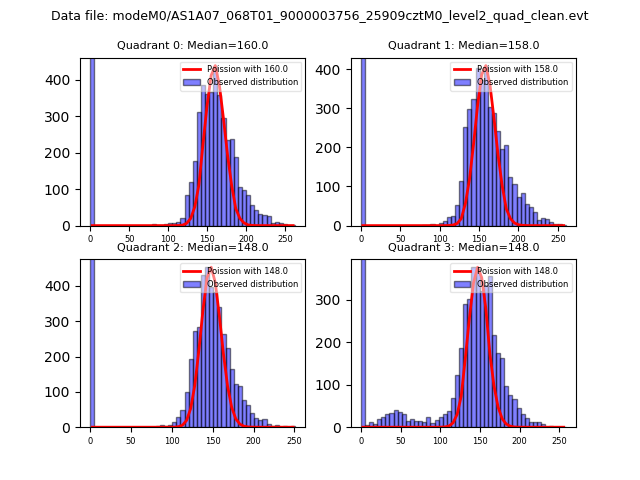 |
 |
| Quadrant-wise count rates Data is divided into 100 sec bins |
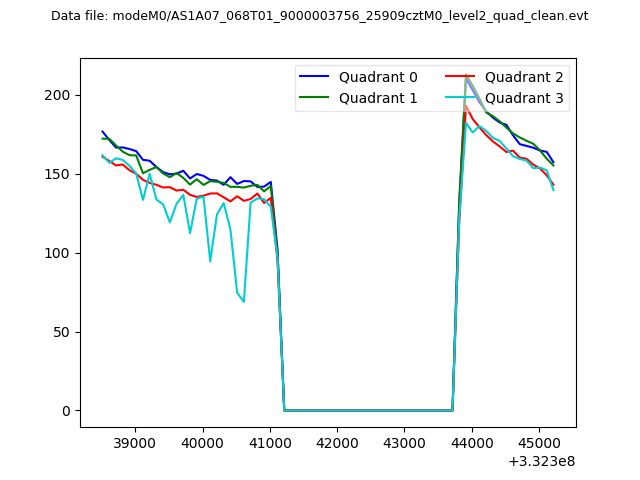 |
|
| Module-wise count rates for Quadrant A Data is divided into 100 sec bins |
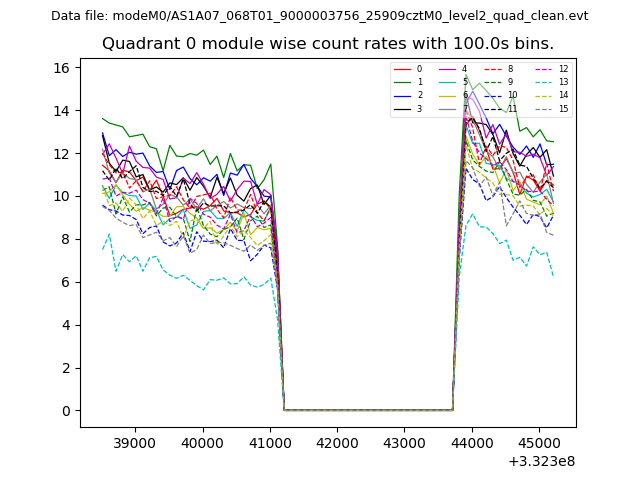 |
 |
| Module-wise count rates for Quadrant B Data is divided into 100 sec bins |
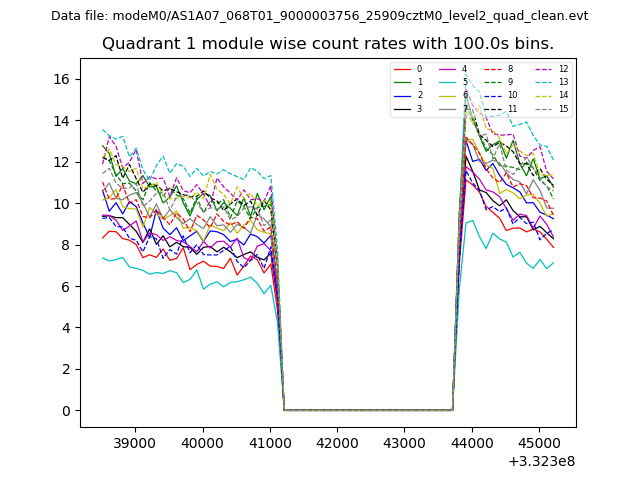 |
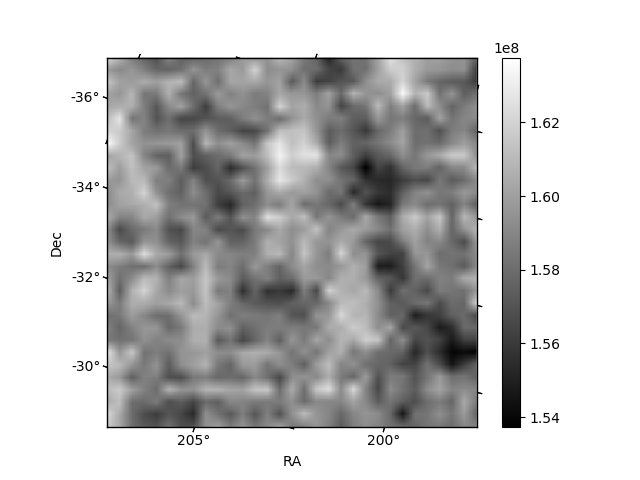 |
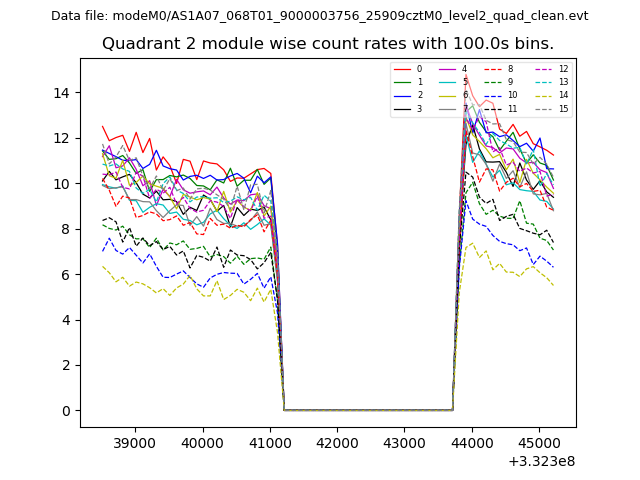
| Module-wise count rates for Quadrant C Data is divided into 100 sec bins |
 |
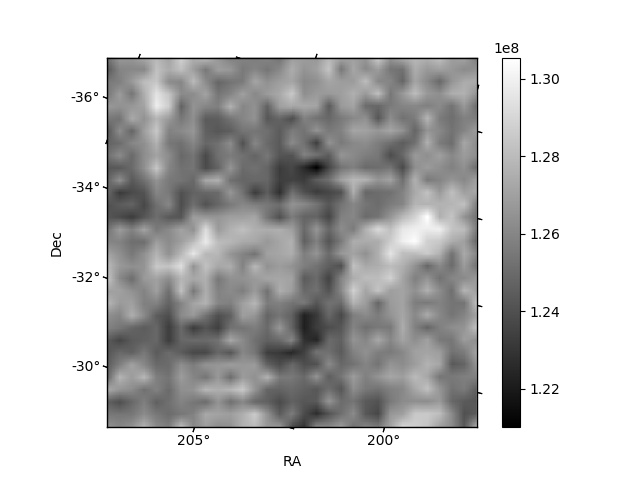 |
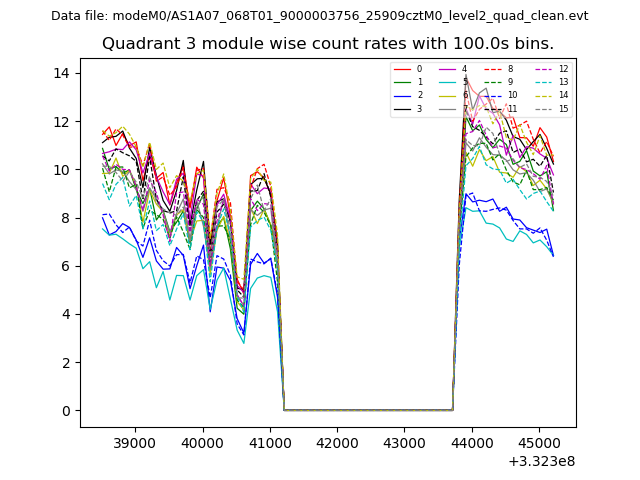
| Module-wise count rates for Quadrant D Data is divided into 100 sec bins |
 |
 |
| Parameter | Plot |
|---|---|
| CZT HV Monitor | 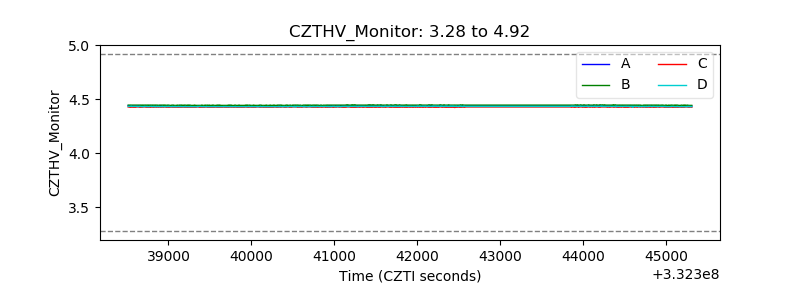 |
| D_VDD | 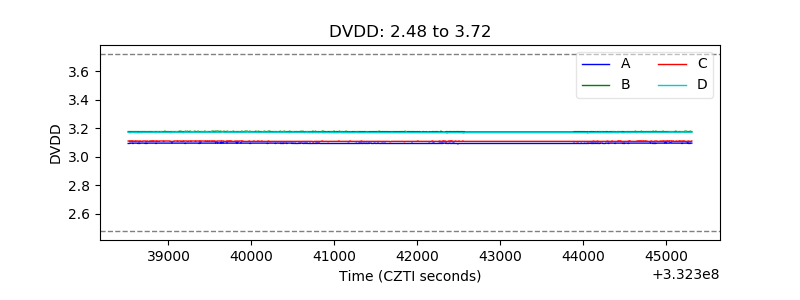 |
| Temperature 1 | 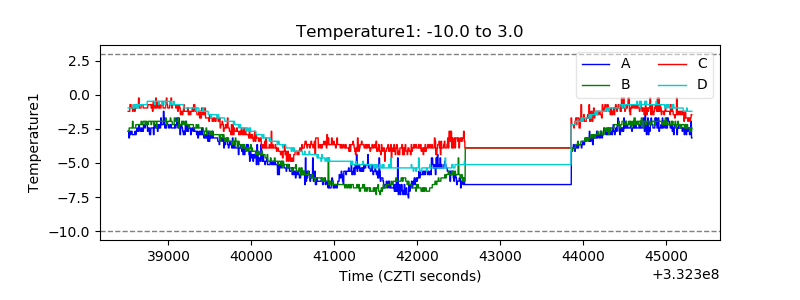 |
| Veto HV Monitor |  |
| Veto LLD | 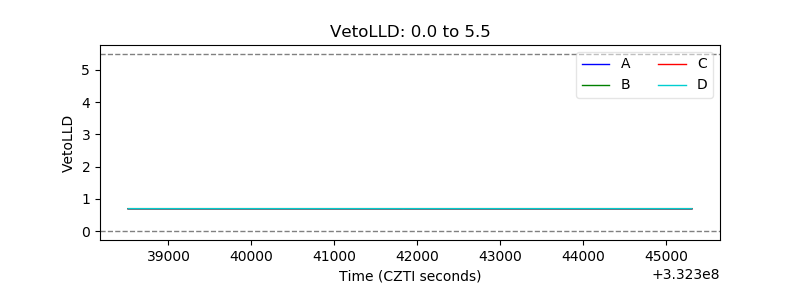 |
| Alpha Counter | 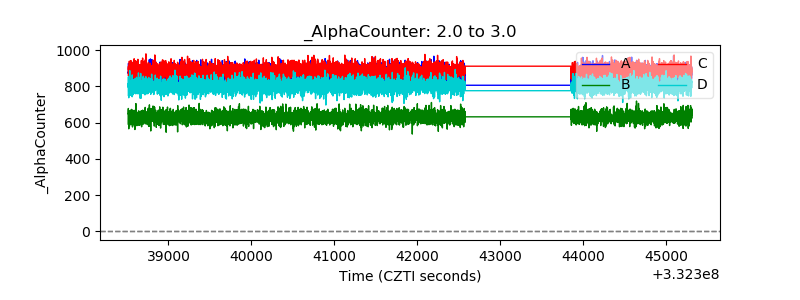 |
| _CPM_Rate | 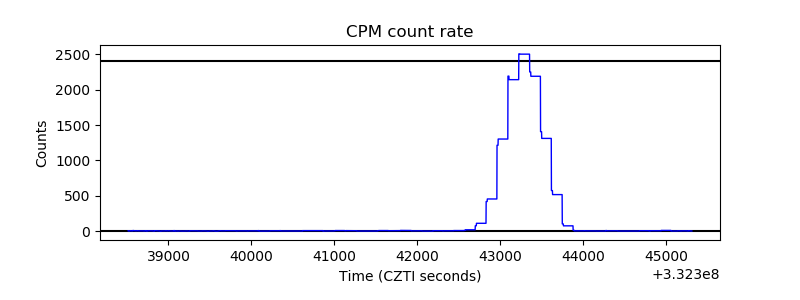 |
| CZT Counter | 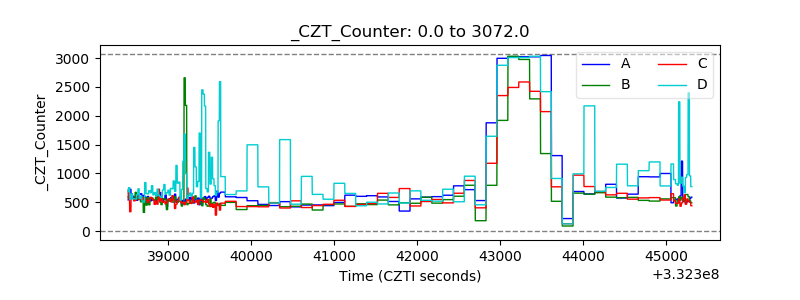 |
| +2.5 Volts monitor | 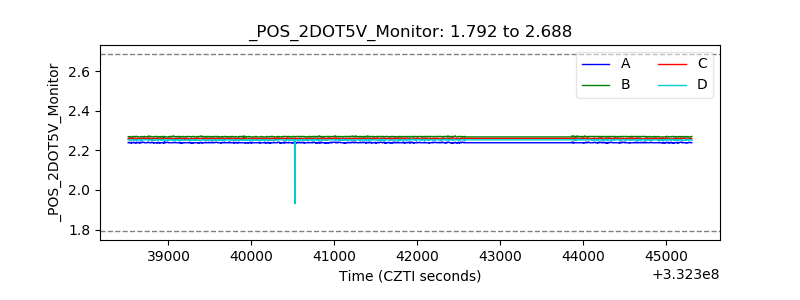 |
| +5 Volts monitor |  |
| _ROLL_ROT | 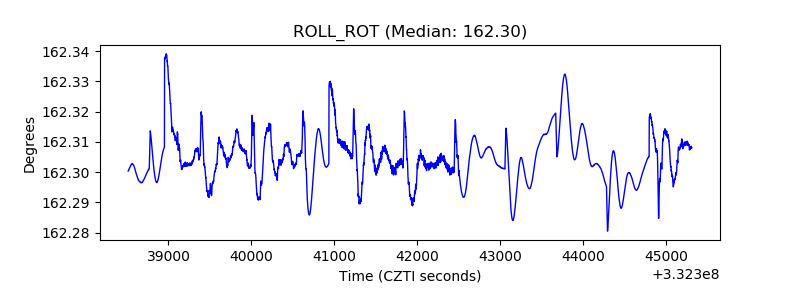 |
| _Roll_DEC | 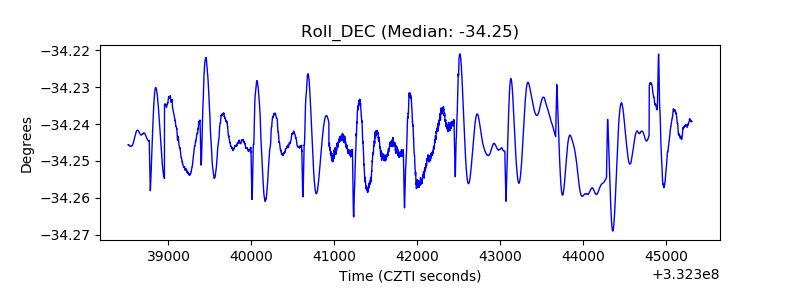 |
| _Roll_RA |  |
| Veto Counter | 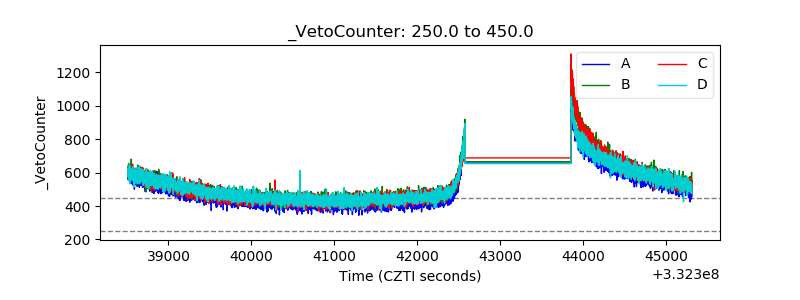 |