| Param | Original file | Final file |
|---|---|---|
| Filename | modeM0/AS1A07_068T01_9000003756_25910cztM0_level2.evt | modeM0/AS1A07_068T01_9000003756_25910cztM0_level2_quad_clean.evt |
| Size (bytes) | 512,542,080 | 100,244,160 |
| Size | 488.8 MB | 95.6 MB |
| Events in quadrant A | 3,758,600 | 679,660 |
| Events in quadrant B | 3,224,326 | 678,603 |
| Events in quadrant C | 3,113,408 | 631,867 |
| Events in quadrant D | 5,018,343 | 625,552 |
| Mode M0 | |||
|---|---|---|---|
| Quadrant | BADHDUFLAG | Total packets | Discarded packets |
| A | 0 | 15067 | 0 |
| B | 0 | 13279 | 0 |
| C | 0 | 12954 | 0 |
| D | 0 | 19080 | 0 |
| Mode M9 | |||
|---|---|---|---|
| Quadrant | BADHDUFLAG | Total packets | Discarded packets |
| A | 0 | 13 | 0 |
| B | 0 | 13 | 0 |
| C | 0 | 13 | 0 |
| D | 0 | 13 | 0 |
| Quadrant | Total seconds | Saturated seconds | Saturation percentage |
|---|---|---|---|
| A | 6011 | 125 | 2.079521% |
| B | 6012 | 101 | 1.679973% |
| C | 6012 | 106 | 1.763140% |
| D | 6012 | 279 | 4.640719% |
Noise dominated data is calculated using 1-second bins in cleaned event files. If a bin has >2000 counts, and if more than 50% of those come from <1% of pixels, then it is considered to be noise-dominated and hence unusable.
| Quadrant | # 1 sec bins | Bins with >0 counts | Bins with >2000 counts | High rate bins dominated by noise | Noise dominated (total time) | Noise dominated (detector-on time) | Marked lightcurve |
|---|---|---|---|---|---|---|---|
| A | 7326 | 6012 | 25 | 25 | 0.34% | 0.42% | 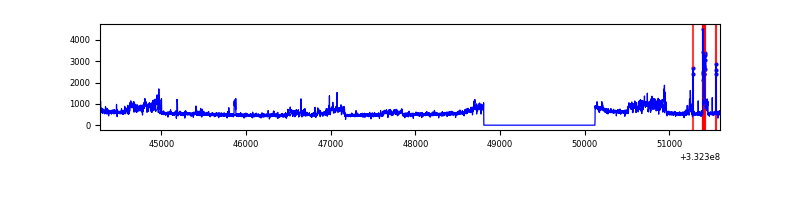 |
| B | 7327 | 6013 | 4 | 4 | 0.05% | 0.07% | 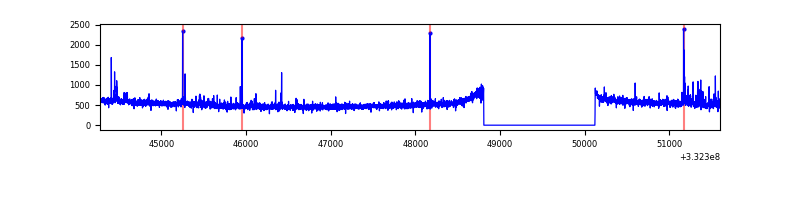 |
| C | 7327 | 6013 | 0 | 0 | 0.00% | 0.00% | 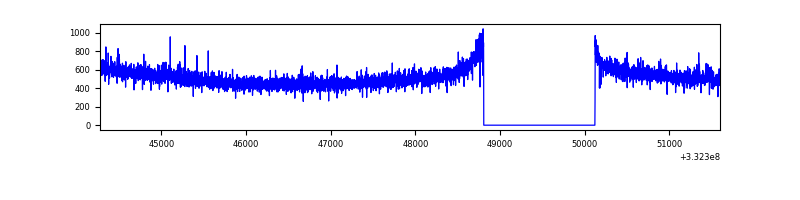 |
| D | 7327 | 6013 | 189 | 189 | 2.58% | 3.14% | 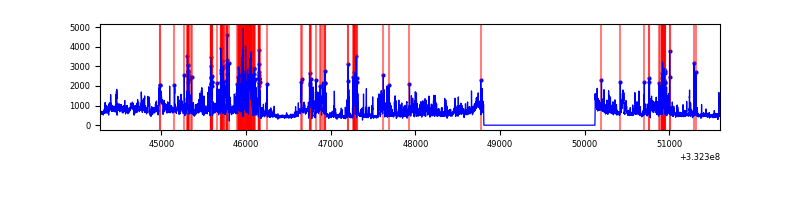 |
Top three noisy pixels from each quadrant. If the there are fewer than three noisy pixels in the level2.evt file, extra rows are filled as -1
| Pixel properties | Quadrant properties | ||||||
|---|---|---|---|---|---|---|---|
| Quadrant | DetID | PixID | Counts | Sigma | Mean | Median | Sigma |
| A | 0 | 13 | 603855 | 3707.34 | 817 | 806 | 162.7 |
| A | 13 | 254 | 8575 | 47.76 | 817 | 806 | 162.7 |
| A | 0 | 226 | 7294 | 39.89 | 817 | 806 | 162.7 |
| B | 10 | 245 | 53197 | 346.58 | 797 | 782 | 151.2 |
| B | 0 | 229 | 27465 | 176.43 | 797 | 782 | 151.2 |
| B | 0 | 190 | 25970 | 166.55 | 797 | 782 | 151.2 |
| C | 14 | 238 | 123791 | 704.18 | 755 | 763 | 174.7 |
| C | 3 | 233 | 47836 | 269.43 | 755 | 763 | 174.7 |
| C | 13 | 61 | 5285 | 25.88 | 755 | 763 | 174.7 |
| D | 1 | 52 | 1790190 | 9767.52 | 771 | 752 | 183.2 |
| D | 7 | 80 | 250556 | 1363.54 | 771 | 752 | 183.2 |
| D | 13 | 168 | 34144 | 182.27 | 771 | 752 | 183.2 |
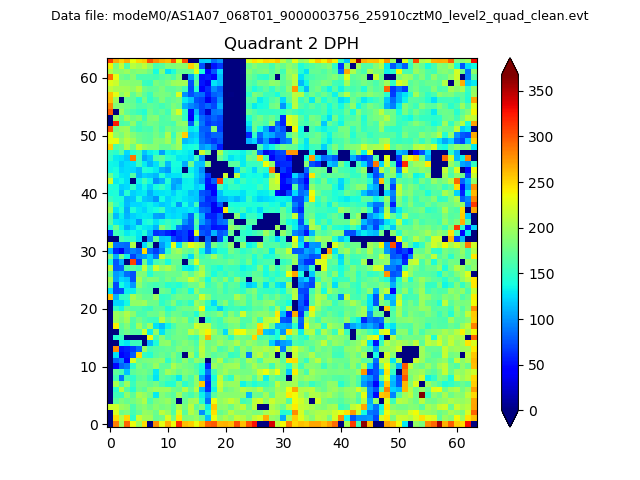
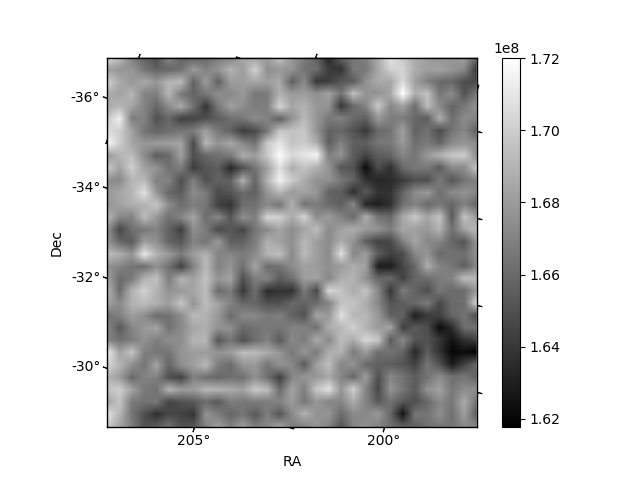
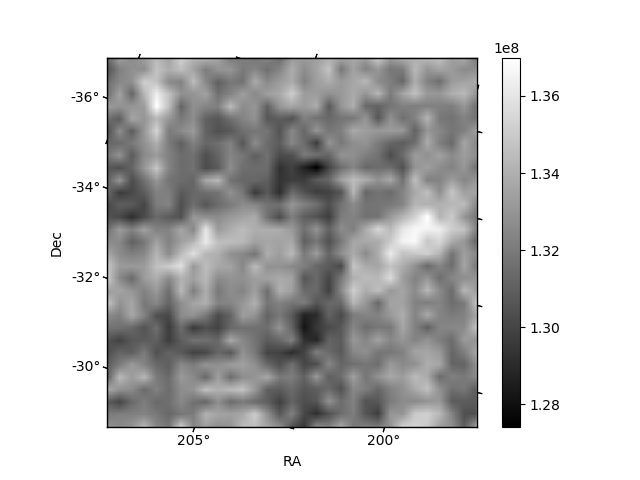
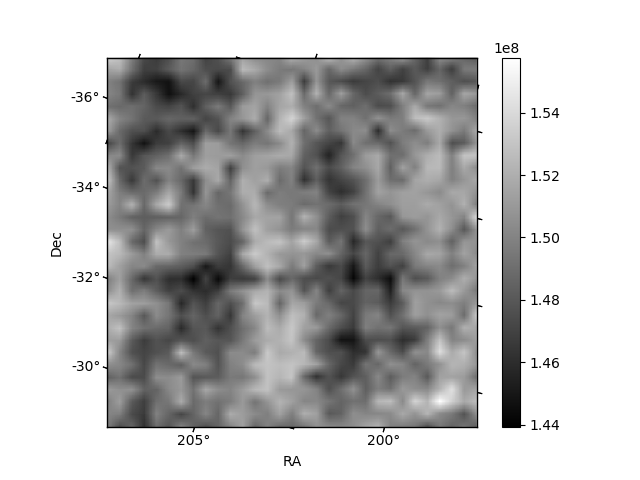
Histogram calculated using DETX and DETY for each event in the final _common_clean file
| Quadrant A | 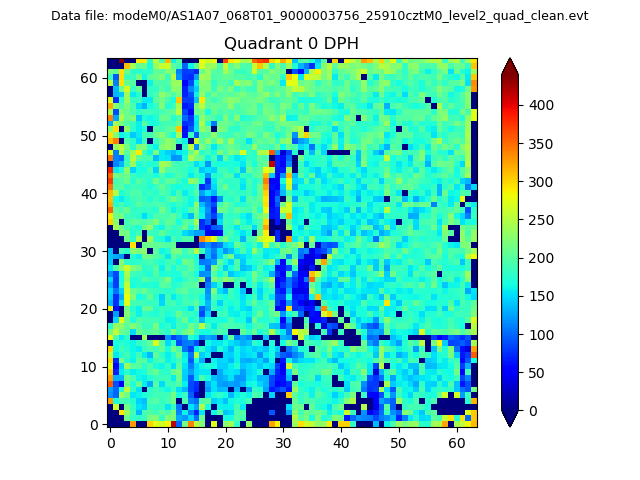 |
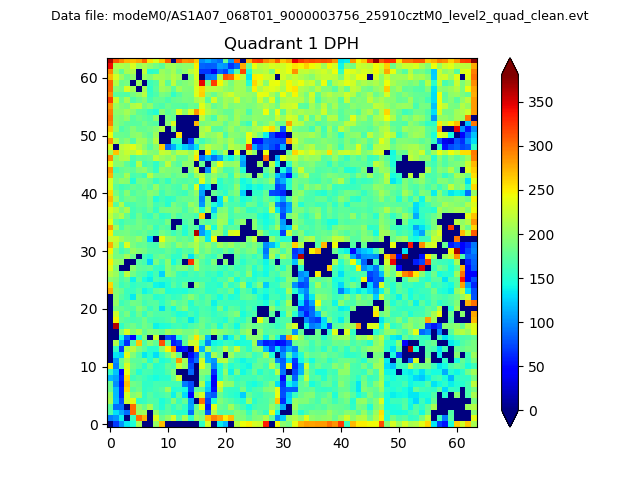 |
Quadrant B |
|---|---|---|---|
| Quadrant D | 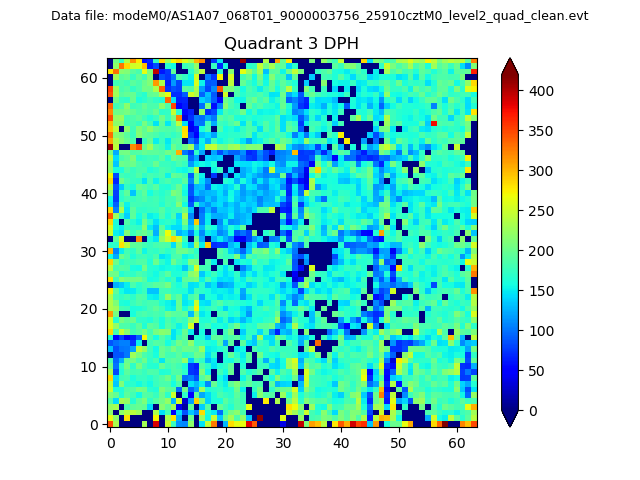 |
 |
Quadrant C |
| Plot type | Count rate plots | Images |
|---|---|---|
| Comparison with Poisson distribution Blue bars denote a histogram of data divided into 1 sec bins. Red curve is a Poisson curve with rate = median count rate of data. |
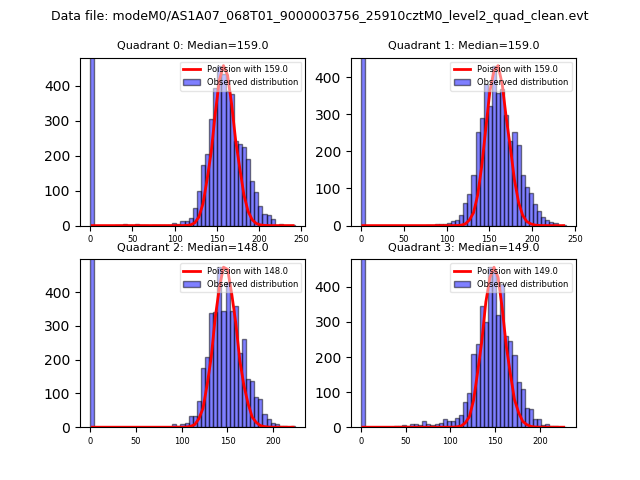 |
 |
| Quadrant-wise count rates Data is divided into 100 sec bins |
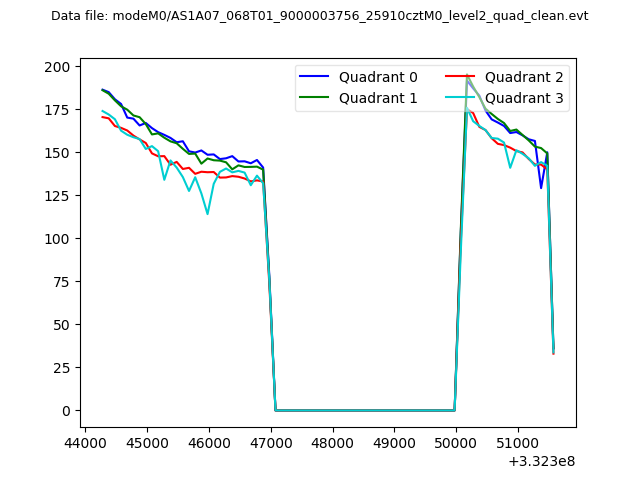 |
|
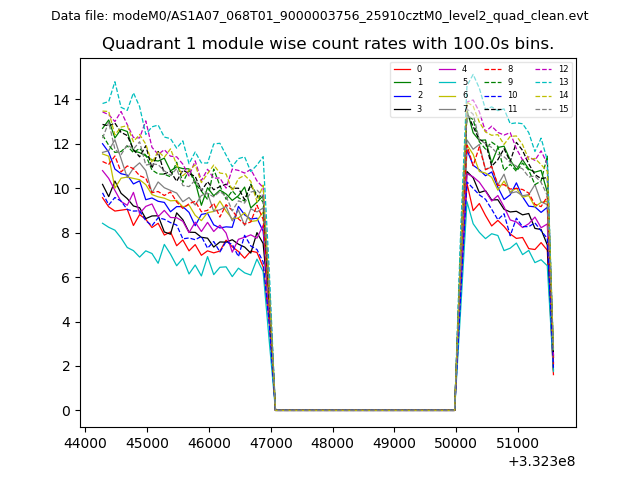
| Module-wise count rates for Quadrant A Data is divided into 100 sec bins |
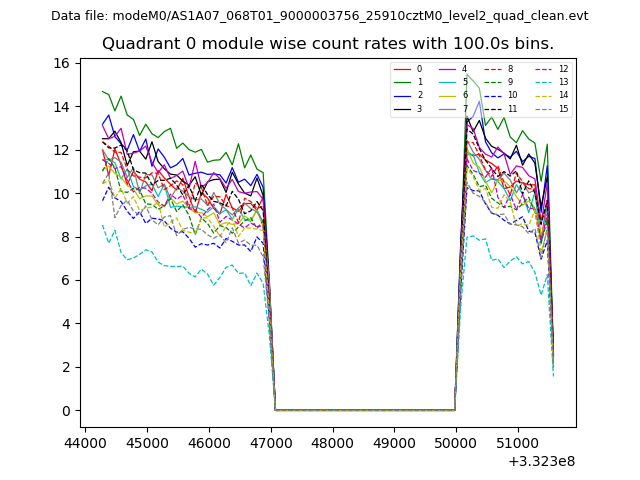 |
 |
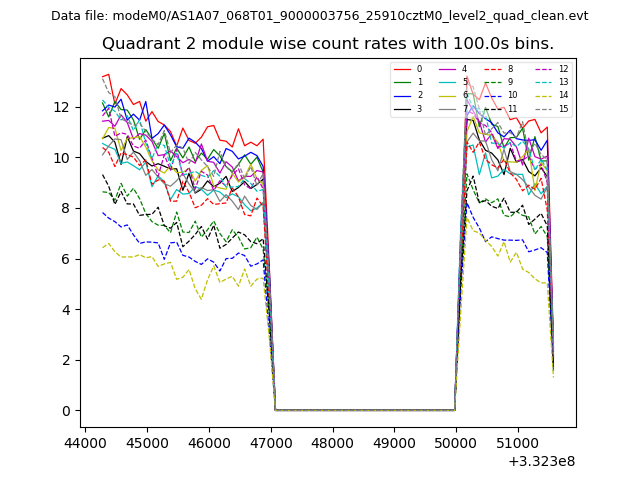
| Module-wise count rates for Quadrant B Data is divided into 100 sec bins |
 |
 |
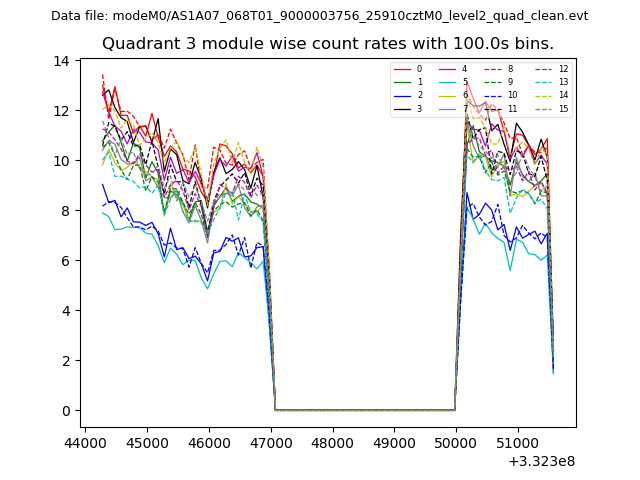
| Module-wise count rates for Quadrant C Data is divided into 100 sec bins |
 |
 |
| Module-wise count rates for Quadrant D Data is divided into 100 sec bins |
 |
 |
| Parameter | Plot |
|---|---|
| CZT HV Monitor | 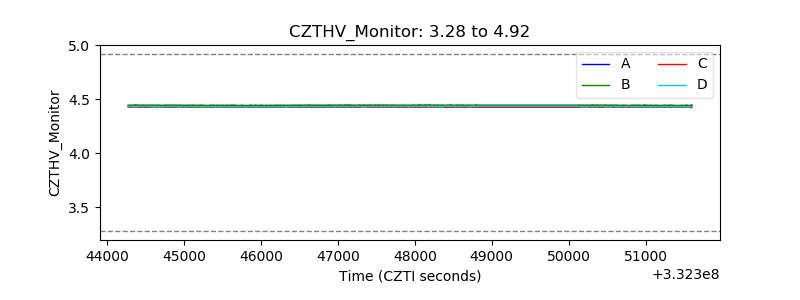 |
| D_VDD | 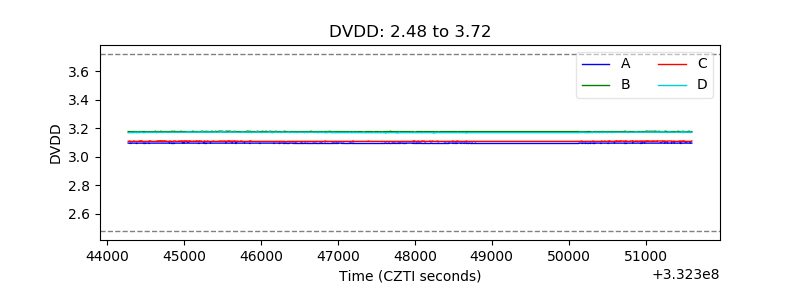 |
| Temperature 1 | 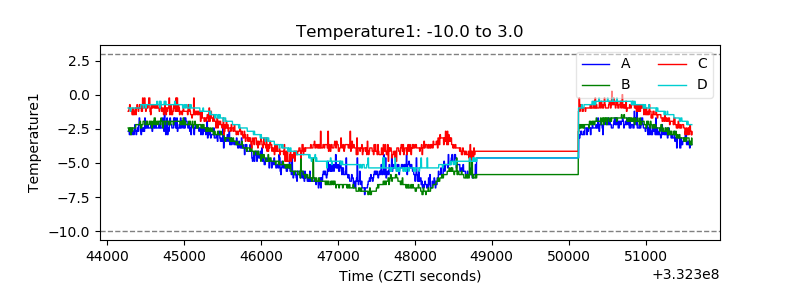 |
| Veto HV Monitor | 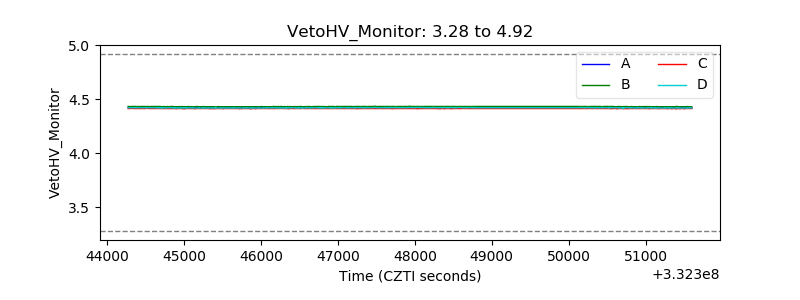 |
| Veto LLD | 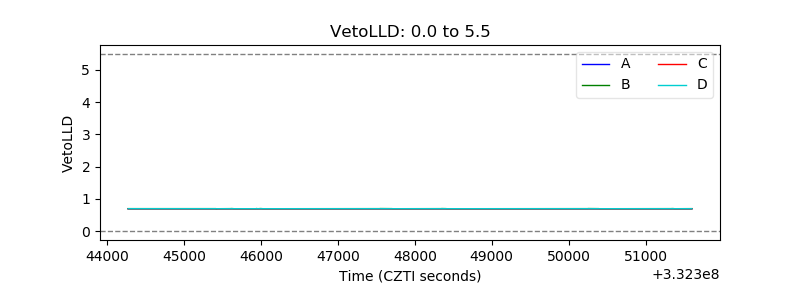 |
| Alpha Counter | 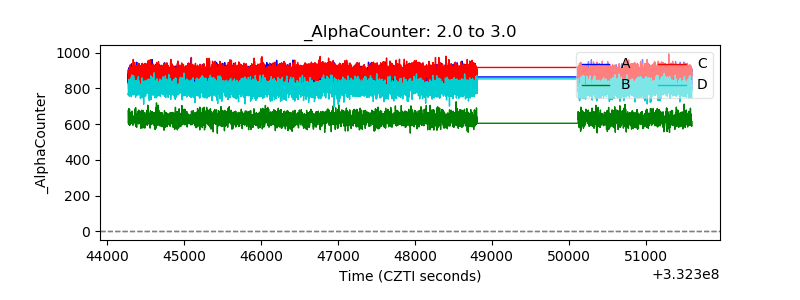 |
| _CPM_Rate | 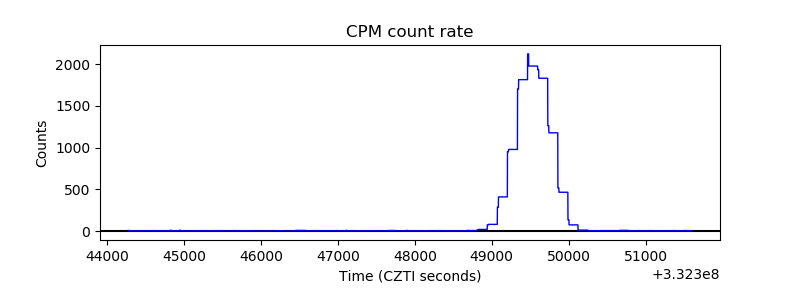 |
| CZT Counter | 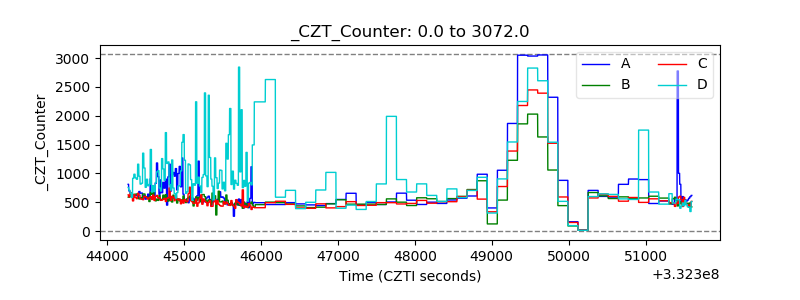 |
| +2.5 Volts monitor |  |
| +5 Volts monitor |  |
| _ROLL_ROT | 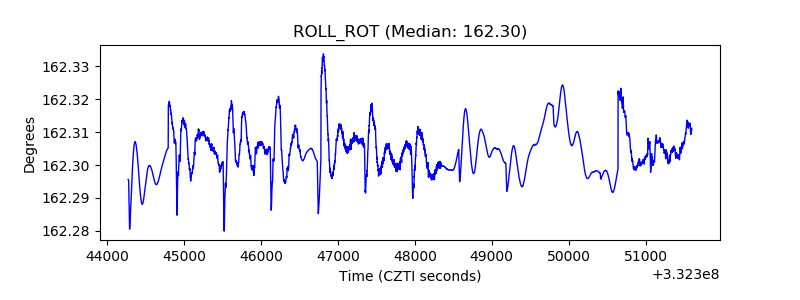 |
| _Roll_DEC | 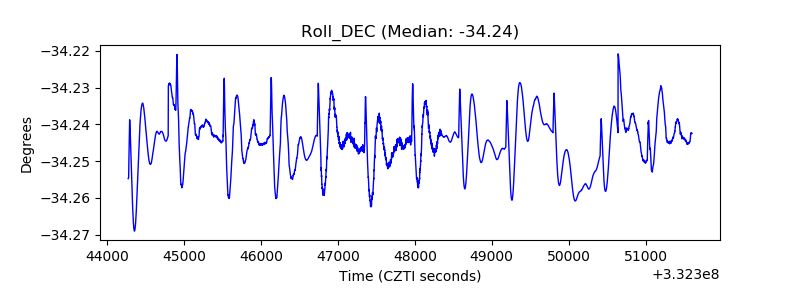 |
| _Roll_RA | 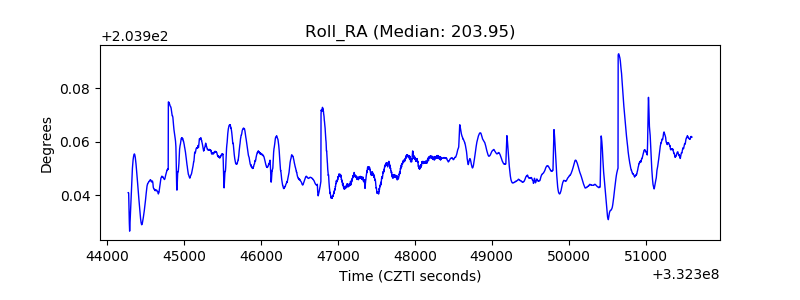 |
| Veto Counter | 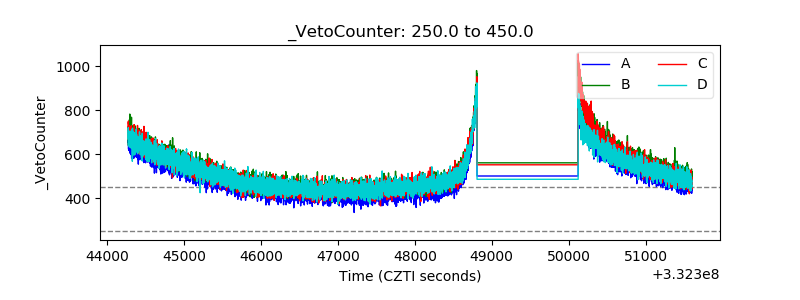 |