| Param | Original file | Final file |
|---|---|---|
| Filename | modeM0/AS1A07_068T01_9000003756_25911cztM0_level2.evt | modeM0/AS1A07_068T01_9000003756_25911cztM0_level2_quad_clean.evt |
| Size (bytes) | 697,152,960 | 96,661,440 |
| Size | 664.9 MB | 92.2 MB |
| Events in quadrant A | 8,586,327 | 560,688 |
| Events in quadrant B | 3,381,970 | 672,004 |
| Events in quadrant C | 3,287,339 | 627,011 |
| Events in quadrant D | 5,422,786 | 617,751 |
| Mode M0 | |||
|---|---|---|---|
| Quadrant | BADHDUFLAG | Total packets | Discarded packets |
| A | 0 | 29899 | 0 |
| B | 0 | 14072 | 0 |
| C | 0 | 13841 | 0 |
| D | 0 | 20543 | 0 |
| Mode M9 | |||
|---|---|---|---|
| Quadrant | BADHDUFLAG | Total packets | Discarded packets |
| A | 0 | 12 | 0 |
| B | 0 | 13 | 0 |
| C | 0 | 13 | 0 |
| D | 0 | 13 | 0 |
| Quadrant | Total seconds | Saturated seconds | Saturation percentage |
|---|---|---|---|
| A | 6435 | 1750 | 27.195027% |
| B | 6434 | 52 | 0.808206% |
| C | 6434 | 66 | 1.025800% |
| D | 6434 | 377 | 5.859496% |
Noise dominated data is calculated using 1-second bins in cleaned event files. If a bin has >2000 counts, and if more than 50% of those come from <1% of pixels, then it is considered to be noise-dominated and hence unusable.
| Quadrant | # 1 sec bins | Bins with >0 counts | Bins with >2000 counts | High rate bins dominated by noise | Noise dominated (total time) | Noise dominated (detector-on time) | Marked lightcurve |
|---|---|---|---|---|---|---|---|
| A | 7730 | 6436 | 1423 | 1423 | 18.41% | 22.11% | 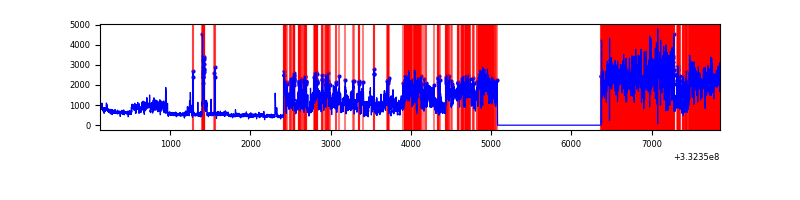 |
| B | 7729 | 6435 | 3 | 3 | 0.04% | 0.05% | 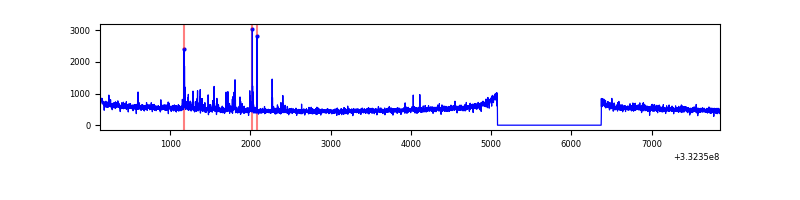 |
| C | 7729 | 6435 | 0 | 0 | 0.00% | 0.00% | 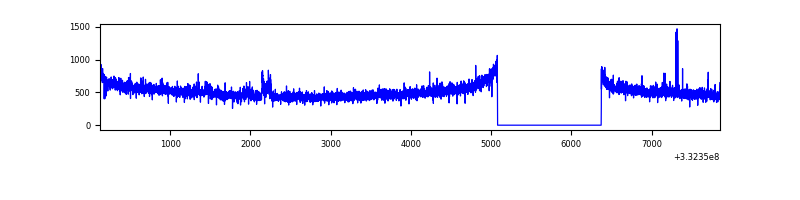 |
| D | 7729 | 6435 | 321 | 321 | 4.15% | 4.99% | 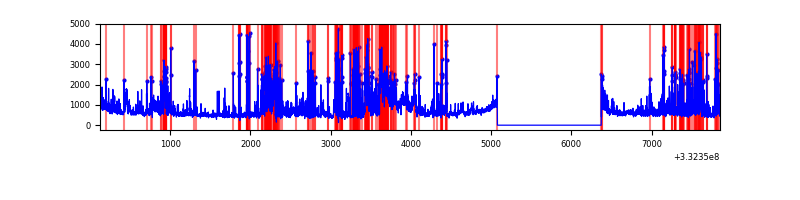 |
Top three noisy pixels from each quadrant. If the there are fewer than three noisy pixels in the level2.evt file, extra rows are filled as -1
| Pixel properties | Quadrant properties | ||||||
|---|---|---|---|---|---|---|---|
| Quadrant | DetID | PixID | Counts | Sigma | Mean | Median | Sigma |
| A | 0 | 13 | 5649937 | 37805.46 | 756 | 744 | 149.4 |
| A | 12 | 16 | 15974 | 101.92 | 756 | 744 | 149.4 |
| A | 13 | 254 | 8065 | 48.99 | 756 | 744 | 149.4 |
| B | 10 | 245 | 75392 | 468.69 | 836 | 816 | 159.1 |
| B | 0 | 190 | 21102 | 127.49 | 836 | 816 | 159.1 |
| B | 0 | 229 | 18849 | 113.33 | 836 | 816 | 159.1 |
| C | 14 | 238 | 129623 | 702.44 | 790 | 797 | 183.4 |
| C | 3 | 233 | 79230 | 427.67 | 790 | 797 | 183.4 |
| C | 13 | 61 | 5435 | 25.29 | 790 | 797 | 183.4 |
| D | 1 | 52 | 1314087 | 6912.74 | 798 | 779 | 190.0 |
| D | 7 | 80 | 1047888 | 5511.57 | 798 | 779 | 190.0 |
| D | 2 | 234 | 25311 | 129.13 | 798 | 779 | 190.0 |
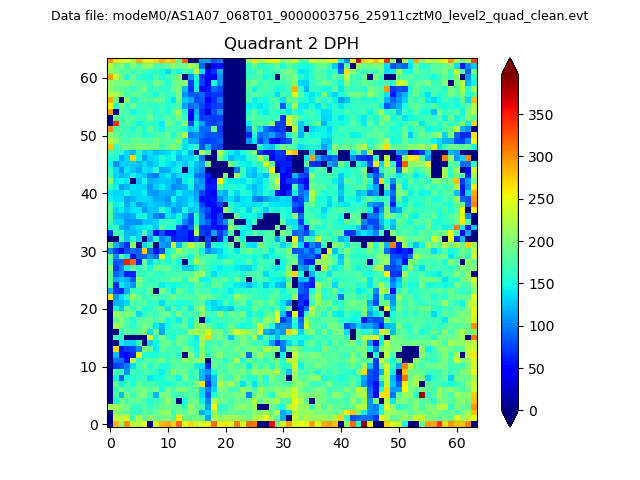
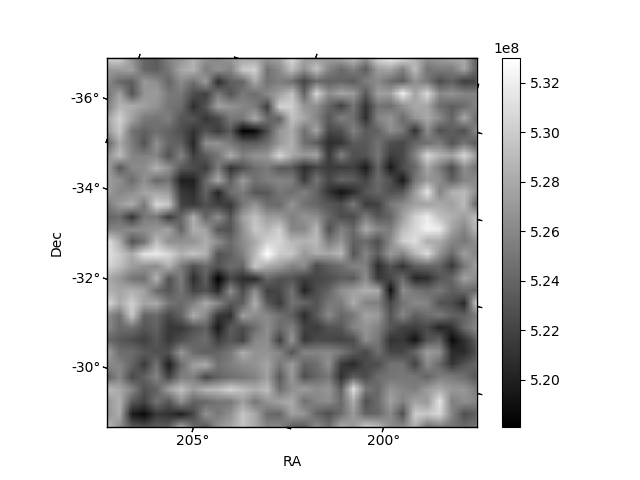
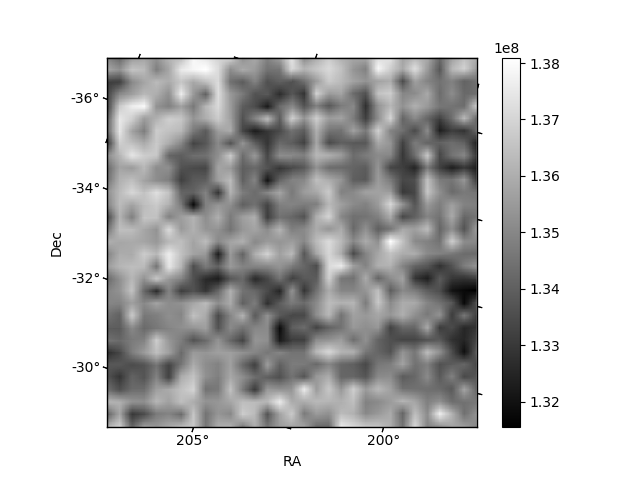
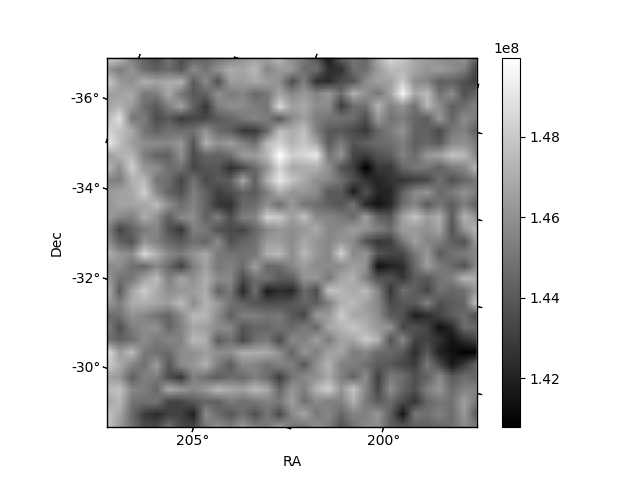
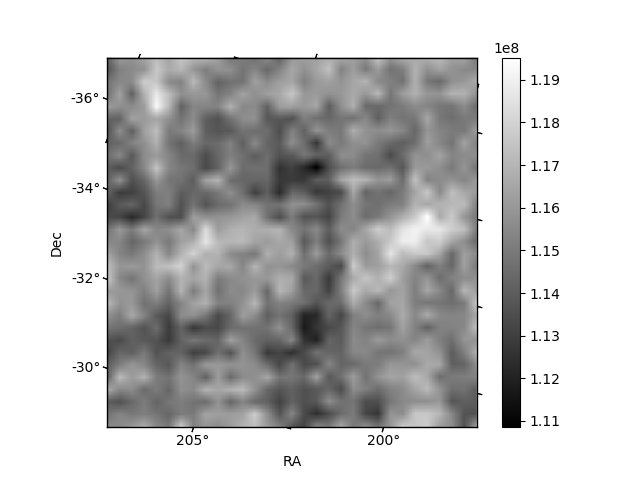
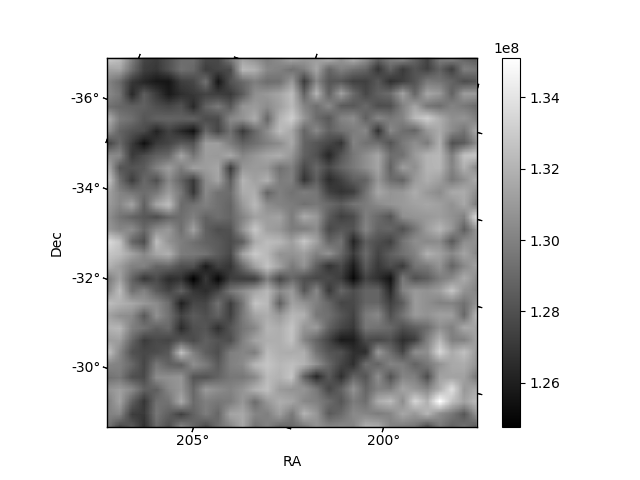
Histogram calculated using DETX and DETY for each event in the final _common_clean file
| Quadrant A | 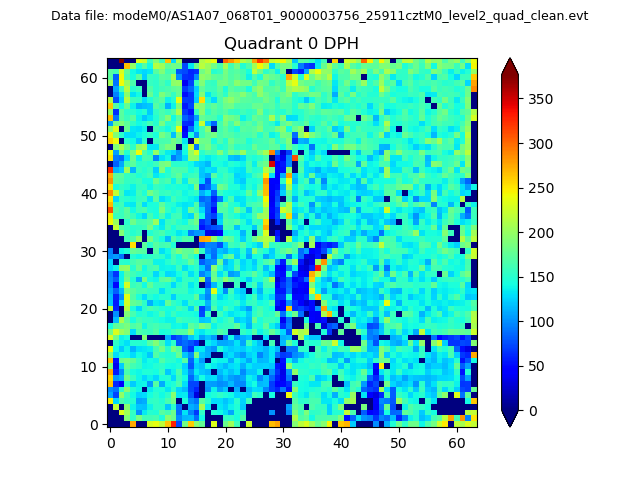 |
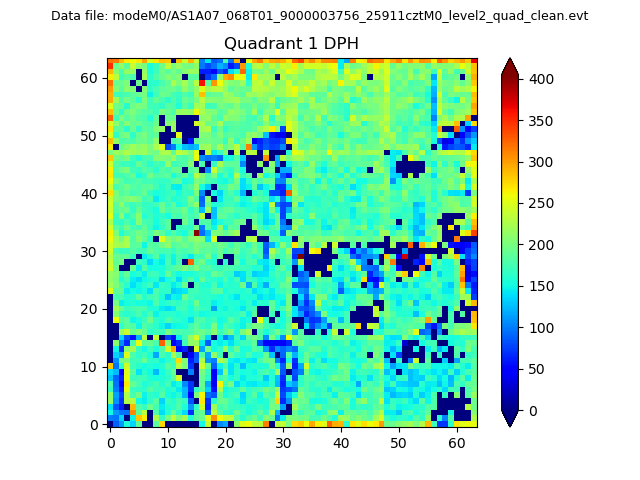 |
Quadrant B |
|---|---|---|---|
| Quadrant D | 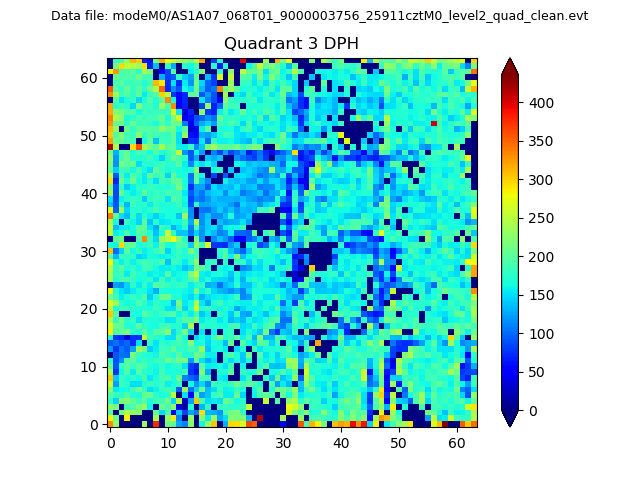 |
 |
Quadrant C |
| Plot type | Count rate plots | Images |
|---|---|---|
| Comparison with Poisson distribution Blue bars denote a histogram of data divided into 1 sec bins. Red curve is a Poisson curve with rate = median count rate of data. |
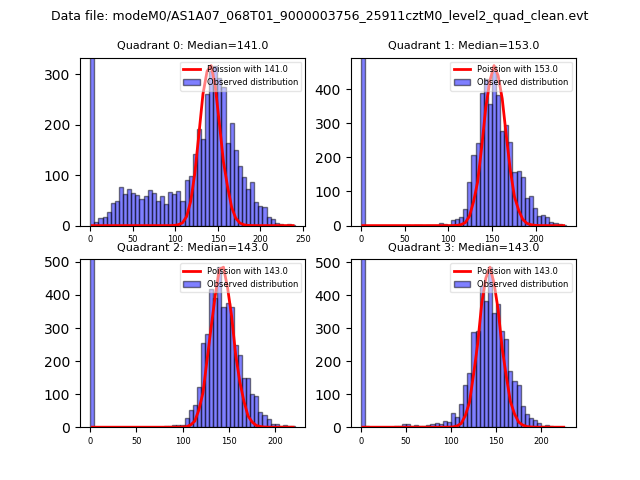 |
 |
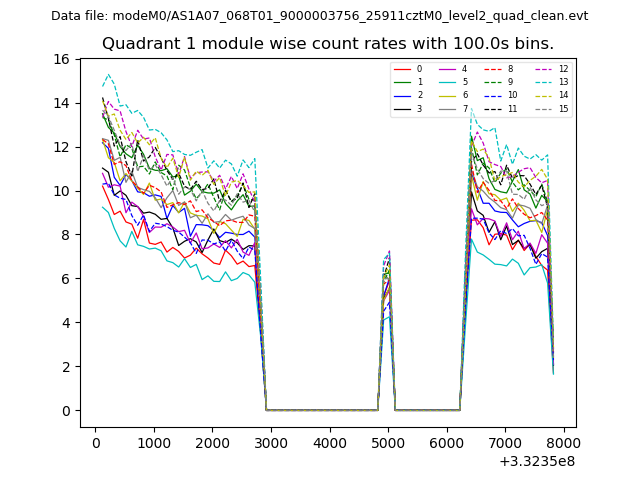
| Quadrant-wise count rates Data is divided into 100 sec bins |
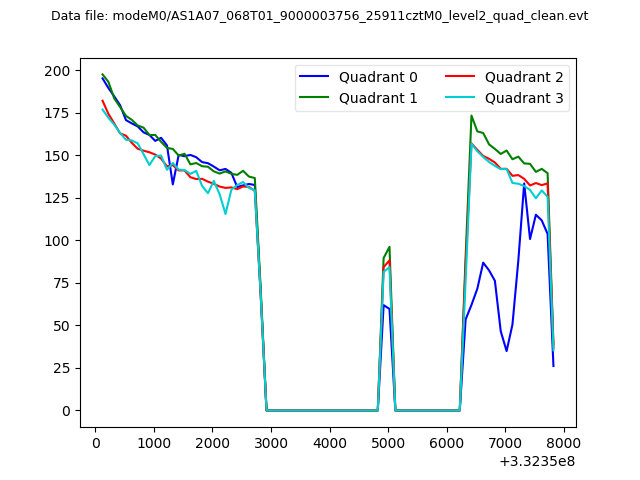 |
|
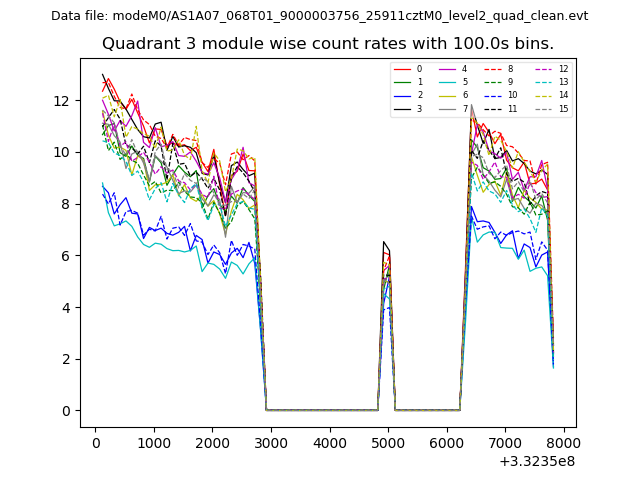
| Module-wise count rates for Quadrant A Data is divided into 100 sec bins |
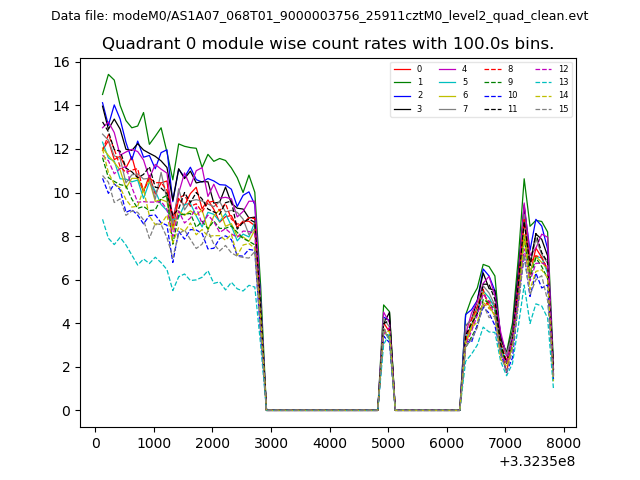 |
 |
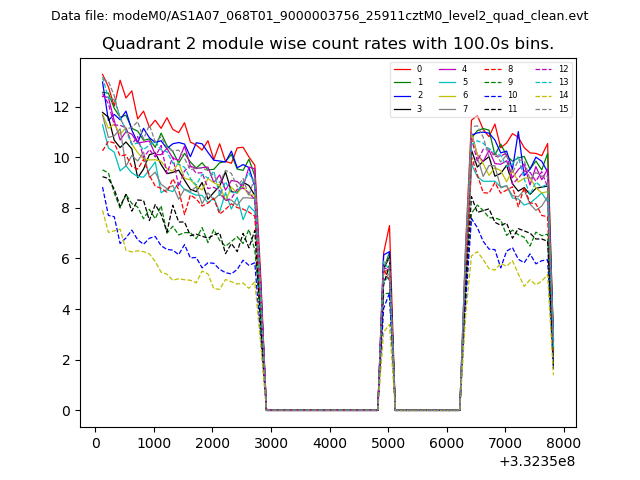
| Module-wise count rates for Quadrant B Data is divided into 100 sec bins |
 |
 |
| Module-wise count rates for Quadrant C Data is divided into 100 sec bins |
 |
 |
| Module-wise count rates for Quadrant D Data is divided into 100 sec bins |
 |
 |
| Parameter | Plot |
|---|---|
| CZT HV Monitor | 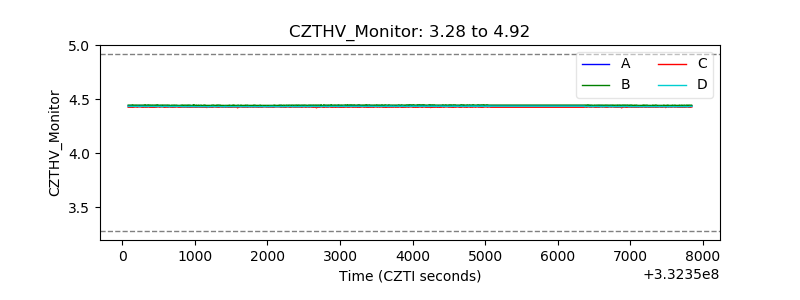 |
| D_VDD | 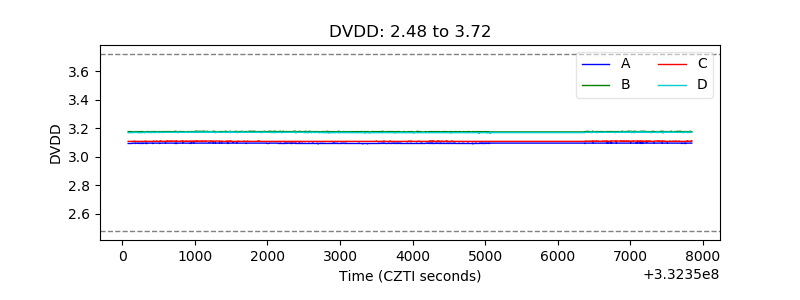 |
| Temperature 1 | 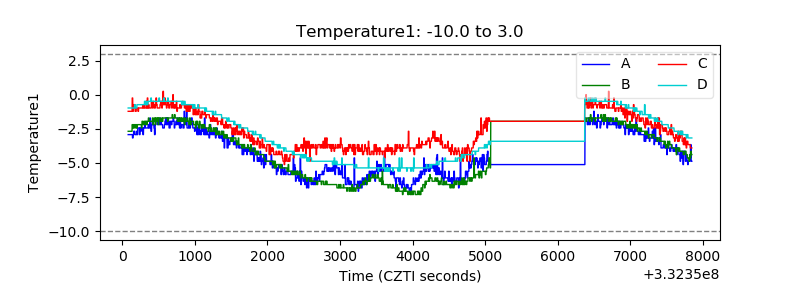 |
| Veto HV Monitor | 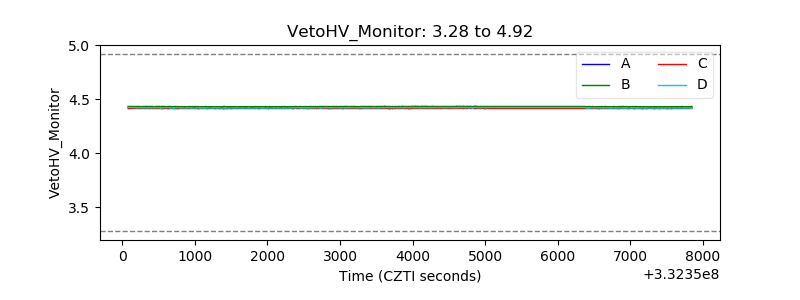 |
| Veto LLD | 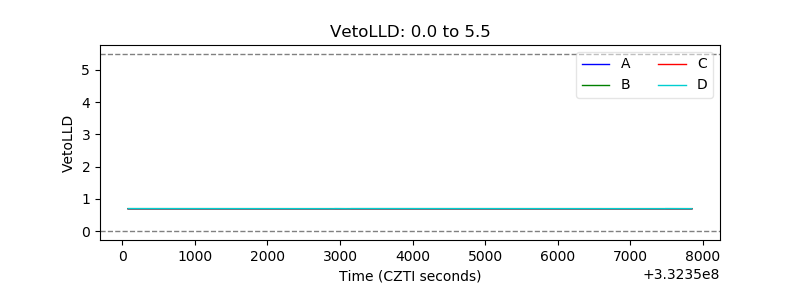 |
| Alpha Counter | 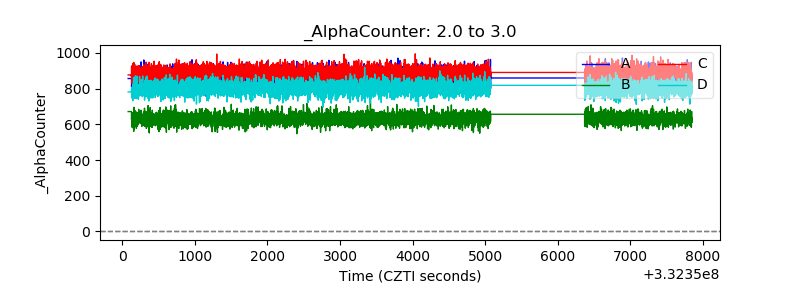 |
| _CPM_Rate | 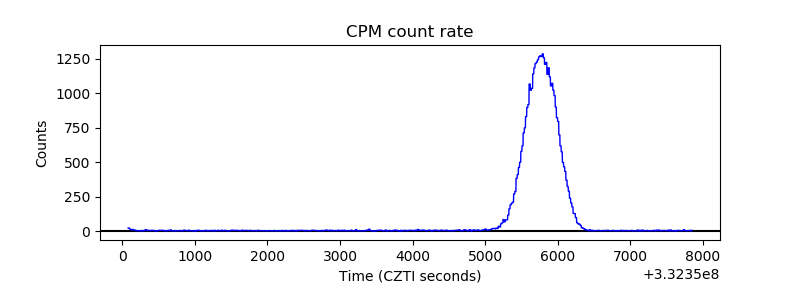 |
| CZT Counter | 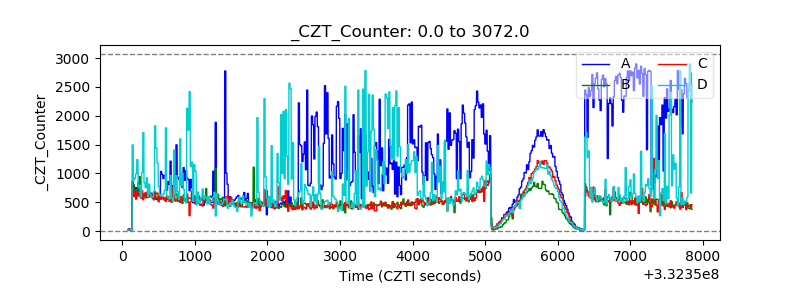 |
| +2.5 Volts monitor |  |
| +5 Volts monitor |  |
| _ROLL_ROT | 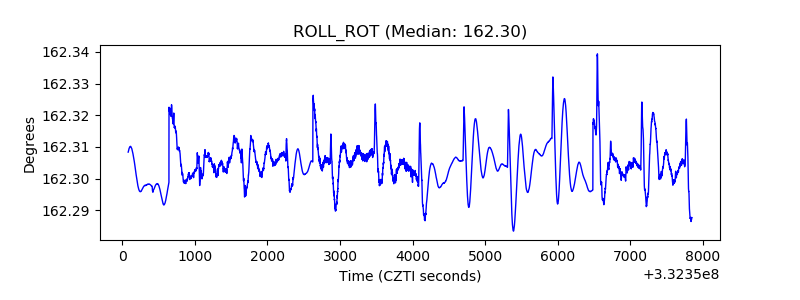 |
| _Roll_DEC | 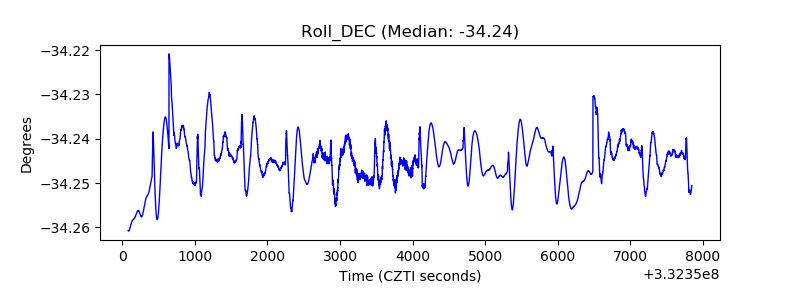 |
| _Roll_RA | 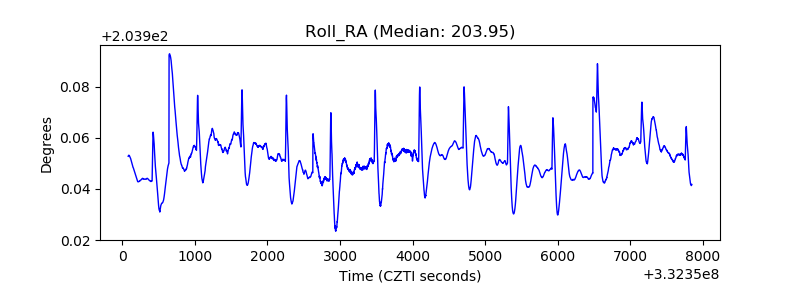 |
| Veto Counter | 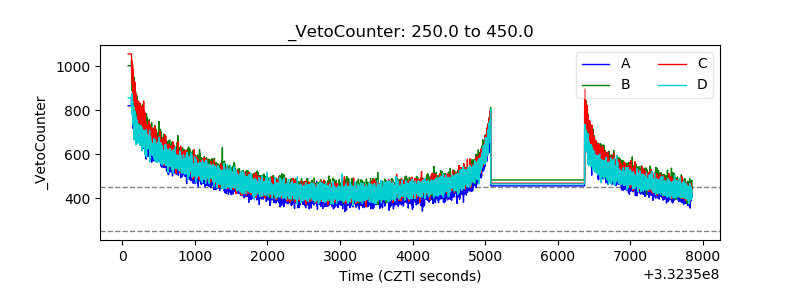 |