| Param | Original file | Final file |
|---|---|---|
| Filename | modeM0/AS1A07_068T01_9000003756_25912cztM0_level2.evt | modeM0/AS1A07_068T01_9000003756_25912cztM0_level2_quad_clean.evt |
| Size (bytes) | 825,998,400 | 88,634,880 |
| Size | 787.7 MB | 84.5 MB |
| Events in quadrant A | 13,211,508 | 428,345 |
| Events in quadrant B | 3,194,975 | 631,061 |
| Events in quadrant C | 3,173,846 | 591,378 |
| Events in quadrant D | 4,999,125 | 581,678 |
| Mode M0 | |||
|---|---|---|---|
| Quadrant | BADHDUFLAG | Total packets | Discarded packets |
| A | 0 | 43686 | 0 |
| B | 0 | 13541 | 0 |
| C | 0 | 13576 | 0 |
| D | 0 | 19230 | 0 |
| Mode M9 | |||
|---|---|---|---|
| Quadrant | BADHDUFLAG | Total packets | Discarded packets |
| A | 0 | 11 | 0 |
| B | 0 | 11 | 0 |
| C | 0 | 11 | 0 |
| D | 0 | 11 | 0 |
| Quadrant | Total seconds | Saturated seconds | Saturation percentage |
|---|---|---|---|
| A | 6458 | 4314 | 66.800867% |
| B | 6458 | 45 | 0.696810% |
| C | 6458 | 77 | 1.192320% |
| D | 6458 | 294 | 4.552493% |
Noise dominated data is calculated using 1-second bins in cleaned event files. If a bin has >2000 counts, and if more than 50% of those come from <1% of pixels, then it is considered to be noise-dominated and hence unusable.
| Quadrant | # 1 sec bins | Bins with >0 counts | Bins with >2000 counts | High rate bins dominated by noise | Noise dominated (total time) | Noise dominated (detector-on time) | Marked lightcurve |
|---|---|---|---|---|---|---|---|
| A | 7498 | 6459 | 3661 | 3661 | 48.83% | 56.68% | 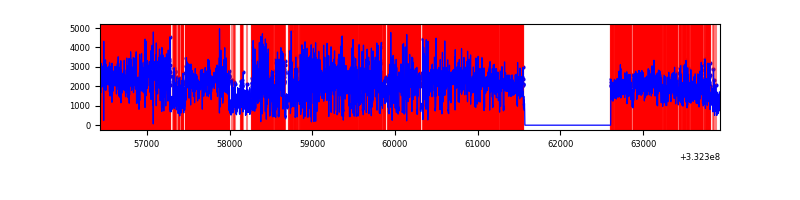 |
| B | 7498 | 6459 | 1 | 1 | 0.01% | 0.02% | 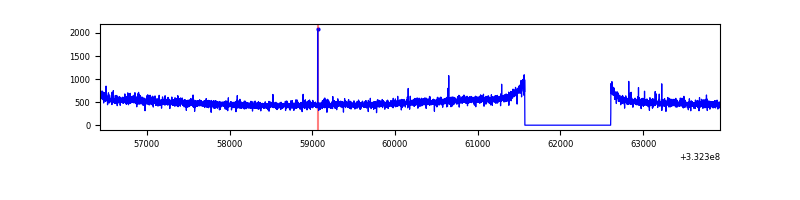 |
| C | 7498 | 6459 | 0 | 0 | 0.00% | 0.00% | 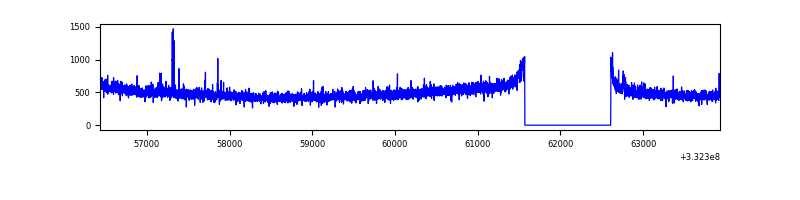 |
| D | 7498 | 6459 | 264 | 264 | 3.52% | 4.09% | 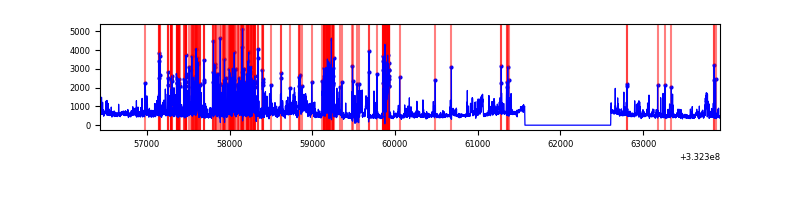 |
Top three noisy pixels from each quadrant. If the there are fewer than three noisy pixels in the level2.evt file, extra rows are filled as -1
| Pixel properties | Quadrant properties | ||||||
|---|---|---|---|---|---|---|---|
| Quadrant | DetID | PixID | Counts | Sigma | Mean | Median | Sigma |
| A | 0 | 13 | 10887068 | 90468.36 | 598 | 587 | 120.3 |
| A | 8 | 192 | 9360 | 72.91 | 598 | 587 | 120.3 |
| A | 12 | 16 | 8010 | 61.69 | 598 | 587 | 120.3 |
| B | 12 | 111 | 18539 | 115.62 | 807 | 788 | 153.5 |
| B | 11 | 111 | 16449 | 102.0 | 807 | 788 | 153.5 |
| B | 14 | 111 | 14895 | 91.88 | 807 | 788 | 153.5 |
| C | 14 | 238 | 126580 | 701.14 | 767 | 774 | 179.4 |
| C | 3 | 233 | 54856 | 301.41 | 767 | 774 | 179.4 |
| C | 2 | 16 | 6129 | 29.84 | 767 | 774 | 179.4 |
| D | 1 | 52 | 1326623 | 7224.87 | 768 | 750 | 183.5 |
| D | 7 | 80 | 738213 | 4018.54 | 768 | 750 | 183.5 |
| D | 2 | 234 | 24596 | 129.94 | 768 | 750 | 183.5 |
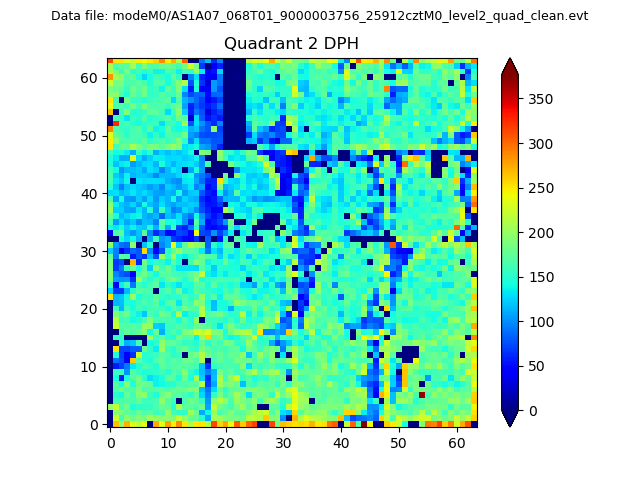
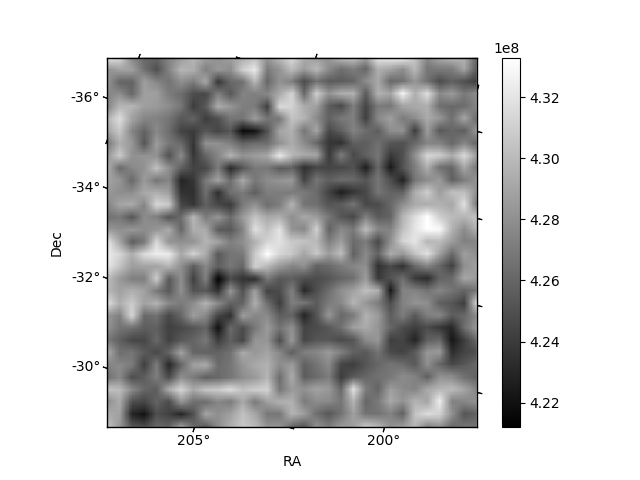
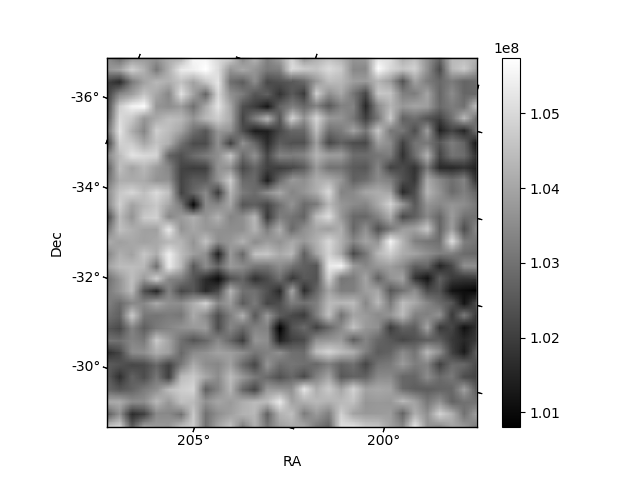
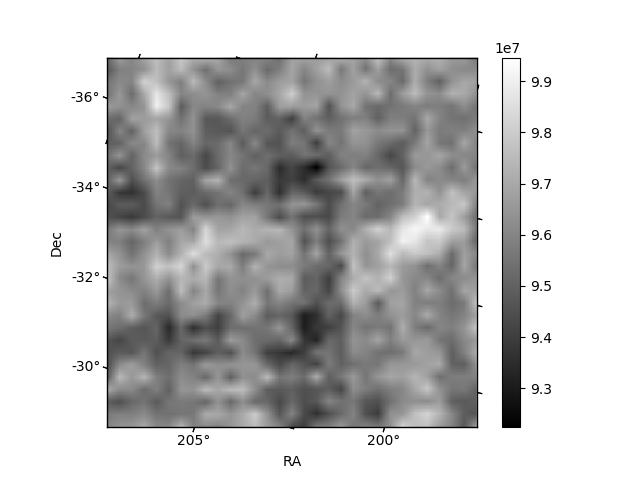
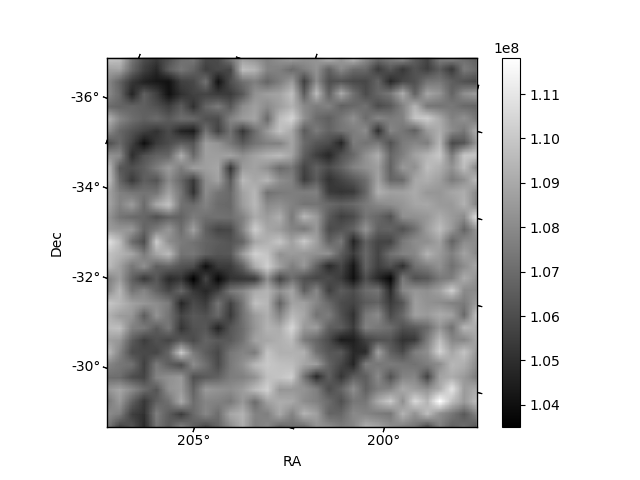
Histogram calculated using DETX and DETY for each event in the final _common_clean file
| Quadrant A | 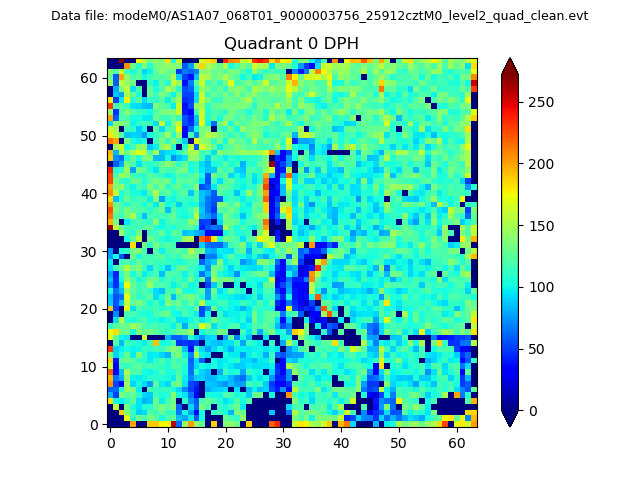 |
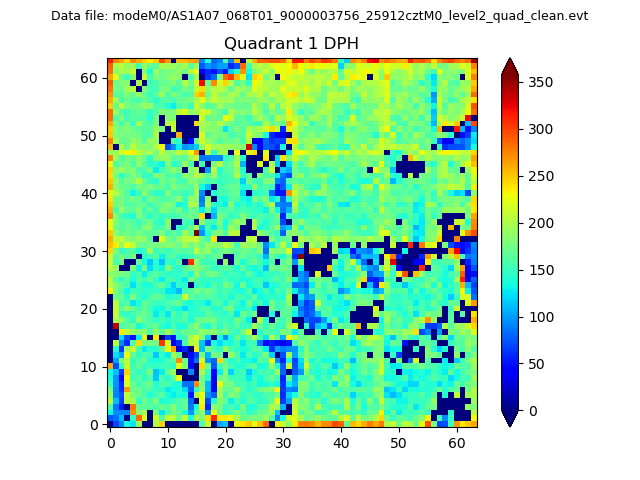 |
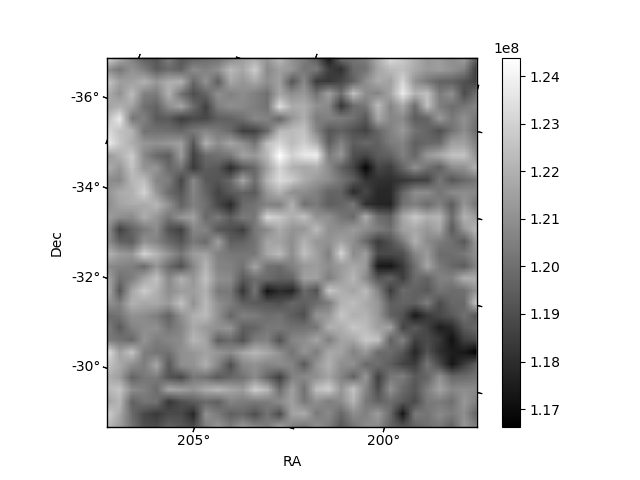
Quadrant B |
|---|---|---|---|
| Quadrant D | 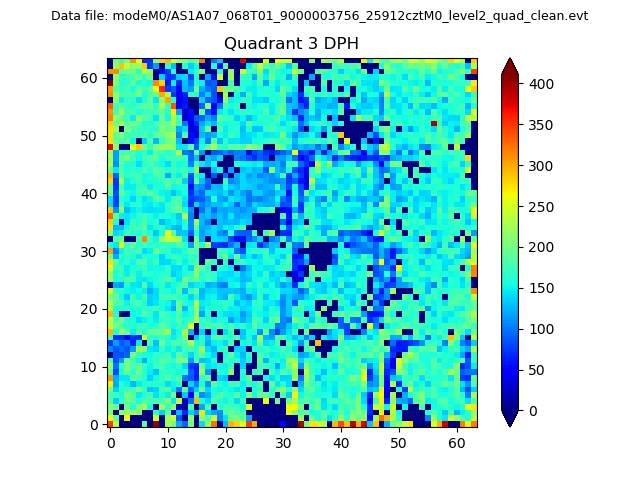 |
 |
Quadrant C |
| Plot type | Count rate plots | Images |
|---|---|---|
| Comparison with Poisson distribution Blue bars denote a histogram of data divided into 1 sec bins. Red curve is a Poisson curve with rate = median count rate of data. |
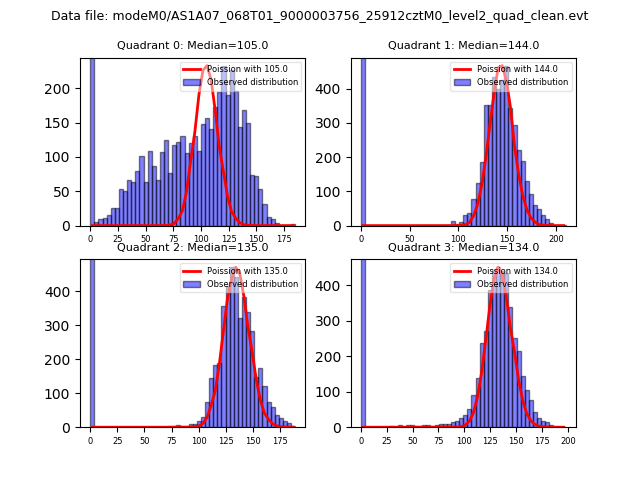 |
 |
| Quadrant-wise count rates Data is divided into 100 sec bins |
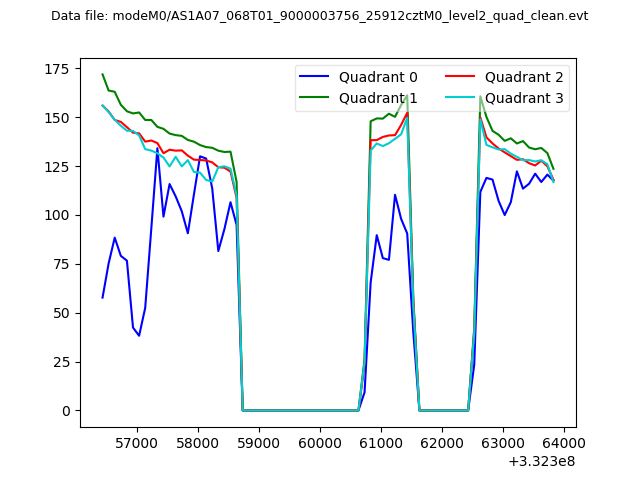 |
|
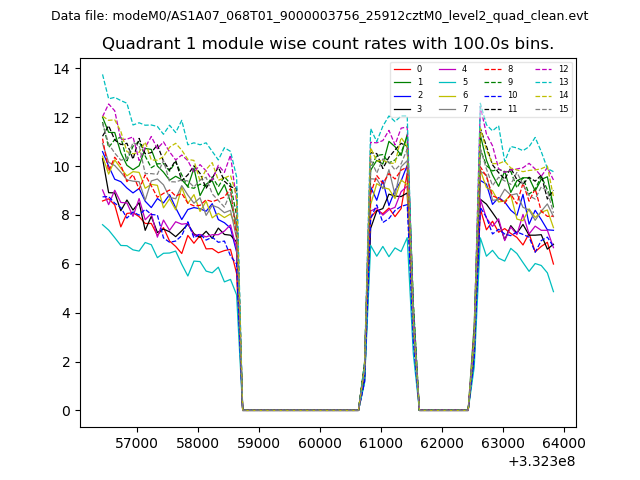
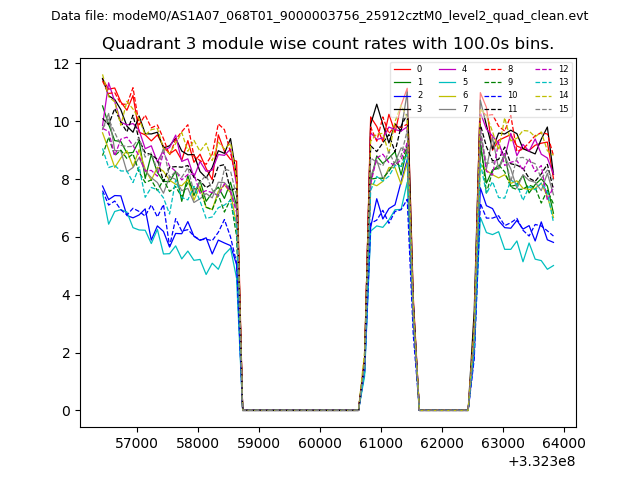
| Module-wise count rates for Quadrant A Data is divided into 100 sec bins |
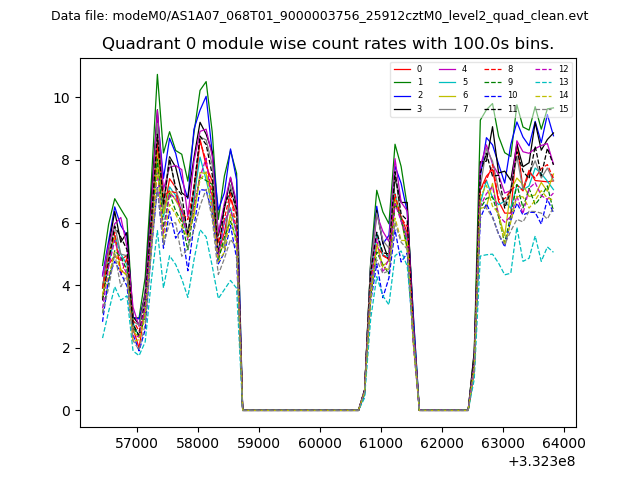 |
 |
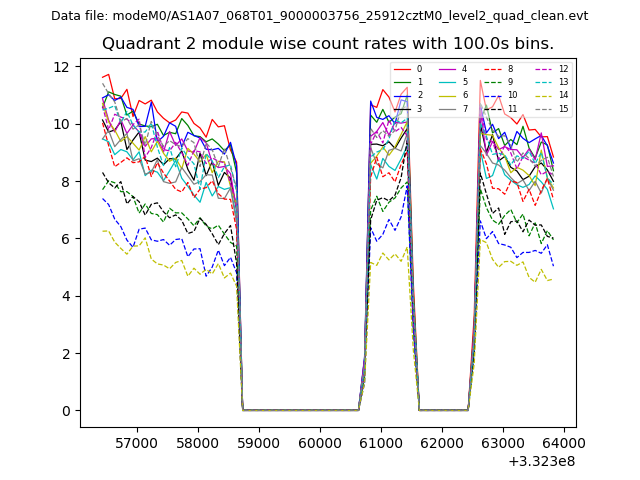
| Module-wise count rates for Quadrant B Data is divided into 100 sec bins |
 |
 |
| Module-wise count rates for Quadrant C Data is divided into 100 sec bins |
 |
 |
| Module-wise count rates for Quadrant D Data is divided into 100 sec bins |
 |
 |
| Parameter | Plot |
|---|---|
| CZT HV Monitor | 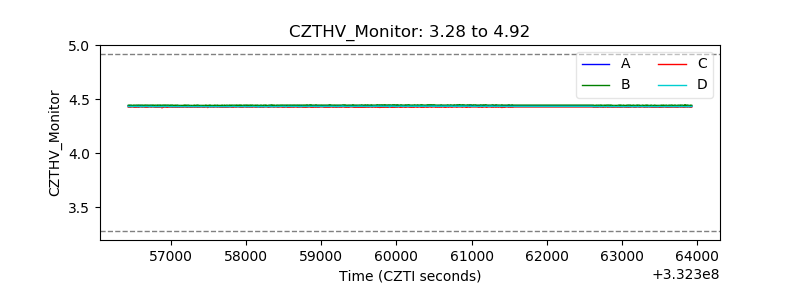 |
| D_VDD | 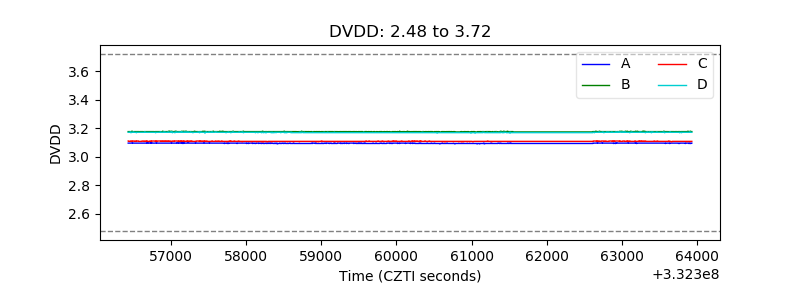 |
| Temperature 1 | 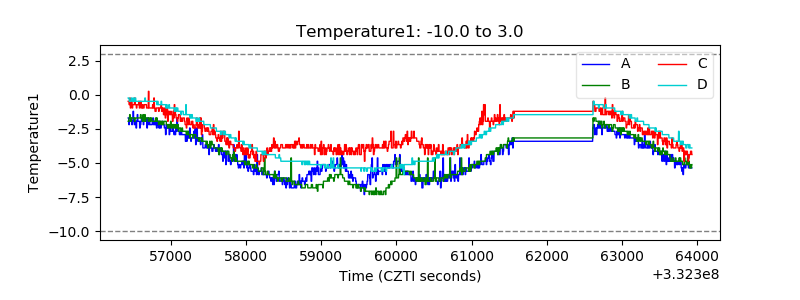 |
| Veto HV Monitor | 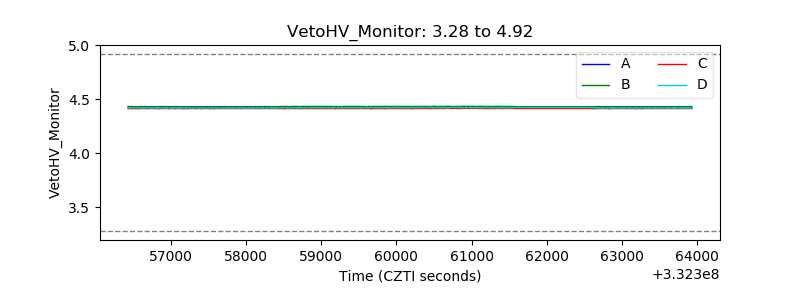 |
| Veto LLD | 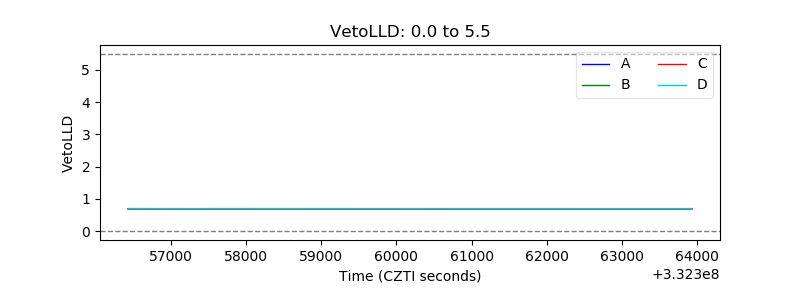 |
| Alpha Counter | 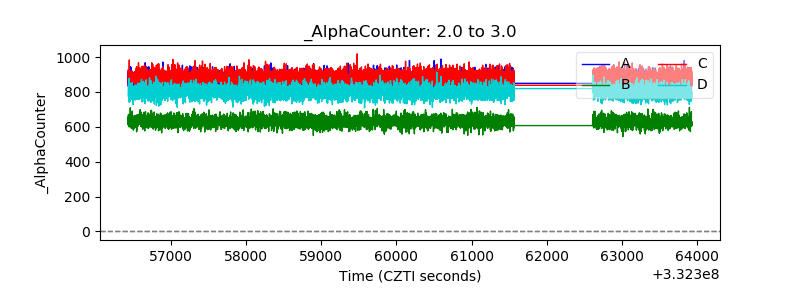 |
| _CPM_Rate | 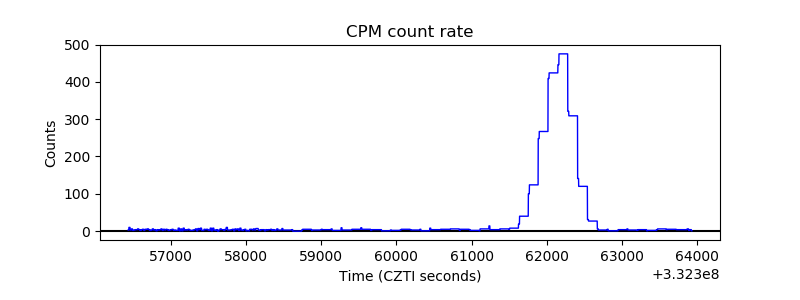 |
| CZT Counter |  |
| +2.5 Volts monitor |  |
| +5 Volts monitor |  |
| _ROLL_ROT | 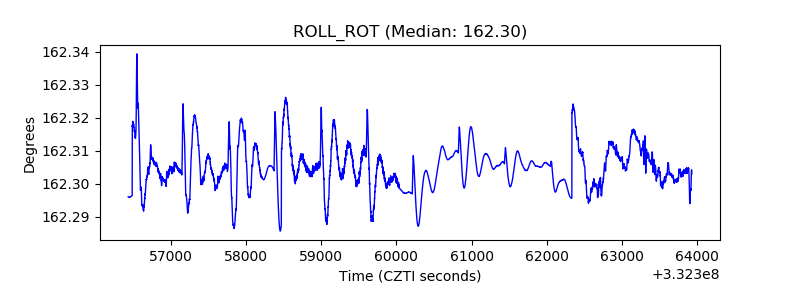 |
| _Roll_DEC | 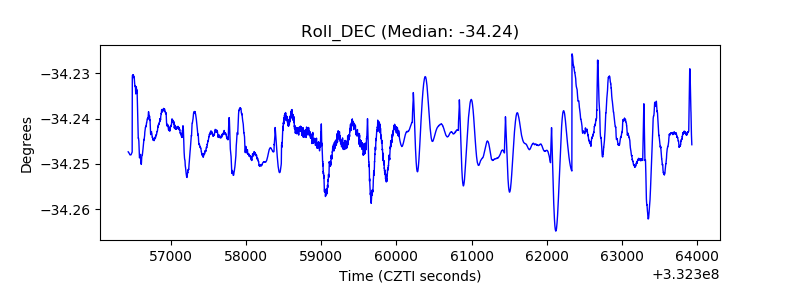 |
| _Roll_RA |  |
| Veto Counter | 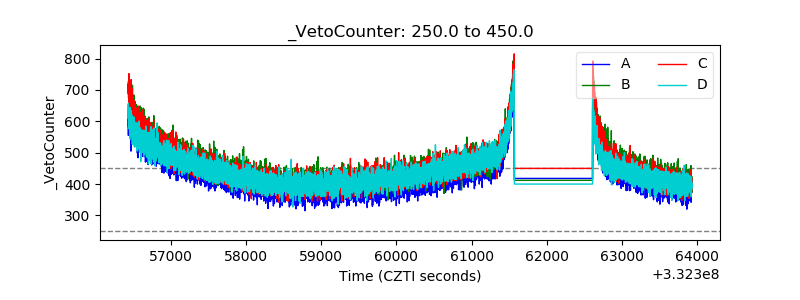 |