| Param | Original file | Final file |
|---|---|---|
| Filename | modeM0/AS1A07_068T01_9000003756_25913cztM0_level2.evt | modeM0/AS1A07_068T01_9000003756_25913cztM0_level2_quad_clean.evt |
| Size (bytes) | 661,677,120 | 98,245,440 |
| Size | 631.0 MB | 93.7 MB |
| Events in quadrant A | 8,955,526 | 580,695 |
| Events in quadrant B | 3,409,070 | 661,131 |
| Events in quadrant C | 3,334,063 | 625,404 |
| Events in quadrant D | 3,872,589 | 625,832 |
| Mode M0 | |||
|---|---|---|---|
| Quadrant | BADHDUFLAG | Total packets | Discarded packets |
| A | 0 | 31440 | 0 |
| B | 0 | 14443 | 0 |
| C | 0 | 14415 | 0 |
| D | 0 | 16212 | 0 |
| Mode M9 | |||
|---|---|---|---|
| Quadrant | BADHDUFLAG | Total packets | Discarded packets |
| A | 0 | 10 | 0 |
| B | 0 | 11 | 0 |
| C | 0 | 11 | 0 |
| D | 0 | 11 | 0 |
| Quadrant | Total seconds | Saturated seconds | Saturation percentage |
|---|---|---|---|
| A | 6914 | 1578 | 22.823257% |
| B | 6914 | 66 | 0.954585% |
| C | 6914 | 65 | 0.940121% |
| D | 6914 | 44 | 0.636390% |
Noise dominated data is calculated using 1-second bins in cleaned event files. If a bin has >2000 counts, and if more than 50% of those come from <1% of pixels, then it is considered to be noise-dominated and hence unusable.
| Quadrant | # 1 sec bins | Bins with >0 counts | Bins with >2000 counts | High rate bins dominated by noise | Noise dominated (total time) | Noise dominated (detector-on time) | Marked lightcurve |
|---|---|---|---|---|---|---|---|
| A | 7584 | 6915 | 1298 | 1298 | 17.11% | 18.77% | 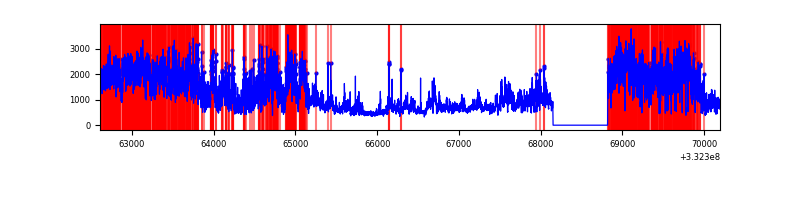 |
| B | 7584 | 6915 | 2 | 2 | 0.03% | 0.03% | 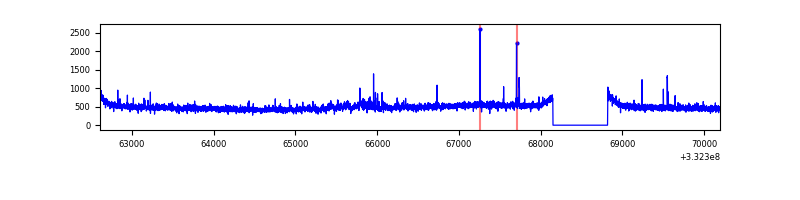 |
| C | 7584 | 6915 | 1 | 1 | 0.01% | 0.01% | 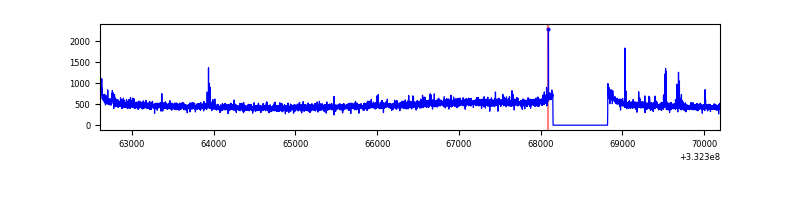 |
| D | 7584 | 6915 | 47 | 47 | 0.62% | 0.68% | 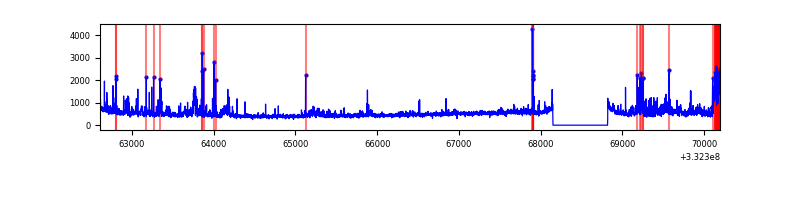 |
Top three noisy pixels from each quadrant. If the there are fewer than three noisy pixels in the level2.evt file, extra rows are filled as -1
| Pixel properties | Quadrant properties | ||||||
|---|---|---|---|---|---|---|---|
| Quadrant | DetID | PixID | Counts | Sigma | Mean | Median | Sigma |
| A | 0 | 13 | 5878203 | 36580.0 | 796 | 779 | 160.7 |
| A | 13 | 254 | 9131 | 51.98 | 796 | 779 | 160.7 |
| A | 3 | 137 | 7349 | 40.89 | 796 | 779 | 160.7 |
| B | 0 | 219 | 78385 | 483.26 | 842 | 823 | 160.5 |
| B | 12 | 111 | 19747 | 117.91 | 842 | 823 | 160.5 |
| B | 11 | 111 | 17562 | 104.3 | 842 | 823 | 160.5 |
| C | 14 | 238 | 130608 | 690.63 | 802 | 807 | 187.9 |
| C | 2 | 16 | 39233 | 204.45 | 802 | 807 | 187.9 |
| C | 3 | 233 | 38816 | 202.23 | 802 | 807 | 187.9 |
| D | 1 | 52 | 744385 | 3784.39 | 814 | 792 | 196.5 |
| D | 2 | 234 | 28526 | 141.15 | 814 | 792 | 196.5 |
| D | 7 | 80 | 13124 | 62.76 | 814 | 792 | 196.5 |
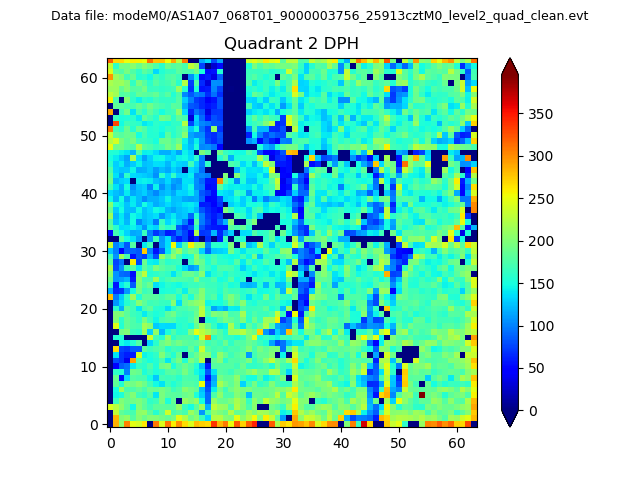
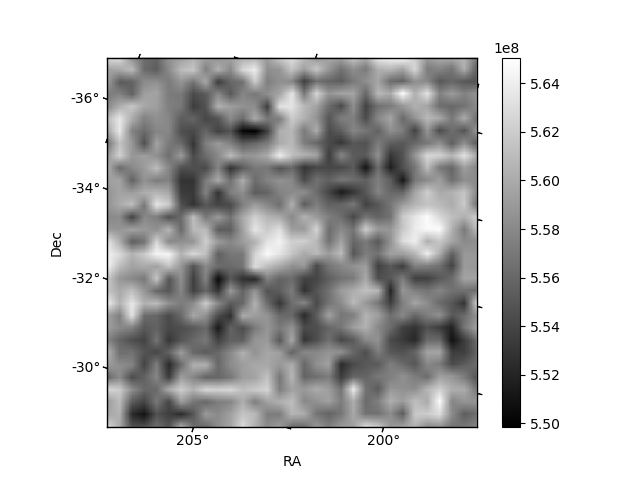
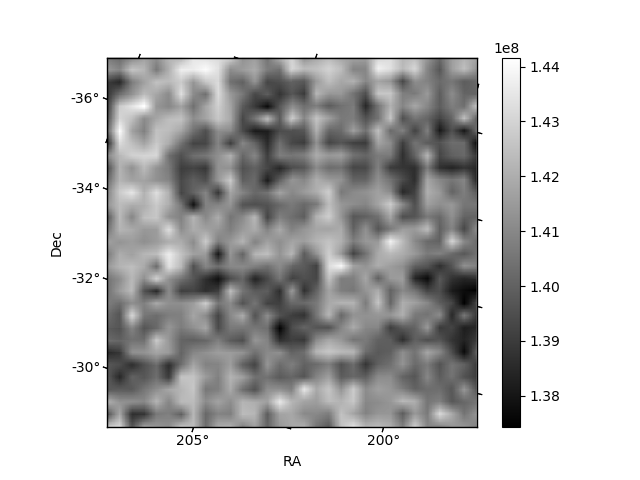
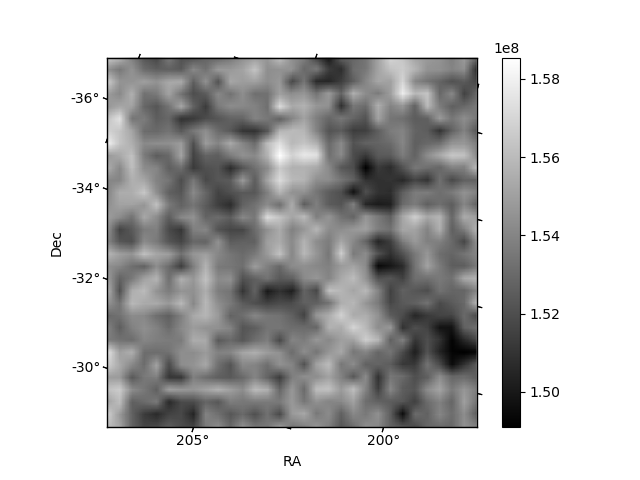
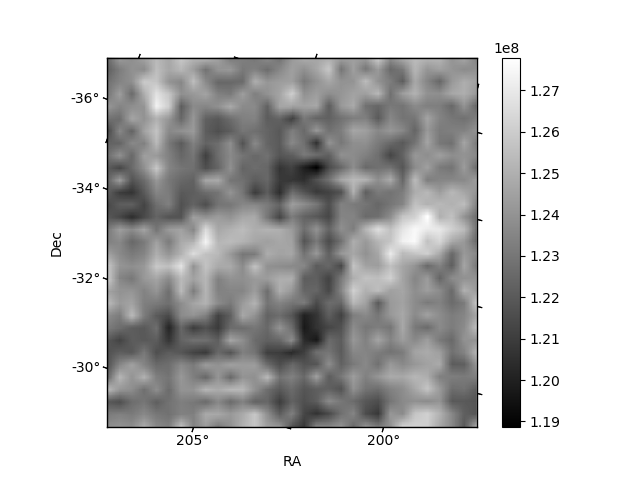
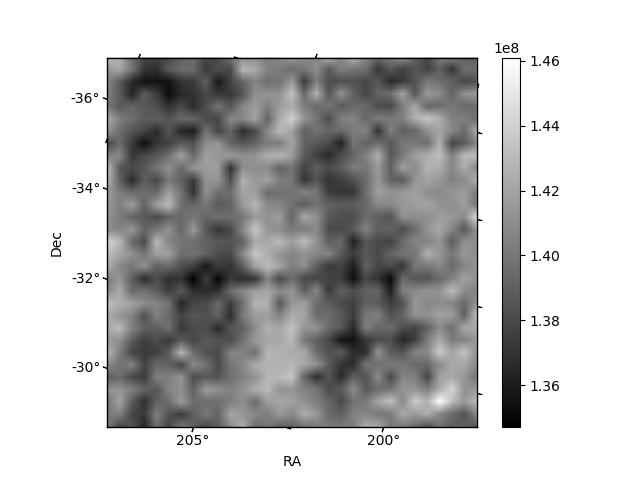
Histogram calculated using DETX and DETY for each event in the final _common_clean file
| Quadrant A | 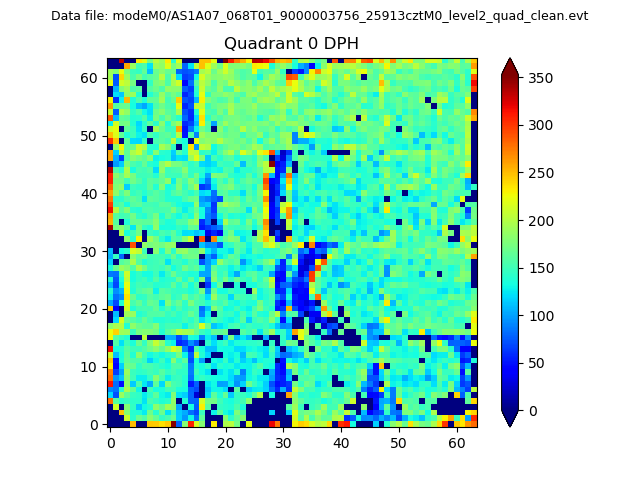 |
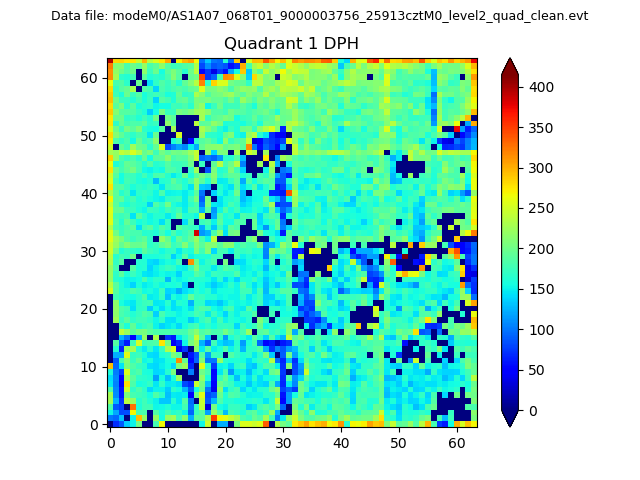 |
Quadrant B |
|---|---|---|---|
| Quadrant D | 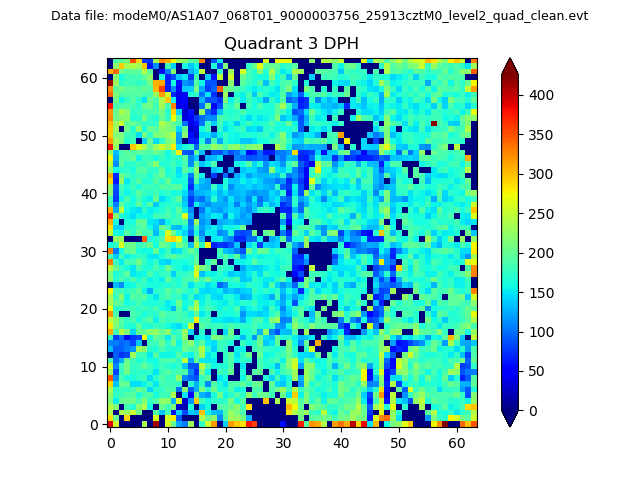 |
 |
Quadrant C |
| Plot type | Count rate plots | Images |
|---|---|---|
| Comparison with Poisson distribution Blue bars denote a histogram of data divided into 1 sec bins. Red curve is a Poisson curve with rate = median count rate of data. |
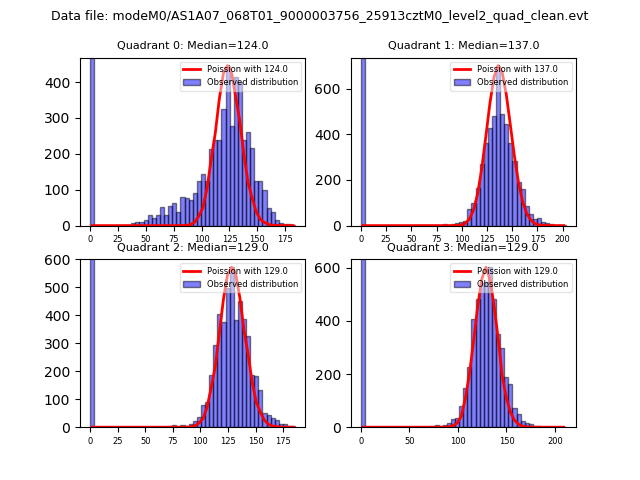 |
 |
| Quadrant-wise count rates Data is divided into 100 sec bins |
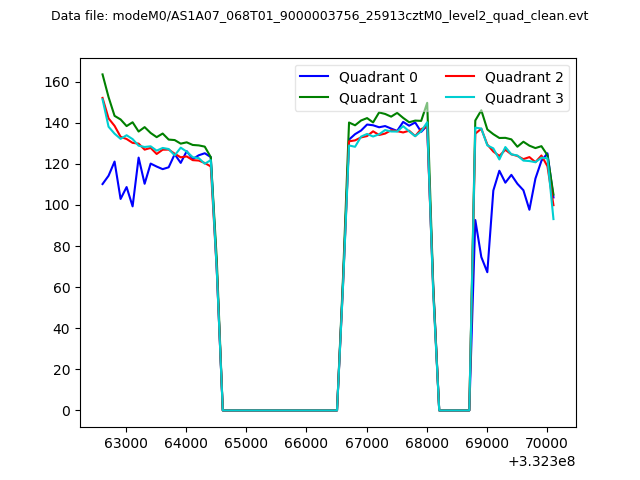 |
|
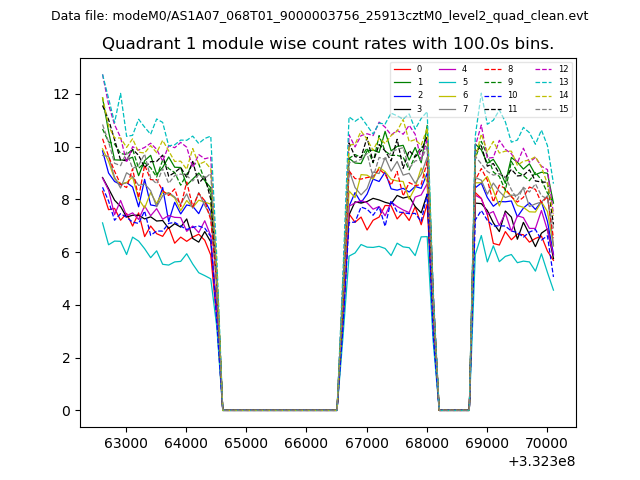
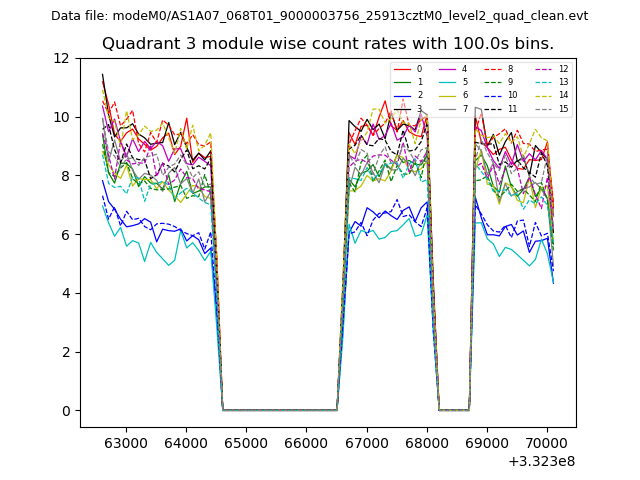
| Module-wise count rates for Quadrant A Data is divided into 100 sec bins |
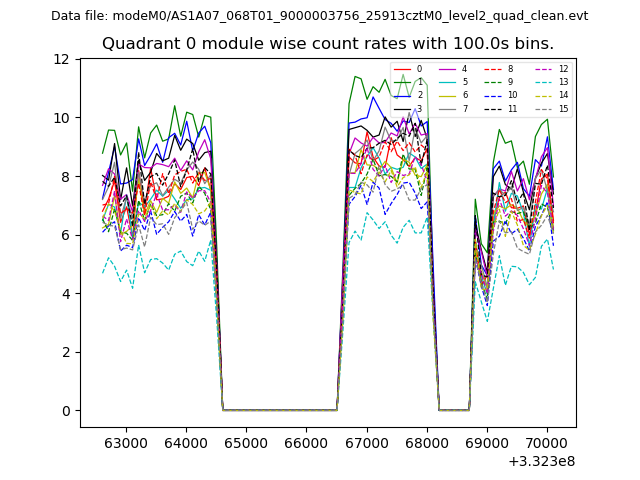 |
 |
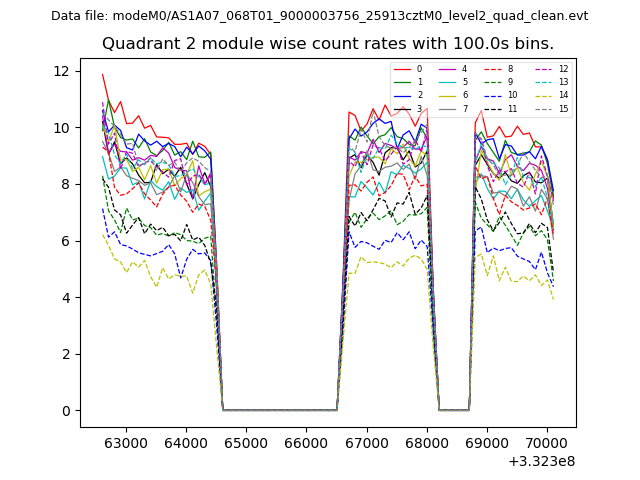
| Module-wise count rates for Quadrant B Data is divided into 100 sec bins |
 |
 |
| Module-wise count rates for Quadrant C Data is divided into 100 sec bins |
 |
 |
| Module-wise count rates for Quadrant D Data is divided into 100 sec bins |
 |
 |
| Parameter | Plot |
|---|---|
| CZT HV Monitor | 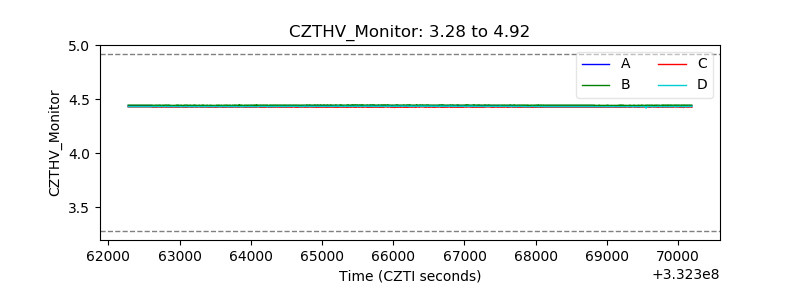 |
| D_VDD | 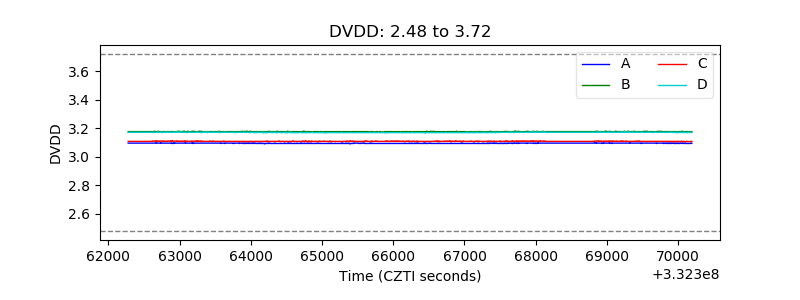 |
| Temperature 1 | 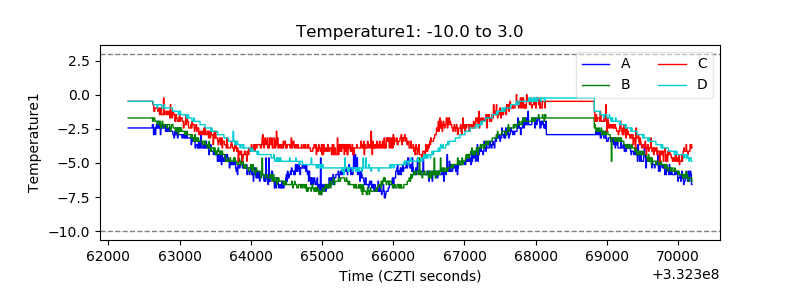 |
| Veto HV Monitor |  |
| Veto LLD | 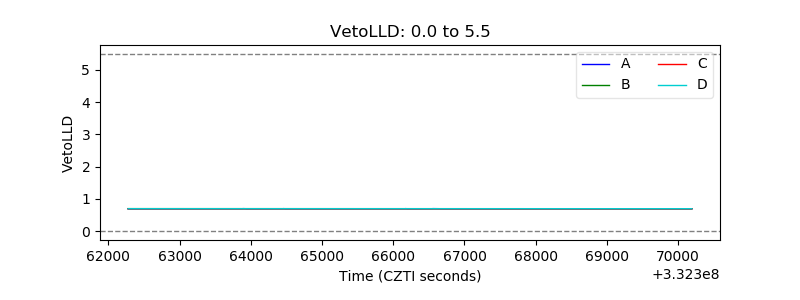 |
| Alpha Counter | 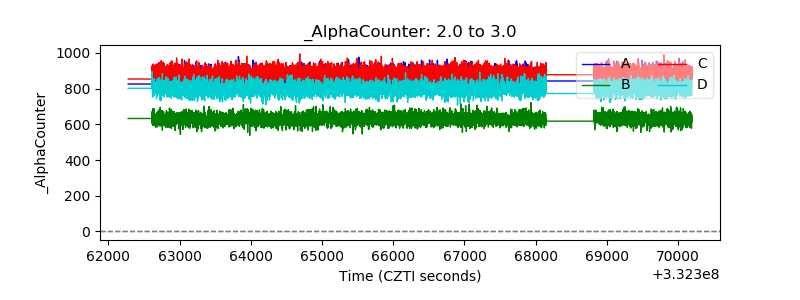 |
| _CPM_Rate | 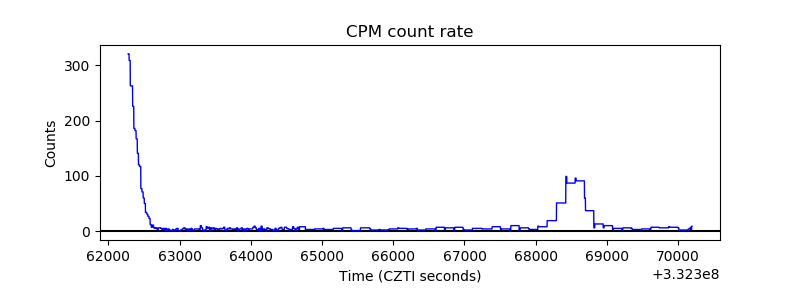 |
| CZT Counter | 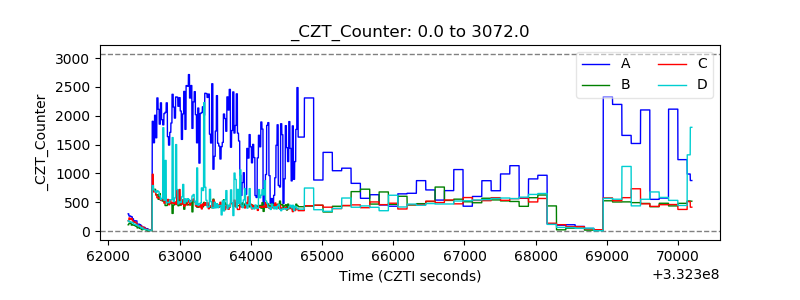 |
| +2.5 Volts monitor |  |
| +5 Volts monitor |  |
| _ROLL_ROT | 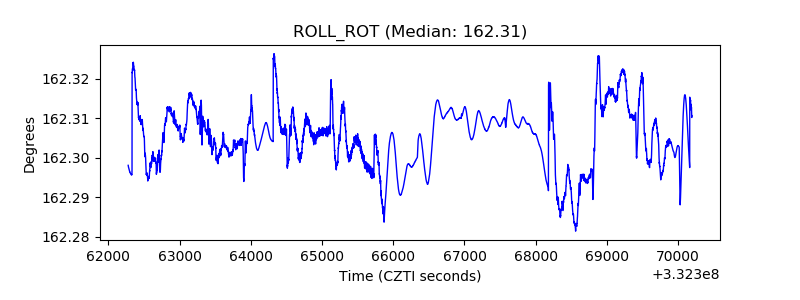 |
| _Roll_DEC | 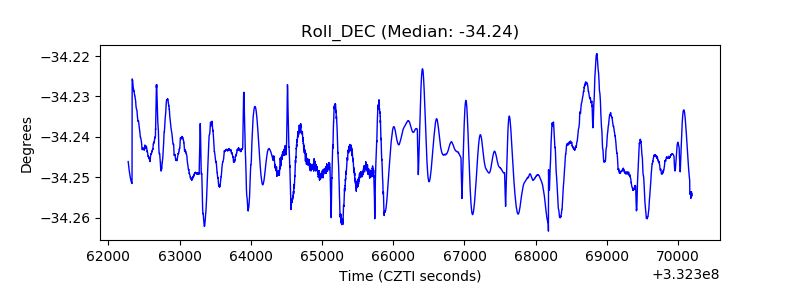 |
| _Roll_RA | 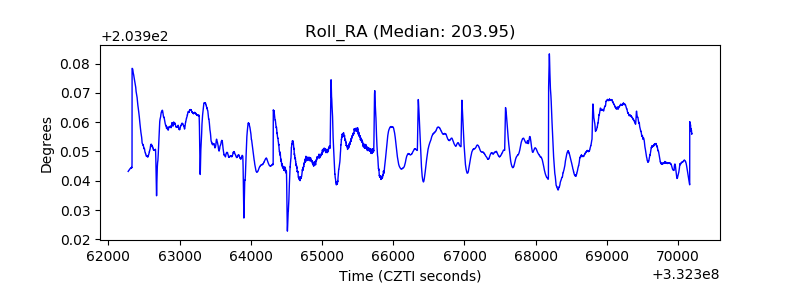 |
| Veto Counter | 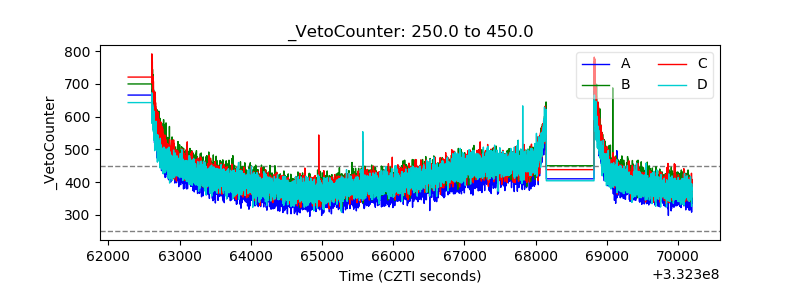 |