| Param | Original file | Final file |
|---|---|---|
| Filename | modeM0/AS1A07_068T01_9000003756_25914cztM0_level2.evt | modeM0/AS1A07_068T01_9000003756_25914cztM0_level2_quad_clean.evt |
| Size (bytes) | 645,782,400 | 101,185,920 |
| Size | 615.9 MB | 96.5 MB |
| Events in quadrant A | 7,549,980 | 611,098 |
| Events in quadrant B | 3,576,742 | 670,896 |
| Events in quadrant C | 3,496,522 | 634,651 |
| Events in quadrant D | 4,436,455 | 635,337 |
| Mode M0 | |||
|---|---|---|---|
| Quadrant | BADHDUFLAG | Total packets | Discarded packets |
| A | 0 | 27476 | 0 |
| B | 0 | 15304 | 0 |
| C | 0 | 15199 | 0 |
| D | 0 | 18289 | 0 |
| Mode M9 | |||
|---|---|---|---|
| Quadrant | BADHDUFLAG | Total packets | Discarded packets |
| A | 0 | 7 | 0 |
| B | 0 | 8 | 0 |
| C | 0 | 8 | 0 |
| D | 0 | 8 | 0 |
| Quadrant | Total seconds | Saturated seconds | Saturation percentage |
|---|---|---|---|
| A | 7352 | 1082 | 14.717084% |
| B | 7352 | 94 | 1.278564% |
| C | 7352 | 77 | 1.047334% |
| D | 7352 | 60 | 0.816104% |
Noise dominated data is calculated using 1-second bins in cleaned event files. If a bin has >2000 counts, and if more than 50% of those come from <1% of pixels, then it is considered to be noise-dominated and hence unusable.
| Quadrant | # 1 sec bins | Bins with >0 counts | Bins with >2000 counts | High rate bins dominated by noise | Noise dominated (total time) | Noise dominated (detector-on time) | Marked lightcurve |
|---|---|---|---|---|---|---|---|
| A | 7712 | 7353 | 757 | 757 | 9.82% | 10.30% | 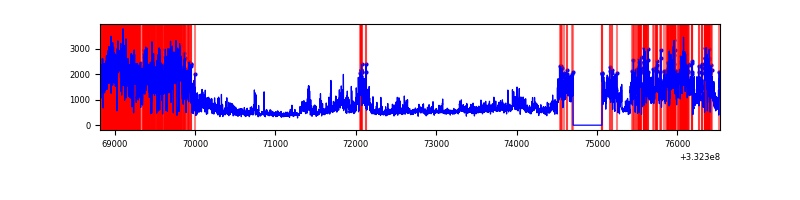 |
| B | 7712 | 7353 | 0 | 0 | 0.00% | 0.00% | 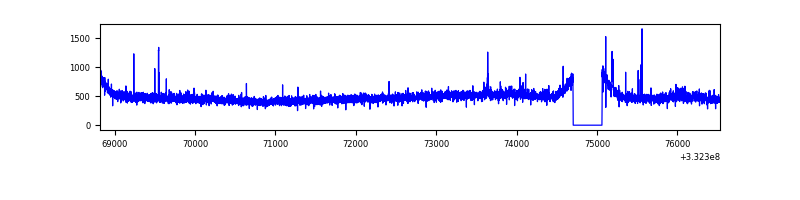 |
| C | 7712 | 7353 | 1 | 1 | 0.01% | 0.01% | 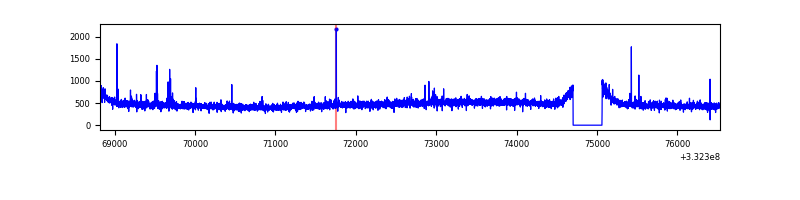 |
| D | 7712 | 7353 | 64 | 64 | 0.83% | 0.87% | 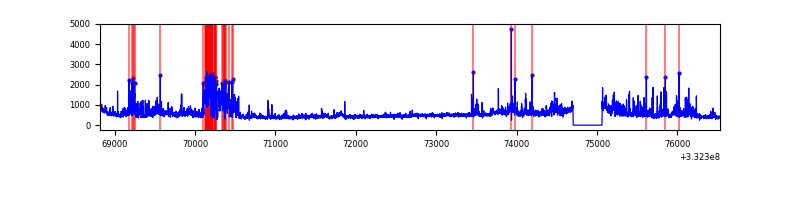 |
Top three noisy pixels from each quadrant. If the there are fewer than three noisy pixels in the level2.evt file, extra rows are filled as -1
| Pixel properties | Quadrant properties | ||||||
|---|---|---|---|---|---|---|---|
| Quadrant | DetID | PixID | Counts | Sigma | Mean | Median | Sigma |
| A | 0 | 13 | 4238984 | 24530.14 | 859 | 842 | 172.8 |
| A | 13 | 254 | 9770 | 51.67 | 859 | 842 | 172.8 |
| A | 3 | 137 | 8234 | 42.78 | 859 | 842 | 172.8 |
| B | 0 | 219 | 49691 | 284.71 | 889 | 867 | 171.5 |
| B | 0 | 190 | 28910 | 163.53 | 889 | 867 | 171.5 |
| B | 12 | 111 | 21327 | 119.31 | 889 | 867 | 171.5 |
| C | 14 | 238 | 136280 | 682.31 | 846 | 850 | 198.5 |
| C | 2 | 16 | 43130 | 213.01 | 846 | 850 | 198.5 |
| C | 3 | 233 | 17784 | 85.32 | 846 | 850 | 198.5 |
| D | 1 | 52 | 1132639 | 5432.03 | 859 | 836 | 208.4 |
| D | 2 | 234 | 31344 | 146.42 | 859 | 836 | 208.4 |
| D | 7 | 80 | 17130 | 78.2 | 859 | 836 | 208.4 |
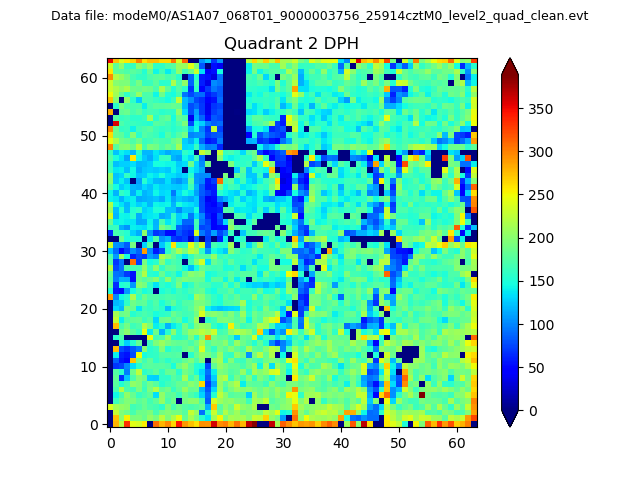
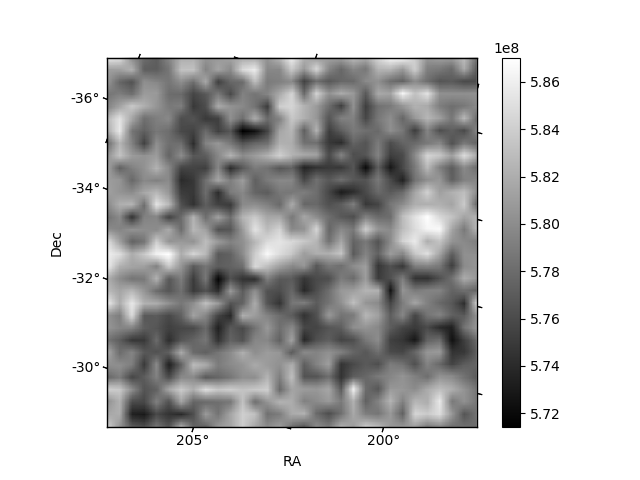
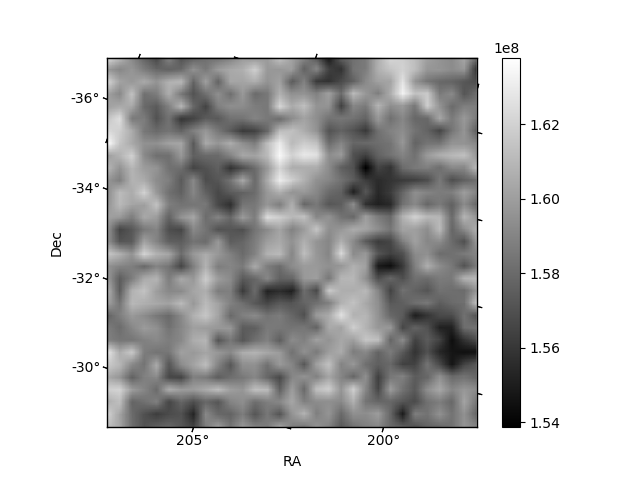
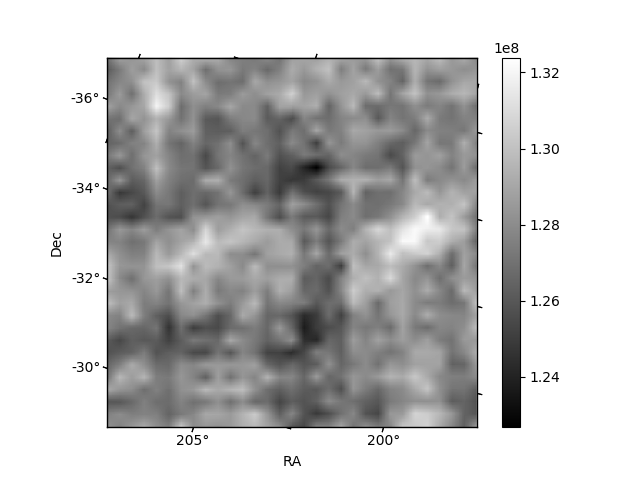
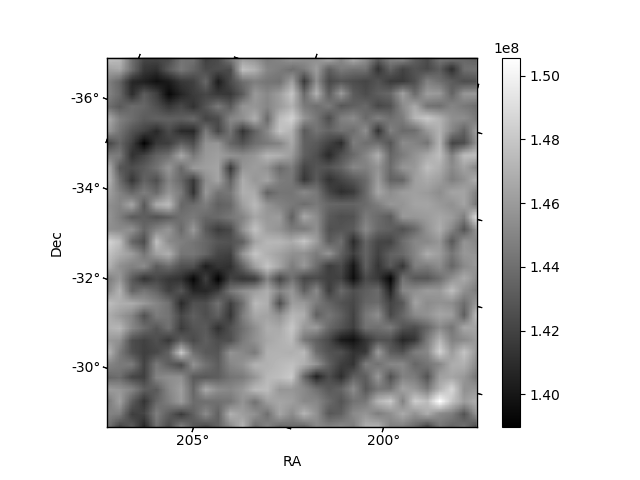
Histogram calculated using DETX and DETY for each event in the final _common_clean file
| Quadrant A | 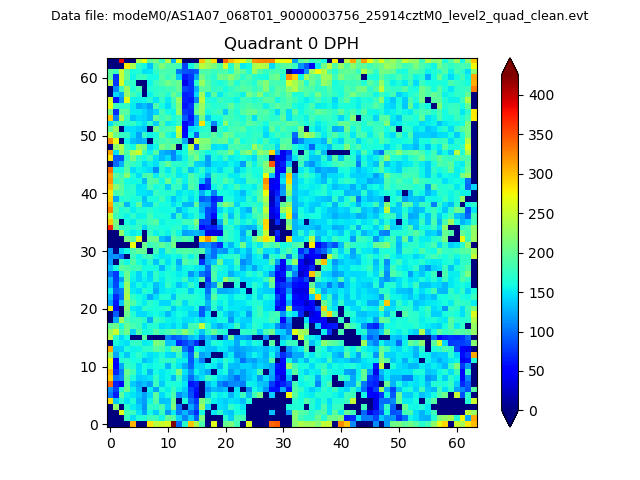 |
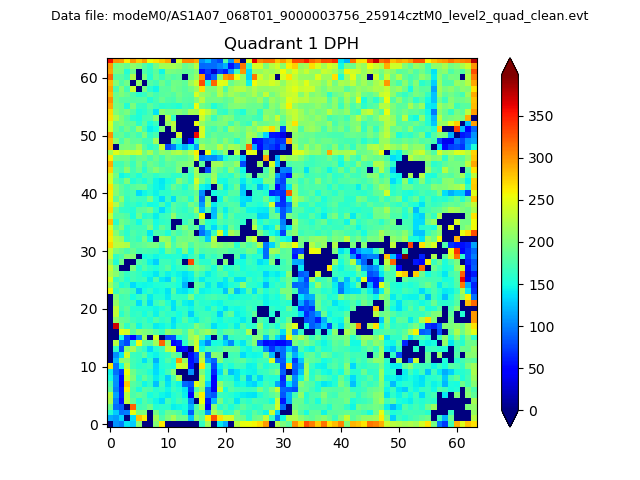 |
Quadrant B |
|---|---|---|---|
| Quadrant D | 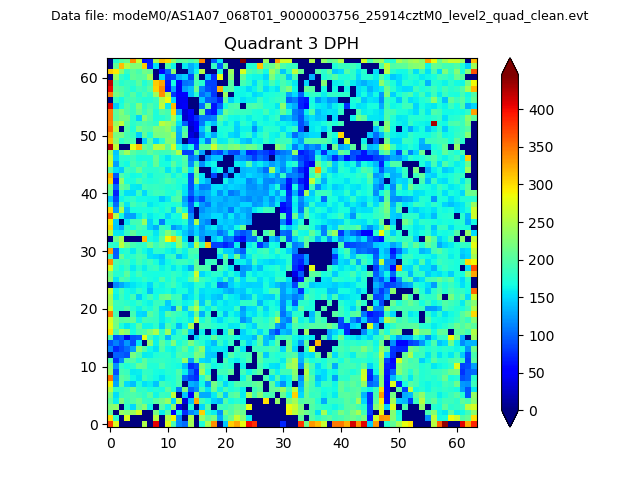 |
 |
Quadrant C |
| Plot type | Count rate plots | Images |
|---|---|---|
| Comparison with Poisson distribution Blue bars denote a histogram of data divided into 1 sec bins. Red curve is a Poisson curve with rate = median count rate of data. |
 |
 |
| Quadrant-wise count rates Data is divided into 100 sec bins |
 |
|
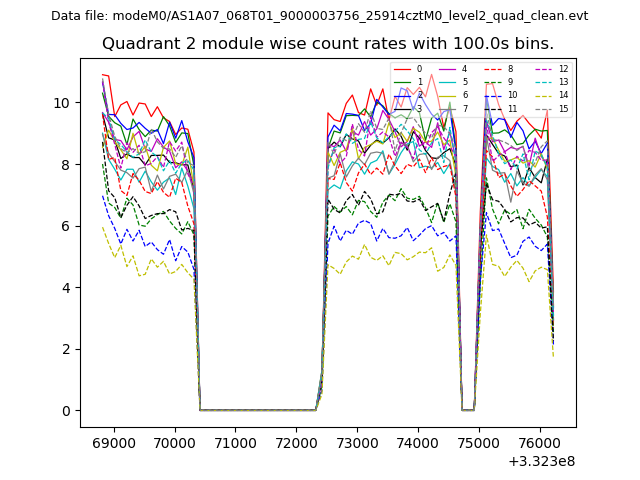
| Module-wise count rates for Quadrant A Data is divided into 100 sec bins |
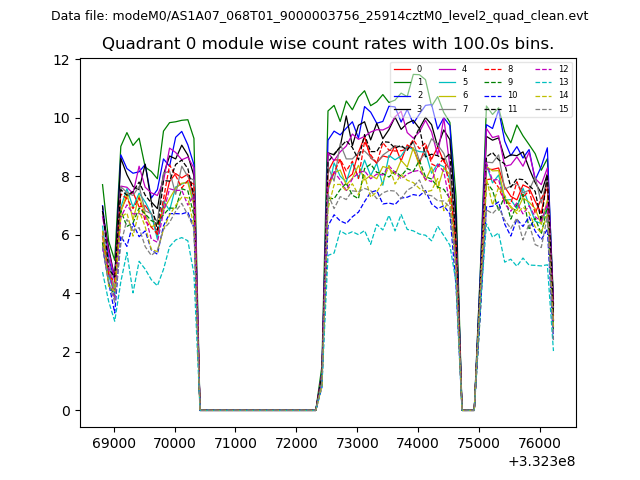 |
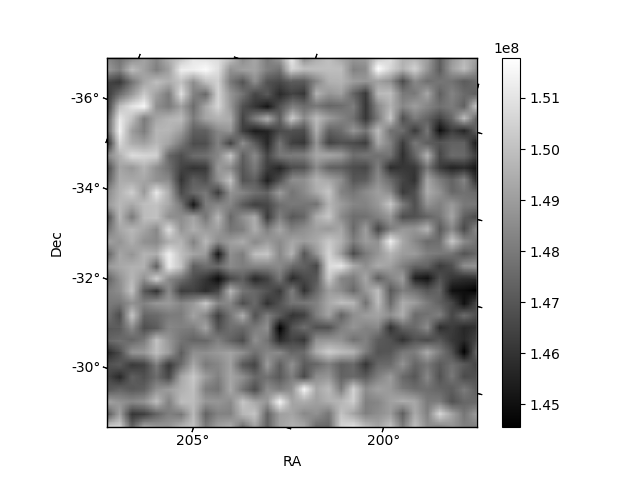 |
| Module-wise count rates for Quadrant B Data is divided into 100 sec bins |
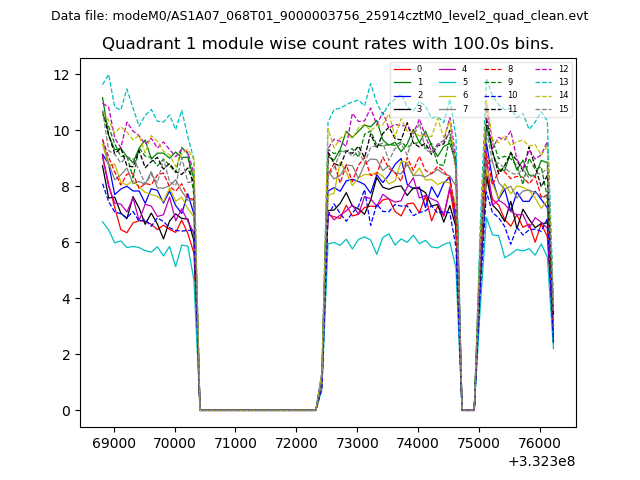 |
 |
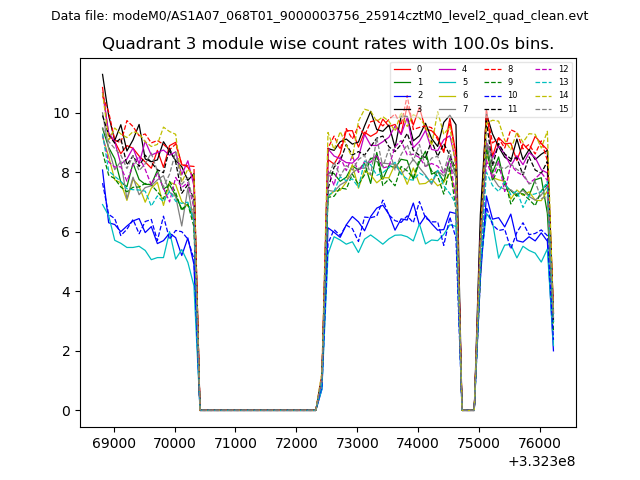
| Module-wise count rates for Quadrant C Data is divided into 100 sec bins |
 |
 |
| Module-wise count rates for Quadrant D Data is divided into 100 sec bins |
 |
 |
| Parameter | Plot |
|---|---|
| CZT HV Monitor | 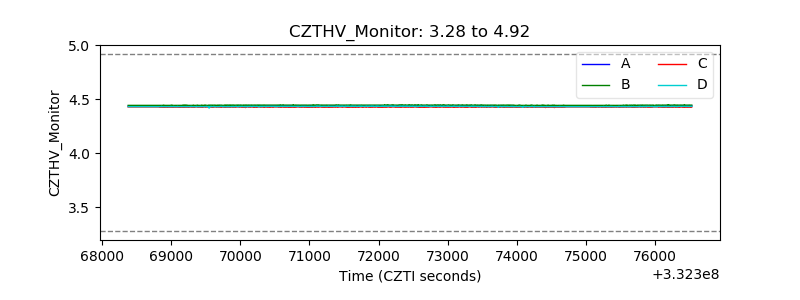 |
| D_VDD | 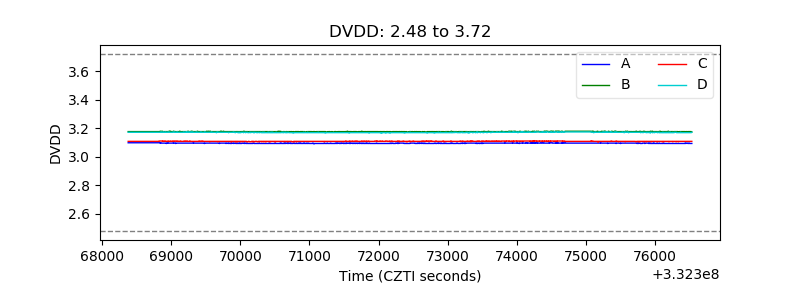 |
| Temperature 1 | 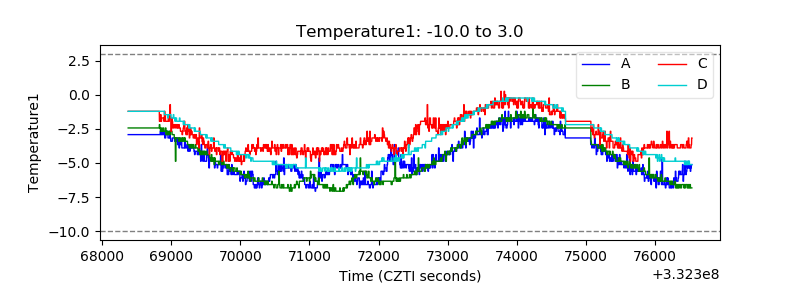 |
| Veto HV Monitor | 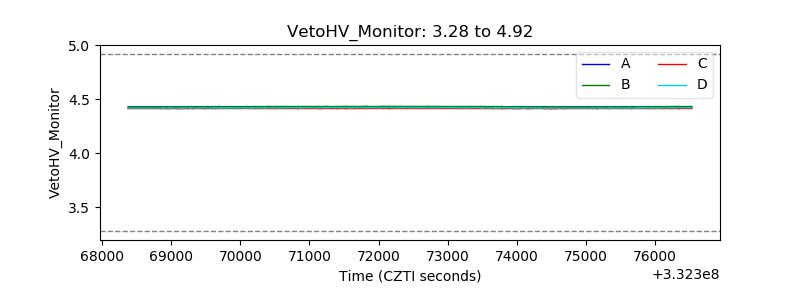 |
| Veto LLD | 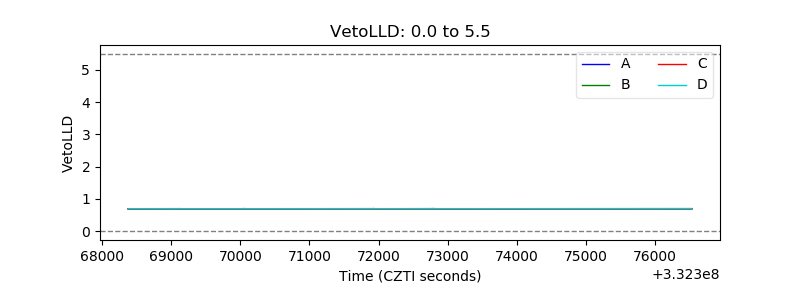 |
| Alpha Counter |  |
| _CPM_Rate |  |
| CZT Counter | 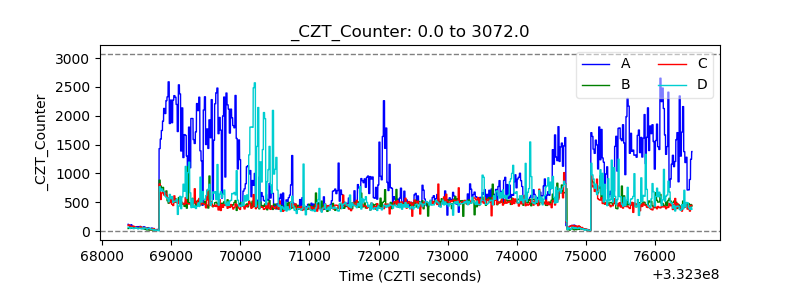 |
| +2.5 Volts monitor |  |
| +5 Volts monitor |  |
| _ROLL_ROT | 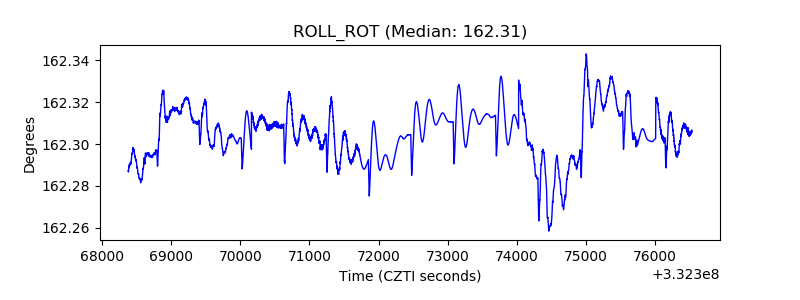 |
| _Roll_DEC | 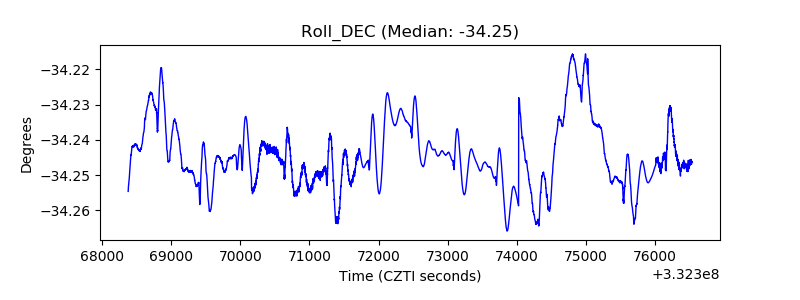 |
| _Roll_RA | 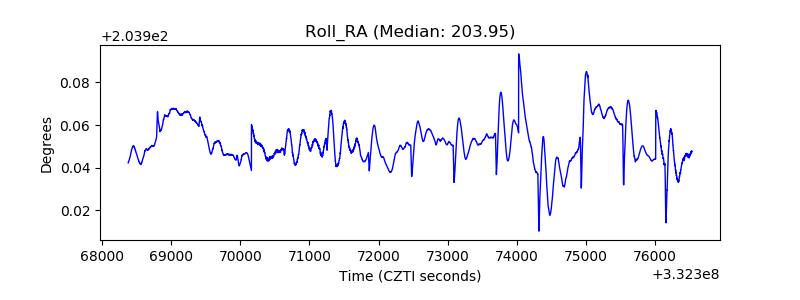 |
| Veto Counter | 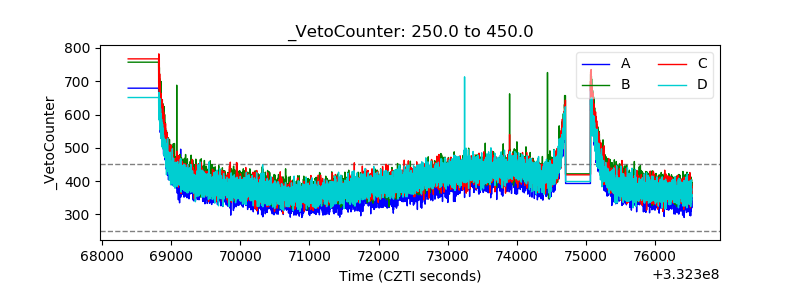 |