| Param | Original file | Final file |
|---|---|---|
| Filename | modeM0/AS1A07_068T01_9000003756_25915cztM0_level2.evt | modeM0/AS1A07_068T01_9000003756_25915cztM0_level2_quad_clean.evt |
| Size (bytes) | 933,456,960 | 87,425,280 |
| Size | 890.2 MB | 83.4 MB |
| Events in quadrant A | 16,074,336 | 319,996 |
| Events in quadrant B | 3,731,270 | 620,019 |
| Events in quadrant C | 3,657,858 | 586,368 |
| Events in quadrant D | 4,291,480 | 589,369 |
| Mode M0 | |||
|---|---|---|---|
| Quadrant | BADHDUFLAG | Total packets | Discarded packets |
| A | 0 | 52912 | 0 |
| B | 0 | 15948 | 0 |
| C | 0 | 15893 | 0 |
| D | 0 | 17878 | 0 |
| Mode M9 | |||
|---|---|---|---|
| Quadrant | BADHDUFLAG | Total packets | Discarded packets |
| A | 0 | 6 | 0 |
| B | 0 | 6 | 0 |
| C | 0 | 6 | 0 |
| D | 0 | 6 | 0 |
| Quadrant | Total seconds | Saturated seconds | Saturation percentage |
|---|---|---|---|
| A | 7611 | 5286 | 69.452109% |
| B | 7612 | 141 | 1.852338% |
| C | 7612 | 145 | 1.904887% |
| D | 7611 | 99 | 1.300749% |
Noise dominated data is calculated using 1-second bins in cleaned event files. If a bin has >2000 counts, and if more than 50% of those come from <1% of pixels, then it is considered to be noise-dominated and hence unusable.
| Quadrant | # 1 sec bins | Bins with >0 counts | Bins with >2000 counts | High rate bins dominated by noise | Noise dominated (total time) | Noise dominated (detector-on time) | Marked lightcurve |
|---|---|---|---|---|---|---|---|
| A | 8311 | 7612 | 4602 | 4602 | 55.37% | 60.46% | 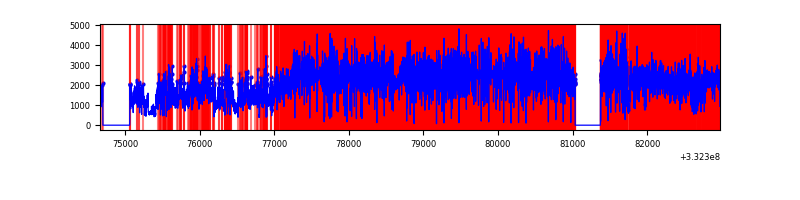 |
| B | 8312 | 7614 | 0 | 0 | 0.00% | 0.00% | 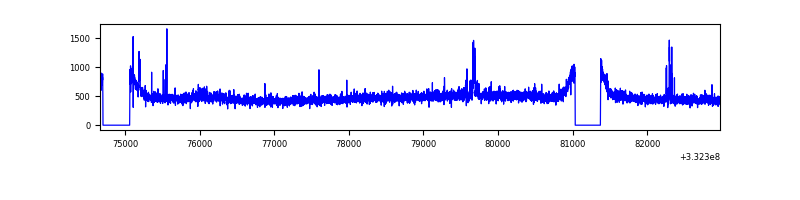 |
| C | 8312 | 7614 | 6 | 6 | 0.07% | 0.08% | 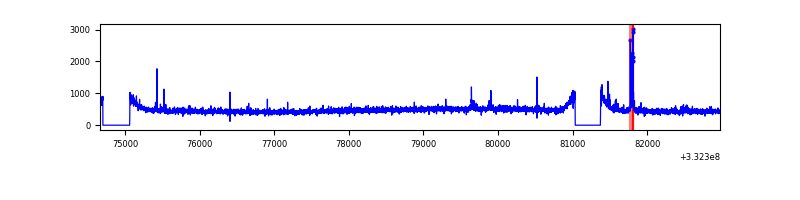 |
| D | 8311 | 7613 | 37 | 37 | 0.45% | 0.49% | 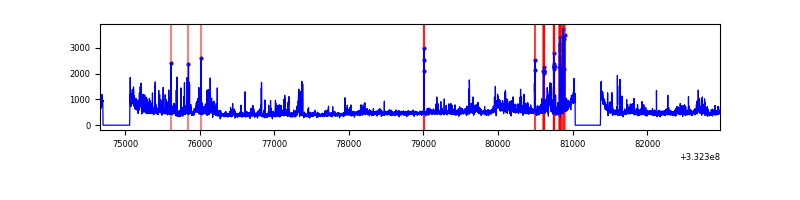 |
Top three noisy pixels from each quadrant. If the there are fewer than three noisy pixels in the level2.evt file, extra rows are filled as -1
| Pixel properties | Quadrant properties | ||||||
|---|---|---|---|---|---|---|---|
| Quadrant | DetID | PixID | Counts | Sigma | Mean | Median | Sigma |
| A | 0 | 13 | 13822813 | 117467.21 | 581 | 569 | 117.7 |
| A | 12 | 16 | 8584 | 68.11 | 581 | 569 | 117.7 |
| A | 13 | 254 | 7786 | 61.33 | 581 | 569 | 117.7 |
| B | 0 | 219 | 56304 | 308.28 | 920 | 896 | 179.7 |
| B | 0 | 190 | 41463 | 225.7 | 920 | 896 | 179.7 |
| B | 12 | 111 | 22279 | 118.97 | 920 | 896 | 179.7 |
| C | 14 | 238 | 141249 | 680.92 | 878 | 883 | 206.1 |
| C | 2 | 16 | 51815 | 247.07 | 878 | 883 | 206.1 |
| C | 3 | 233 | 44589 | 212.02 | 878 | 883 | 206.1 |
| D | 1 | 52 | 835462 | 3874.52 | 892 | 868 | 215.4 |
| D | 7 | 80 | 63191 | 289.33 | 892 | 868 | 215.4 |
| D | 2 | 234 | 32224 | 145.57 | 892 | 868 | 215.4 |
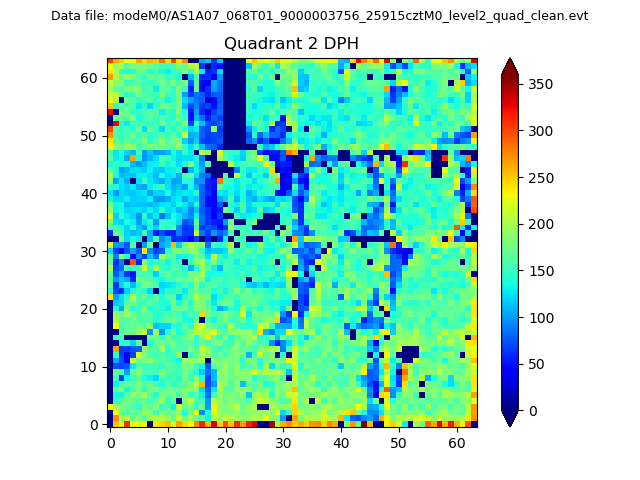
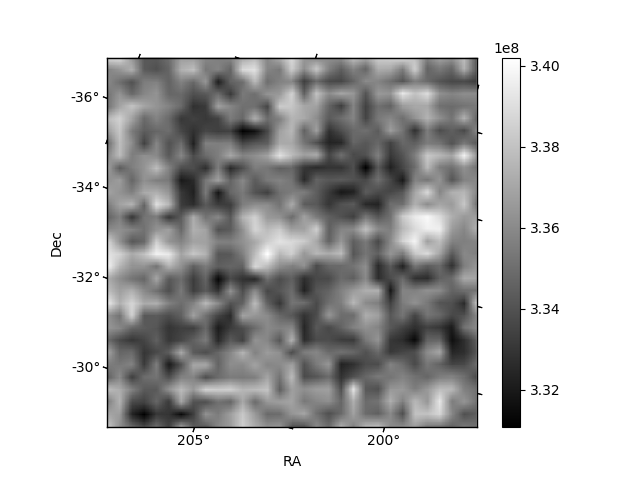
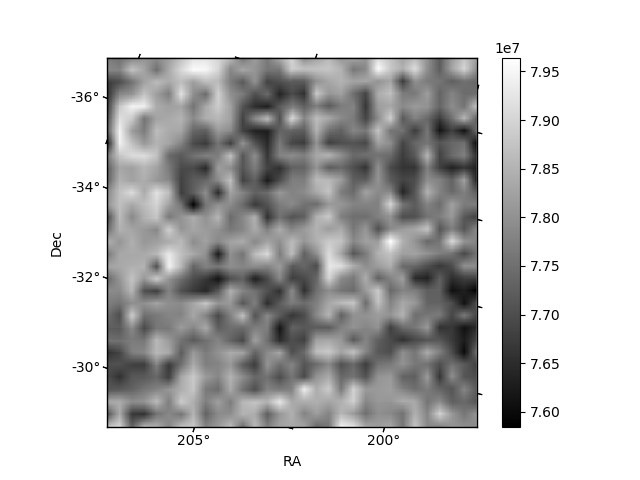
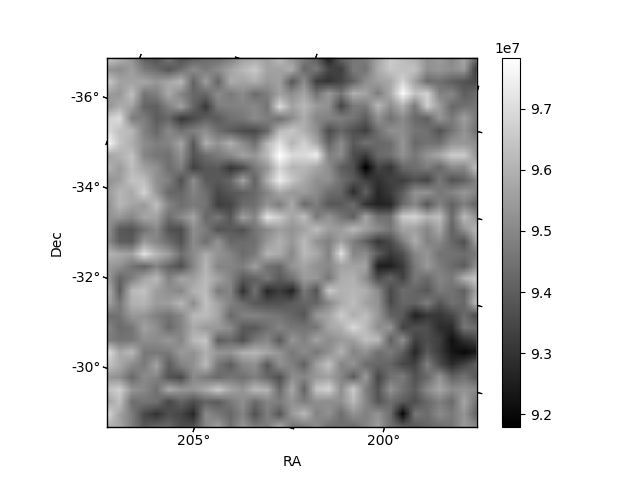
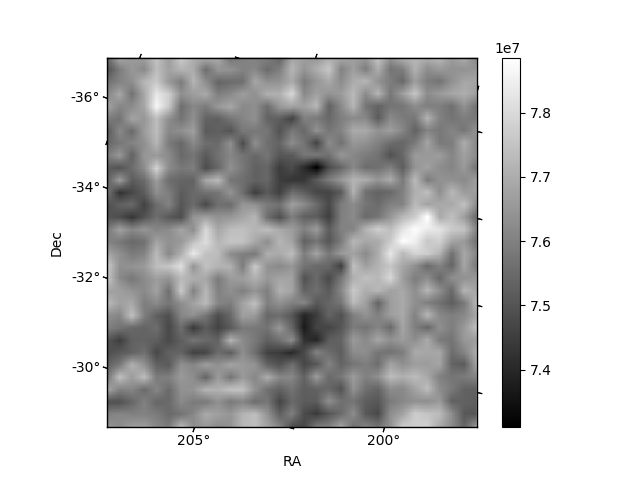
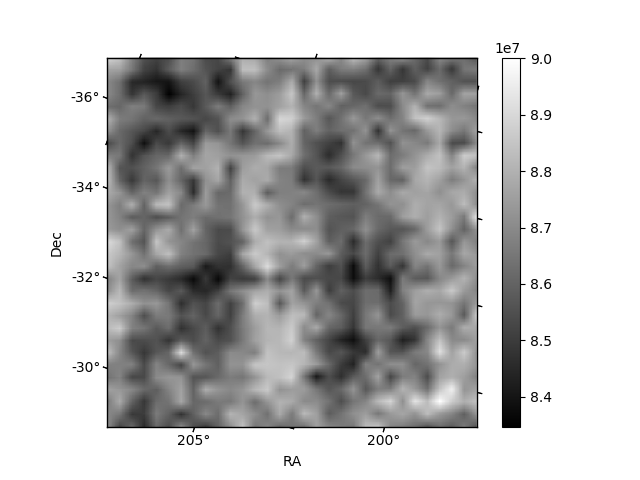
Histogram calculated using DETX and DETY for each event in the final _common_clean file
| Quadrant A | 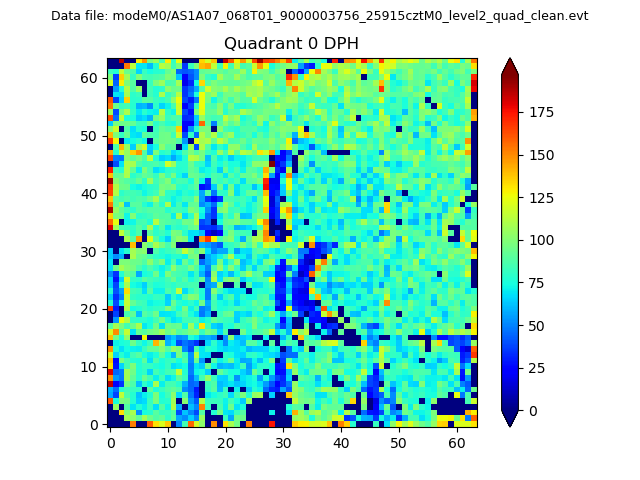 |
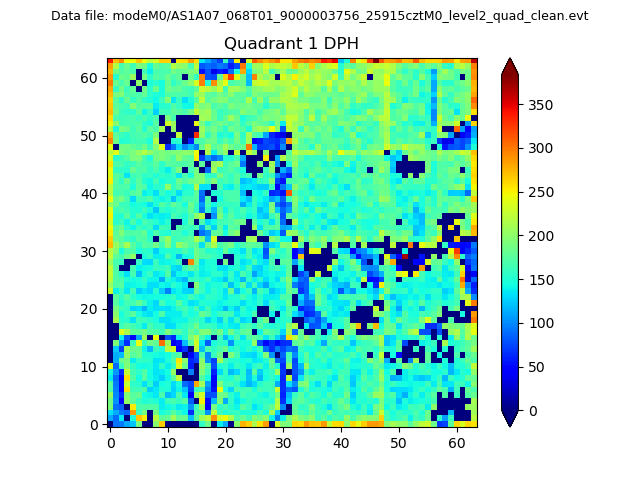 |
Quadrant B |
|---|---|---|---|
| Quadrant D | 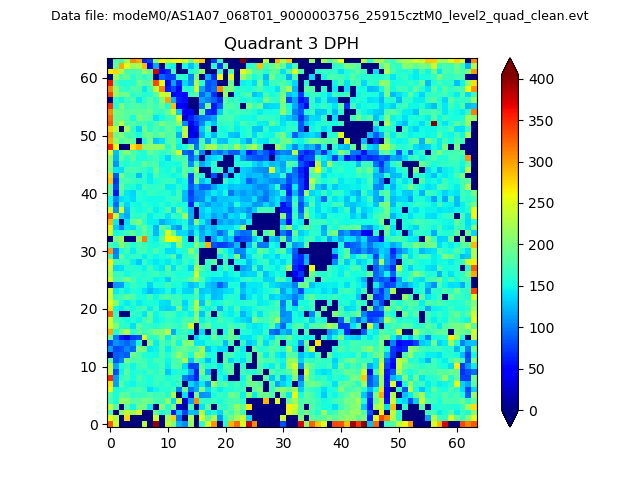 |
 |
Quadrant C |
| Plot type | Count rate plots | Images |
|---|---|---|
| Comparison with Poisson distribution Blue bars denote a histogram of data divided into 1 sec bins. Red curve is a Poisson curve with rate = median count rate of data. |
 |
 |
| Quadrant-wise count rates Data is divided into 100 sec bins |
 |
|
| Module-wise count rates for Quadrant A Data is divided into 100 sec bins |
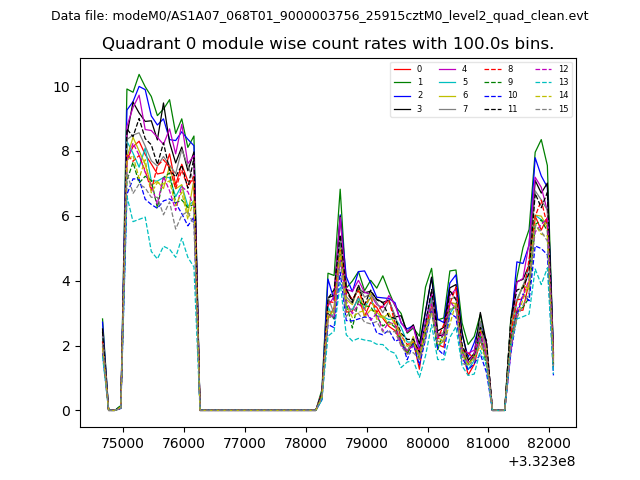 |
 |
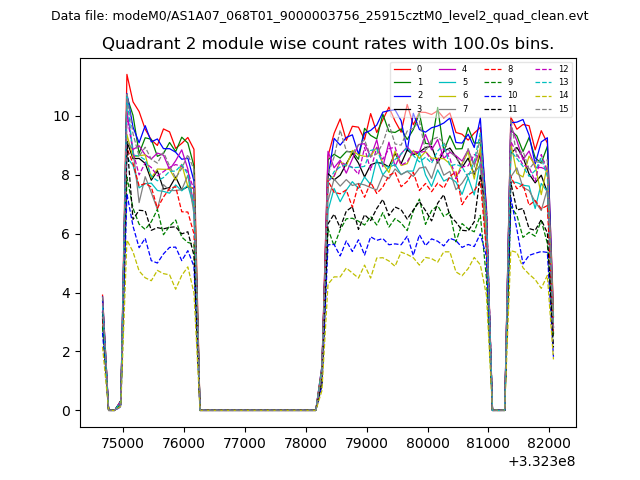
| Module-wise count rates for Quadrant B Data is divided into 100 sec bins |
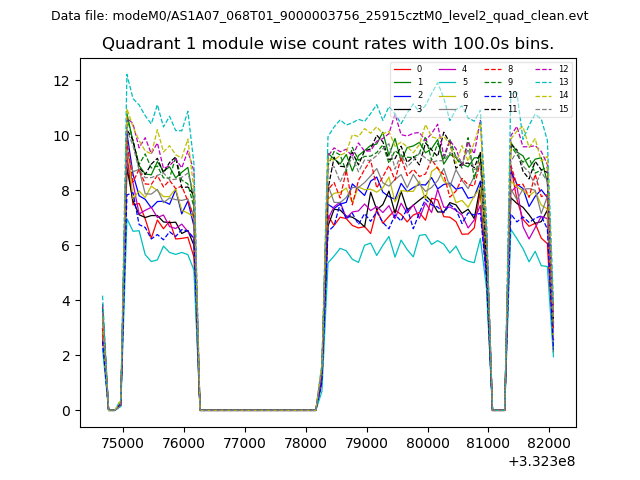 |
 |
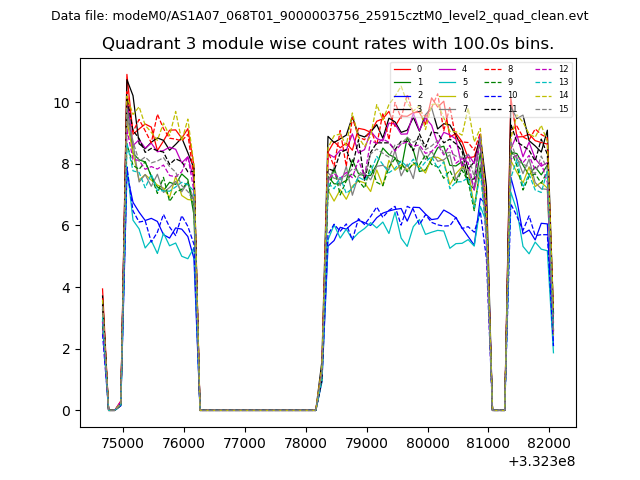
| Module-wise count rates for Quadrant C Data is divided into 100 sec bins |
 |
 |
| Module-wise count rates for Quadrant D Data is divided into 100 sec bins |
 |
 |
| Parameter | Plot |
|---|---|
| CZT HV Monitor | 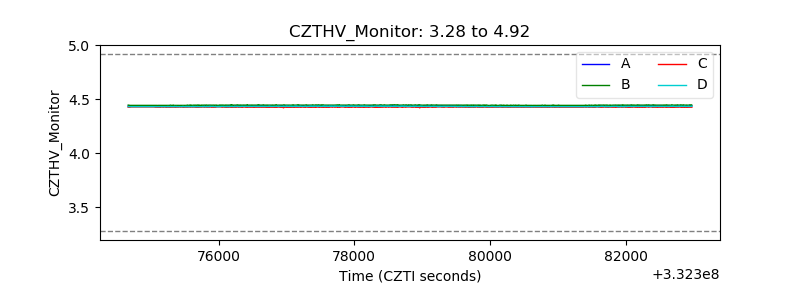 |
| D_VDD | 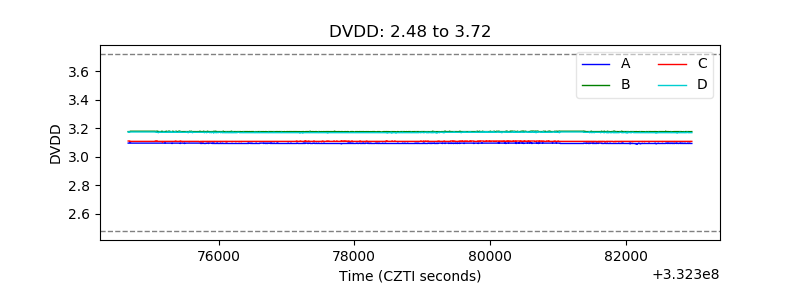 |
| Temperature 1 | 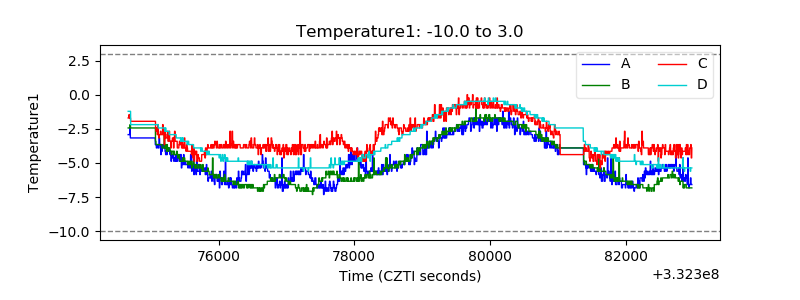 |
| Veto HV Monitor | 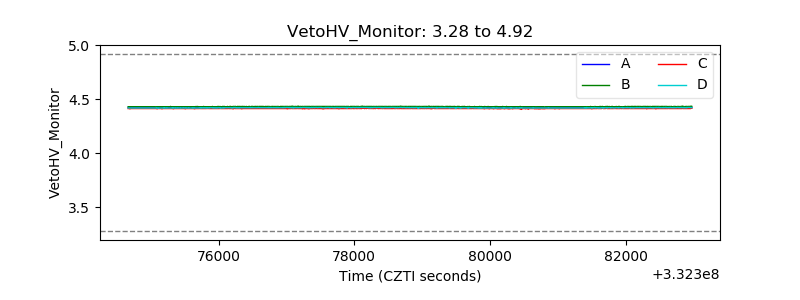 |
| Veto LLD | 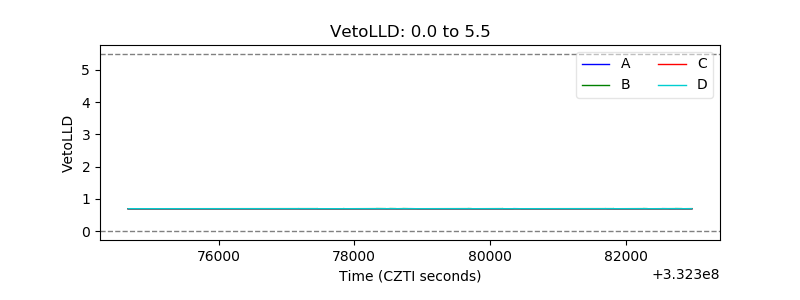 |
| Alpha Counter |  |
| _CPM_Rate |  |
| CZT Counter | 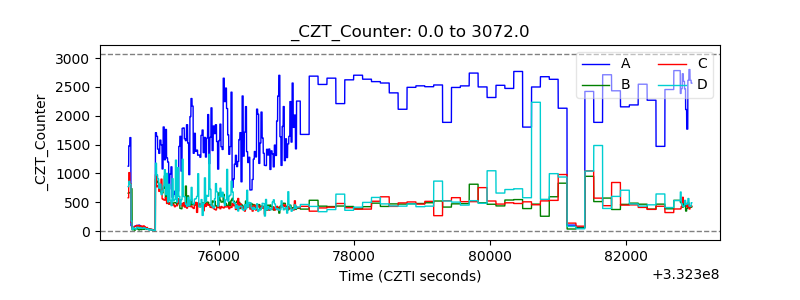 |
| +2.5 Volts monitor |  |
| +5 Volts monitor |  |
| _ROLL_ROT | 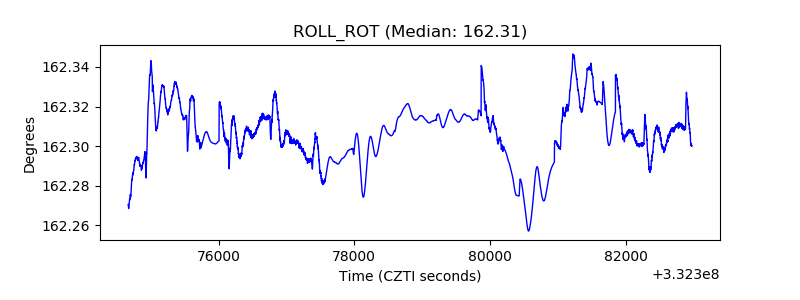 |
| _Roll_DEC | 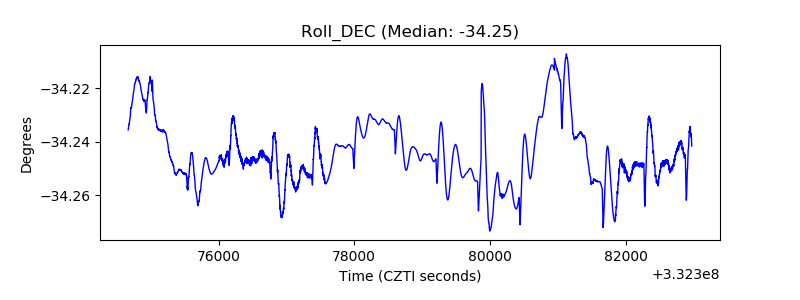 |
| _Roll_RA | 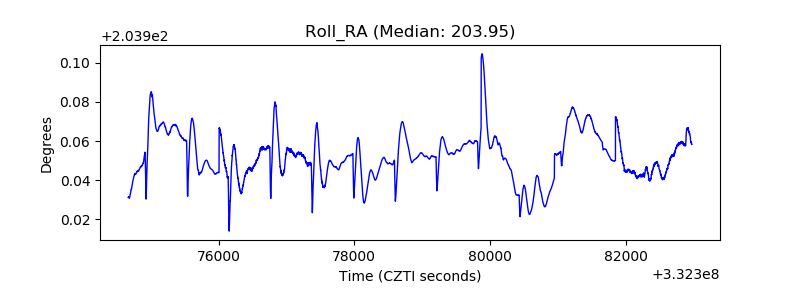 |
| Veto Counter | 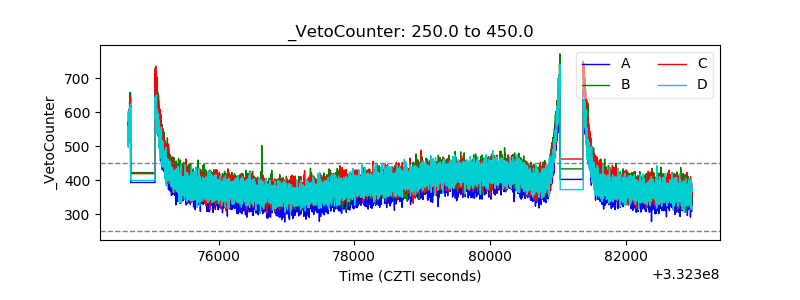 |