| Param | Original file | Final file |
|---|---|---|
| Filename | modeM0/AS1A07_068T01_9000003756_25918cztM0_level2.evt | modeM0/AS1A07_068T01_9000003756_25918cztM0_level2_quad_clean.evt |
| Size (bytes) | 461,318,400 | 41,754,240 |
| Size | 439.9 MB | 39.8 MB |
| Events in quadrant A | 7,712,588 | 210,095 |
| Events in quadrant B | 1,889,029 | 264,095 |
| Events in quadrant C | 1,979,719 | 249,468 |
| Events in quadrant D | 2,109,205 | 248,900 |
| Mode M0 | |||
|---|---|---|---|
| Quadrant | BADHDUFLAG | Total packets | Discarded packets |
| A | 0 | 25753 | 0 |
| B | 0 | 8353 | 0 |
| C | 0 | 8605 | 0 |
| D | 0 | 8857 | 0 |
| Quadrant | Total seconds | Saturated seconds | Saturation percentage |
|---|---|---|---|
| A | 4122 | 2091 | 50.727802% |
| B | 4123 | 6 | 0.145525% |
| C | 4123 | 28 | 0.679117% |
| D | 4123 | 2 | 0.048508% |
Noise dominated data is calculated using 1-second bins in cleaned event files. If a bin has >2000 counts, and if more than 50% of those come from <1% of pixels, then it is considered to be noise-dominated and hence unusable.
| Quadrant | # 1 sec bins | Bins with >0 counts | Bins with >2000 counts | High rate bins dominated by noise | Noise dominated (total time) | Noise dominated (detector-on time) | Marked lightcurve |
|---|---|---|---|---|---|---|---|
| A | 4122 | 4122 | 1881 | 1881 | 45.63% | 45.63% | 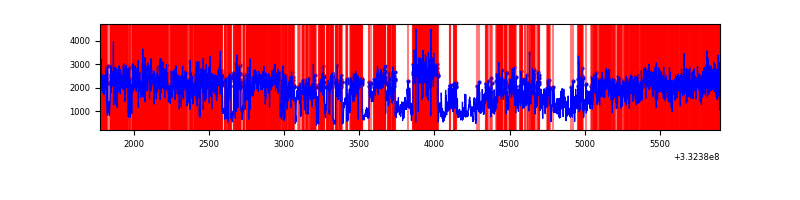 |
| B | 4123 | 4123 | 2 | 2 | 0.05% | 0.05% | 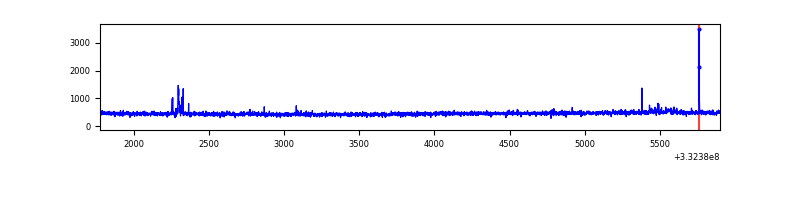 |
| C | 4123 | 4123 | 7 | 7 | 0.17% | 0.17% | 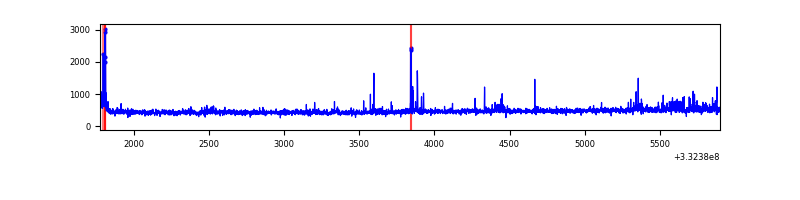 |
| D | 4123 | 4123 | 1 | 1 | 0.02% | 0.02% | 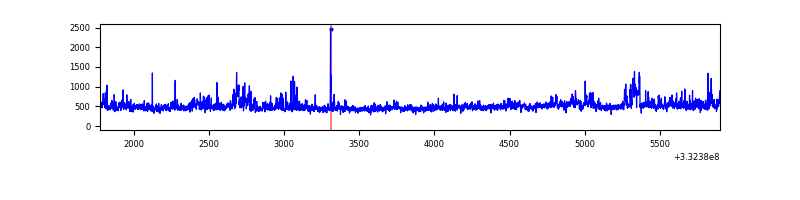 |
Top three noisy pixels from each quadrant. If the there are fewer than three noisy pixels in the level2.evt file, extra rows are filled as -1
| Pixel properties | Quadrant properties | ||||||
|---|---|---|---|---|---|---|---|
| Quadrant | DetID | PixID | Counts | Sigma | Mean | Median | Sigma |
| A | 0 | 13 | 6103367 | 72596.41 | 411 | 403 | 84.1 |
| A | 6 | 16 | 11436 | 131.24 | 411 | 403 | 84.1 |
| A | 12 | 16 | 7732 | 87.18 | 411 | 403 | 84.1 |
| B | 10 | 245 | 16534 | 174.64 | 471 | 459 | 92.0 |
| B | 12 | 111 | 11313 | 117.92 | 471 | 459 | 92.0 |
| B | 11 | 111 | 10271 | 106.6 | 471 | 459 | 92.0 |
| C | 3 | 233 | 75704 | 701.73 | 454 | 456 | 107.2 |
| C | 14 | 238 | 74161 | 687.34 | 454 | 456 | 107.2 |
| C | 2 | 16 | 61709 | 571.22 | 454 | 456 | 107.2 |
| D | 1 | 52 | 191835 | 1731.04 | 460 | 448 | 110.6 |
| D | 7 | 80 | 169674 | 1530.6 | 460 | 448 | 110.6 |
| D | 2 | 234 | 17671 | 155.78 | 460 | 448 | 110.6 |
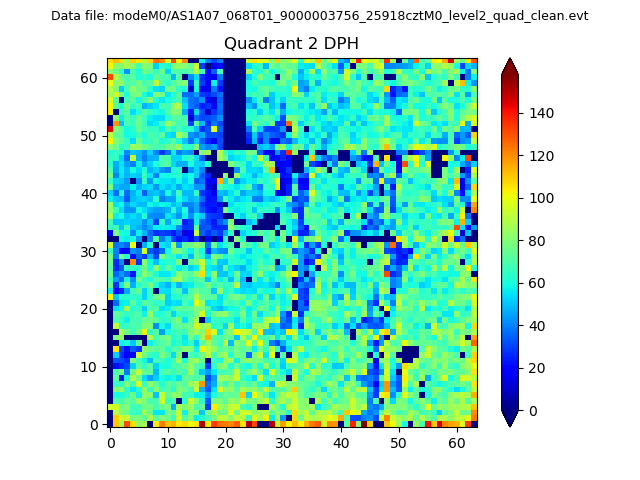
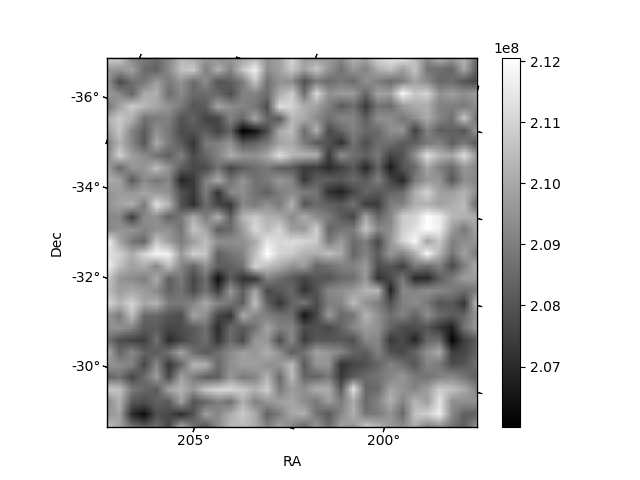
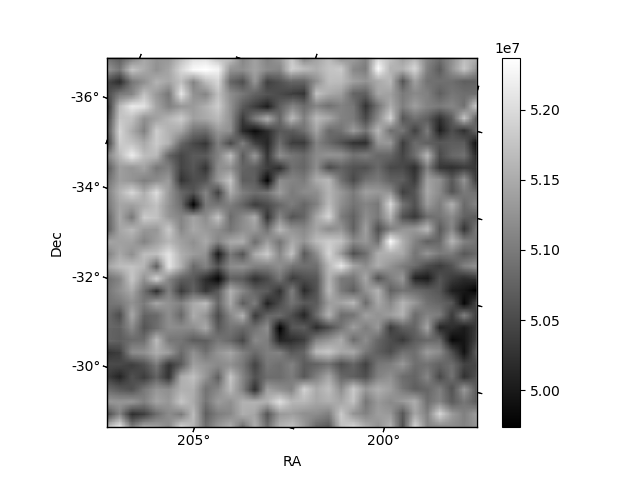
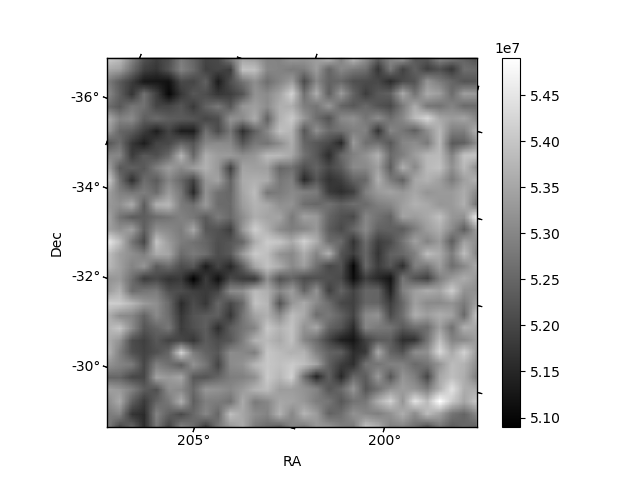
Histogram calculated using DETX and DETY for each event in the final _common_clean file
| Quadrant A | 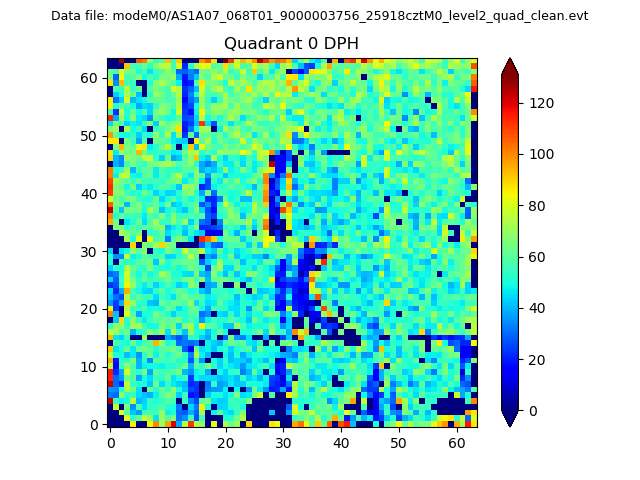 |
 |
Quadrant B |
|---|---|---|---|
| Quadrant D | 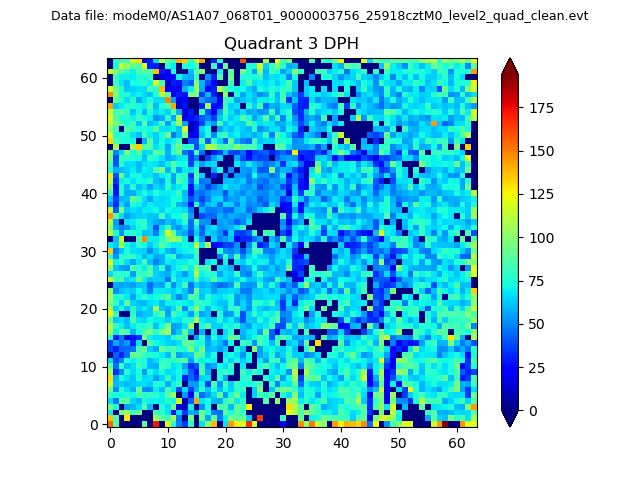 |
 |
Quadrant C |
| Plot type | Count rate plots | Images |
|---|---|---|
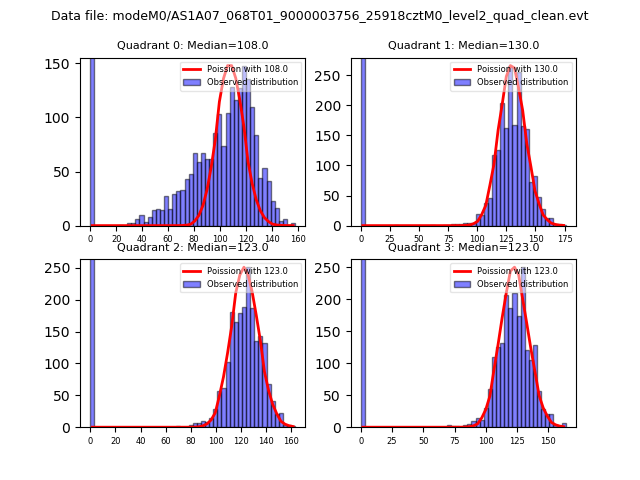
| Comparison with Poisson distribution Blue bars denote a histogram of data divided into 1 sec bins. Red curve is a Poisson curve with rate = median count rate of data. |
 |
 |
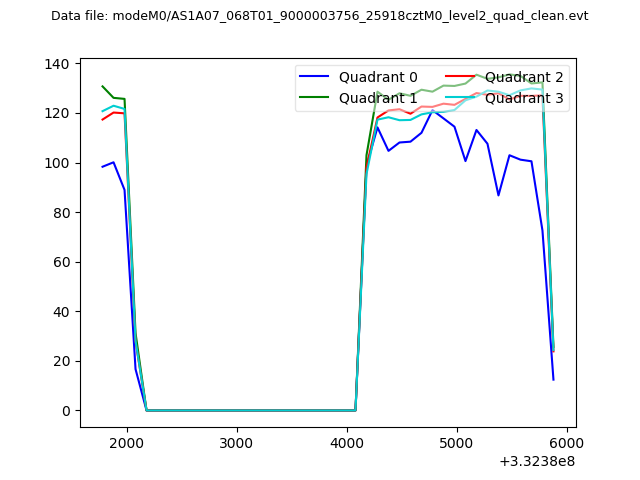
| Quadrant-wise count rates Data is divided into 100 sec bins |
 |
|
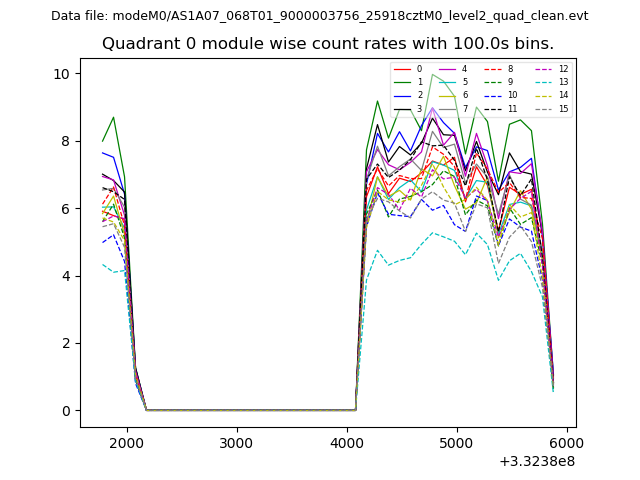
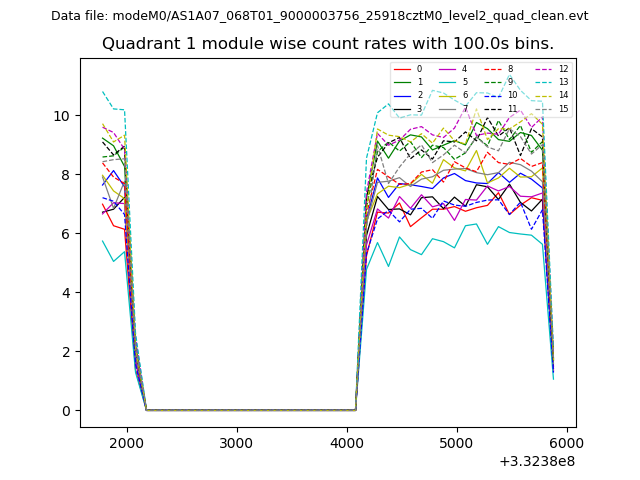
| Module-wise count rates for Quadrant A Data is divided into 100 sec bins |
 |
 |
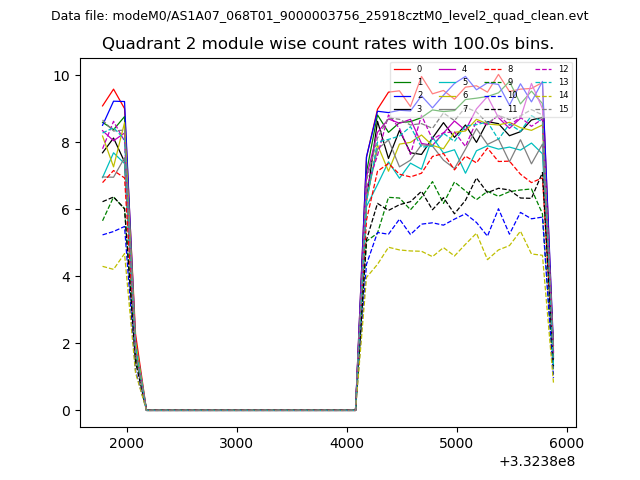
| Module-wise count rates for Quadrant B Data is divided into 100 sec bins |
 |
 |
| Module-wise count rates for Quadrant C Data is divided into 100 sec bins |
 |
 |
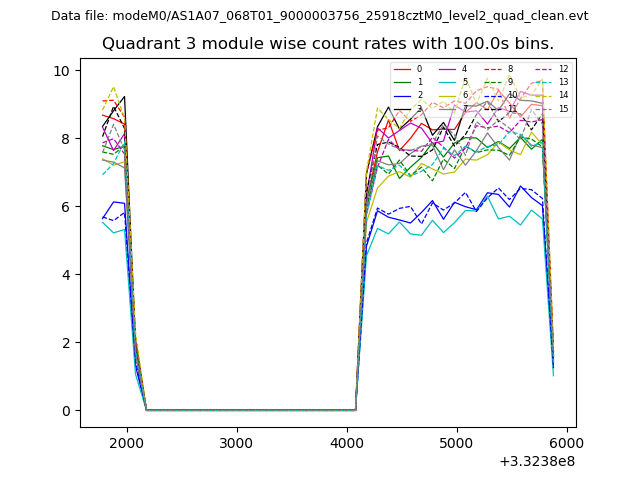
| Module-wise count rates for Quadrant D Data is divided into 100 sec bins |
 |
 |
| Parameter | Plot |
|---|---|
| CZT HV Monitor | 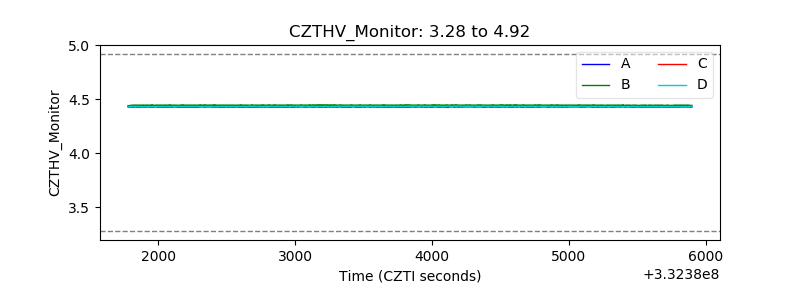 |
| D_VDD | 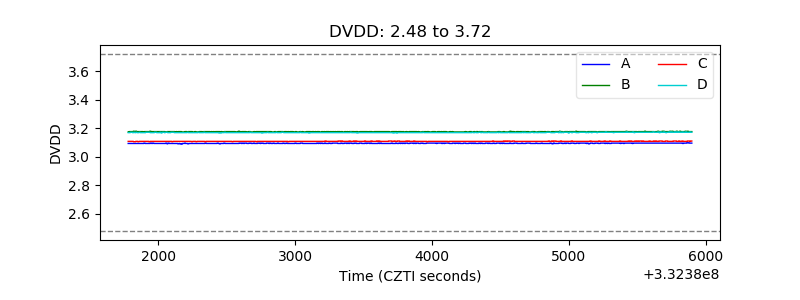 |
| Temperature 1 | 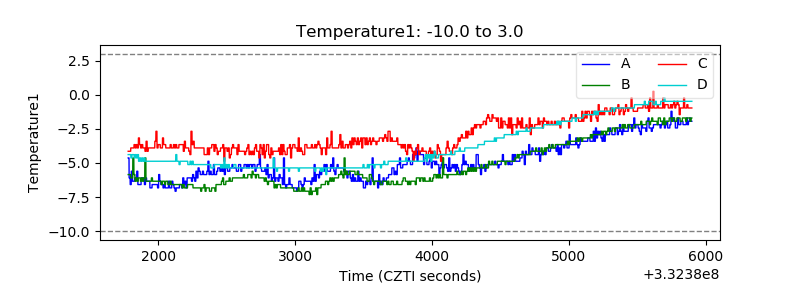 |
| Veto HV Monitor |  |
| Veto LLD | 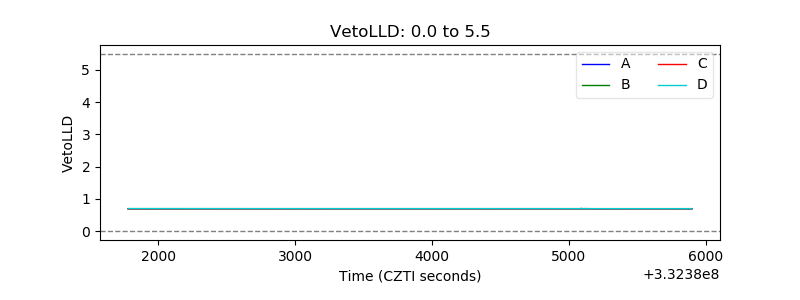 |
| Alpha Counter | 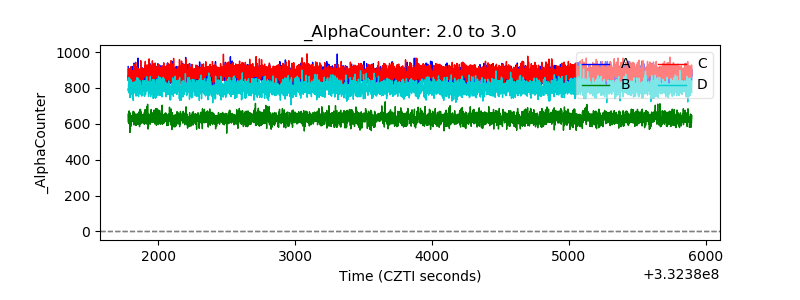 |
| _CPM_Rate | 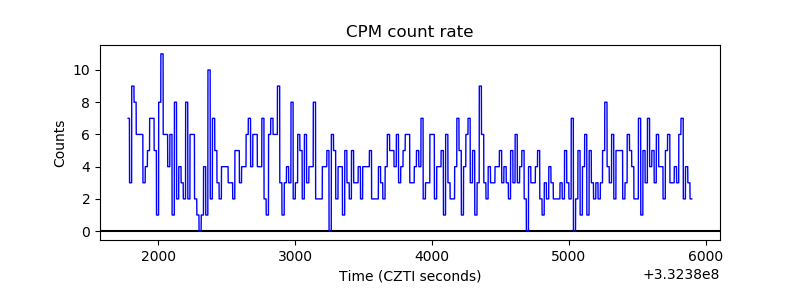 |
| CZT Counter | 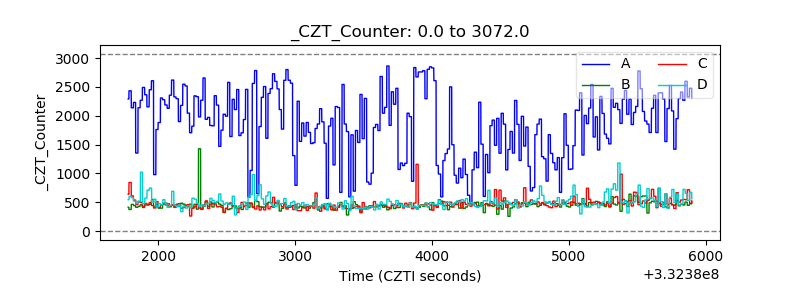 |
| +2.5 Volts monitor | 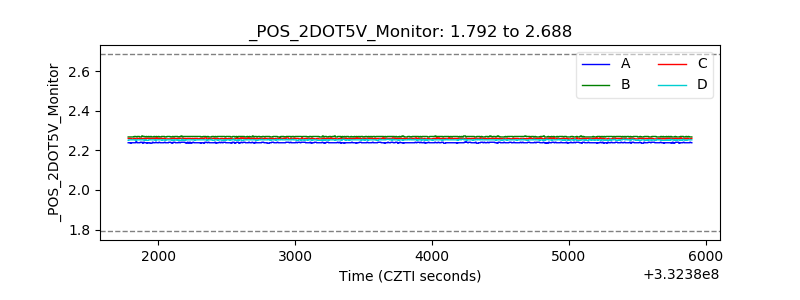 |
| +5 Volts monitor |  |
| _ROLL_ROT | 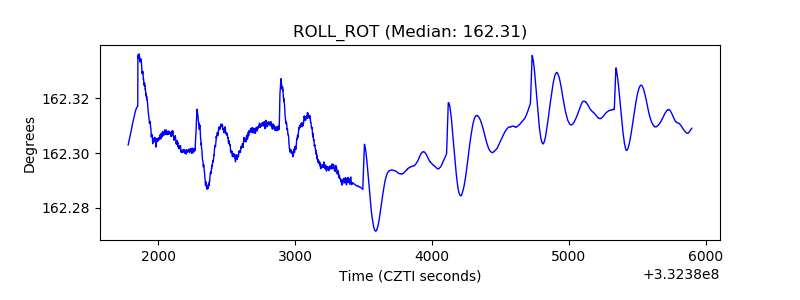 |
| _Roll_DEC | 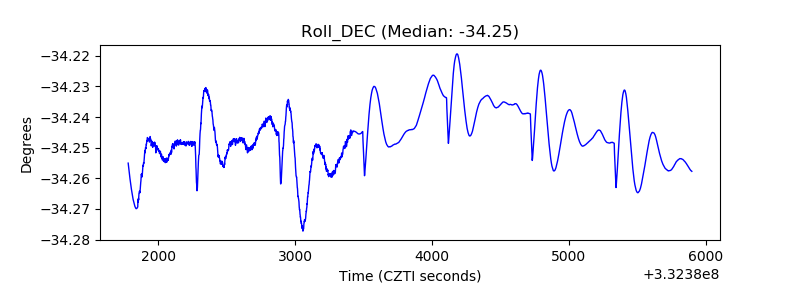 |
| _Roll_RA | 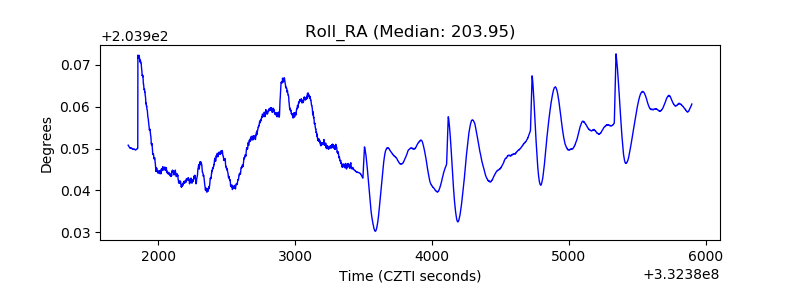 |
| Veto Counter | 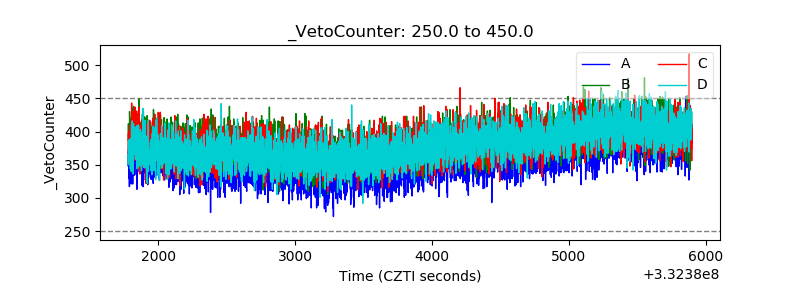 |