| Param | Original file | Final file |
|---|---|---|
| Filename | modeM0/AS1A07_068T01_9000003756_25981cztM0_level2.evt | modeM0/AS1A07_068T01_9000003756_25981cztM0_level2_quad_clean.evt |
| Size (bytes) | 134,308,800 | 14,952,960 |
| Size | 128.1 MB | 14.3 MB |
| Events in quadrant A | 956,736 | 86,060 |
| Events in quadrant B | 927,985 | 87,687 |
| Events in quadrant C | 966,535 | 79,691 |
| Events in quadrant D | 1,106,400 | 81,924 |
| Mode M0 | |||
|---|---|---|---|
| Quadrant | BADHDUFLAG | Total packets | Discarded packets |
| A | 0 | 4034 | 0 |
| B | 0 | 3862 | 0 |
| C | 0 | 4048 | 0 |
| D | 0 | 4406 | 0 |
| Mode M9 | |||
|---|---|---|---|
| Quadrant | BADHDUFLAG | Total packets | Discarded packets |
| A | 0 | 13 | 4 |
| B | 0 | 14 | 5 |
| C | 0 | 12 | 4 |
| D | 0 | 13 | 6 |
| Quadrant | Total seconds | Saturated seconds | Saturation percentage |
|---|---|---|---|
| A | 1499 | 17 | 1.134089% |
| B | 1505 | 15 | 0.996678% |
| C | 1503 | 43 | 2.860945% |
| D | 1500 | 61 | 4.066667% |
Noise dominated data is calculated using 1-second bins in cleaned event files. If a bin has >2000 counts, and if more than 50% of those come from <1% of pixels, then it is considered to be noise-dominated and hence unusable.
| Quadrant | # 1 sec bins | Bins with >0 counts | Bins with >2000 counts | High rate bins dominated by noise | Noise dominated (total time) | Noise dominated (detector-on time) | Marked lightcurve |
|---|---|---|---|---|---|---|---|
| A | 3829 | 1558 | 0 | 0 | 0.00% | 0.00% | 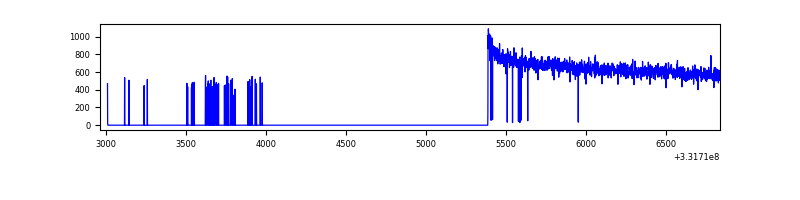 |
| B | 3876 | 1562 | 0 | 0 | 0.00% | 0.00% | 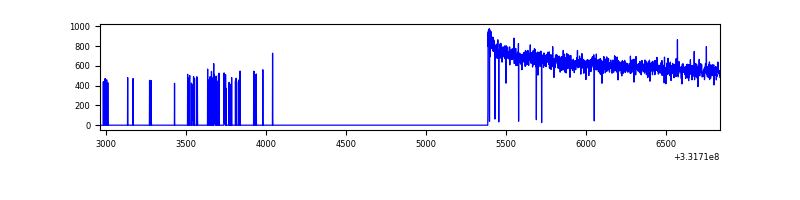 |
| C | 3692 | 1554 | 0 | 0 | 0.00% | 0.00% | 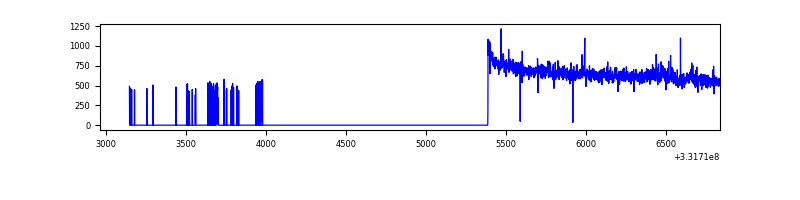 |
| D | 3869 | 1547 | 54 | 54 | 1.40% | 3.49% | 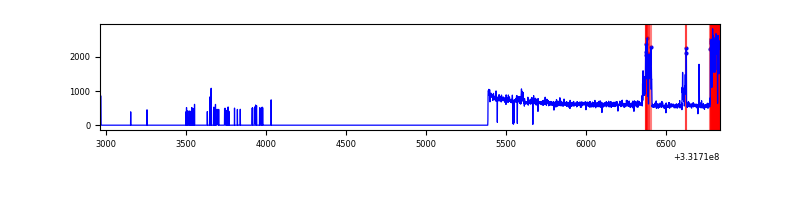 |
Top three noisy pixels from each quadrant. If the there are fewer than three noisy pixels in the level2.evt file, extra rows are filled as -1
| Pixel properties | Quadrant properties | ||||||
|---|---|---|---|---|---|---|---|
| Quadrant | DetID | PixID | Counts | Sigma | Mean | Median | Sigma |
| A | 10 | 229 | 7371 | 143.79 | 246 | 242 | 49.6 |
| A | 0 | 226 | 2089 | 37.25 | 246 | 242 | 49.6 |
| A | 13 | 254 | 2003 | 35.52 | 246 | 242 | 49.6 |
| B | 12 | 111 | 5044 | 104.84 | 237 | 232 | 45.9 |
| B | 11 | 111 | 4758 | 98.61 | 237 | 232 | 45.9 |
| B | 14 | 111 | 4513 | 93.27 | 237 | 232 | 45.9 |
| C | 14 | 238 | 37754 | 700.69 | 230 | 231 | 53.6 |
| C | 3 | 233 | 18323 | 337.84 | 230 | 231 | 53.6 |
| C | 0 | 207 | 12142 | 222.42 | 230 | 231 | 53.6 |
| D | 12 | 233 | 155059 | 2712.11 | 237 | 231 | 57.1 |
| D | 1 | 52 | 49126 | 856.49 | 237 | 231 | 57.1 |
| D | 2 | 234 | 4268 | 70.72 | 237 | 231 | 57.1 |
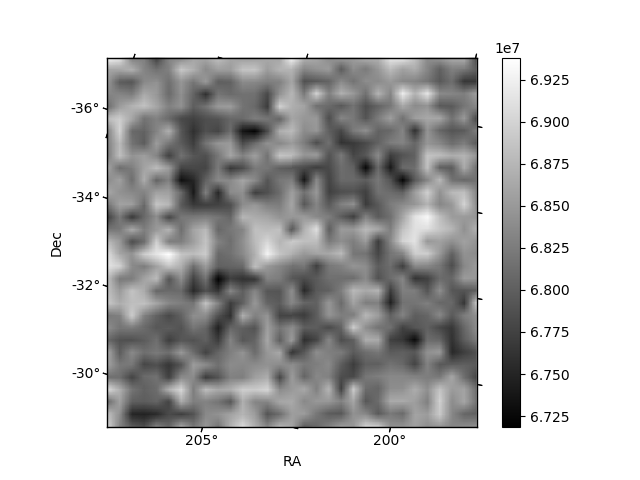
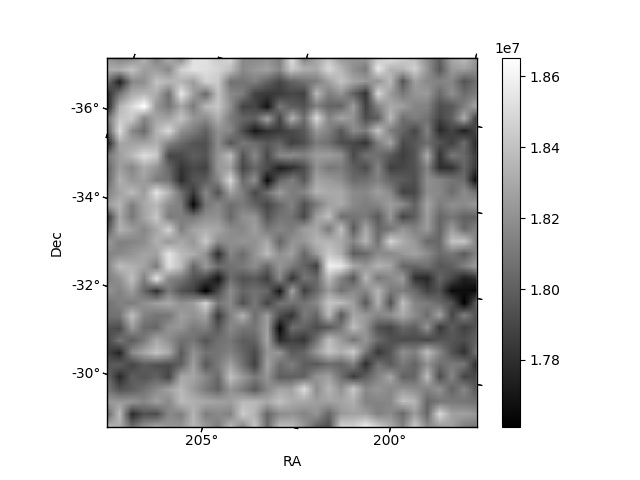
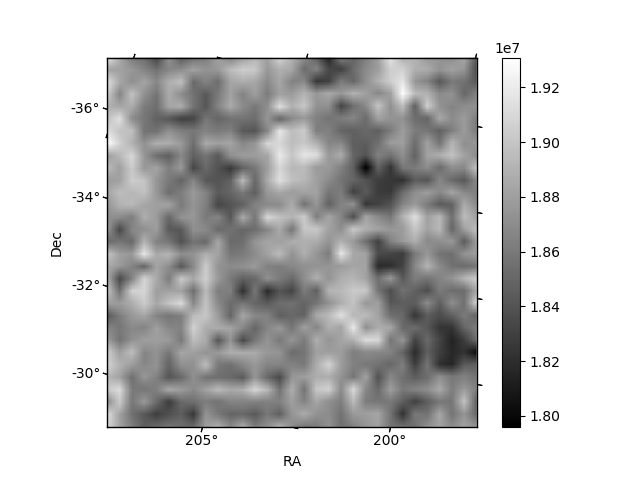
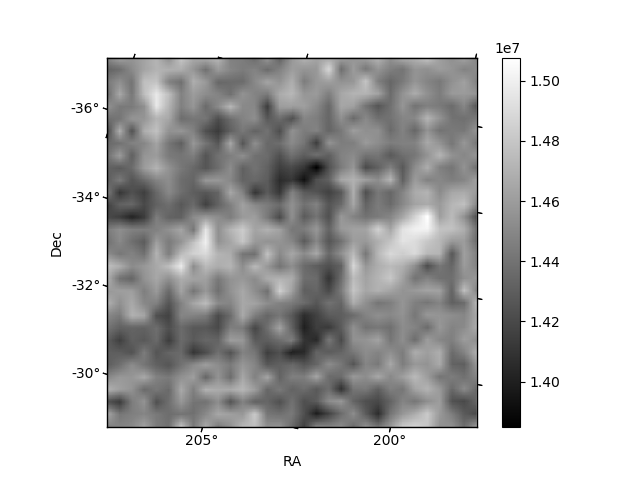
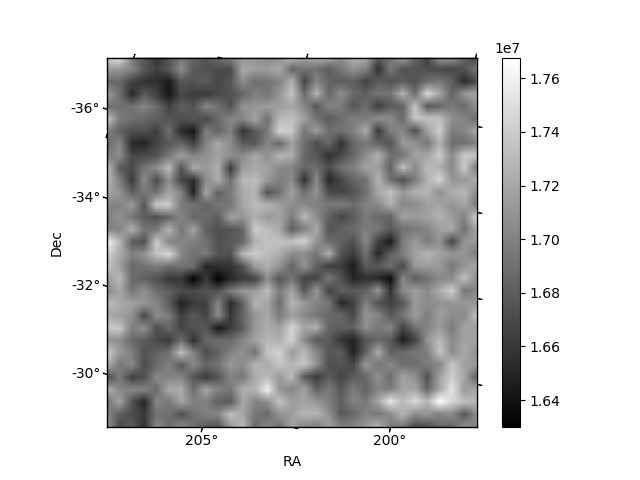
Histogram calculated using DETX and DETY for each event in the final _common_clean file
| Quadrant A | 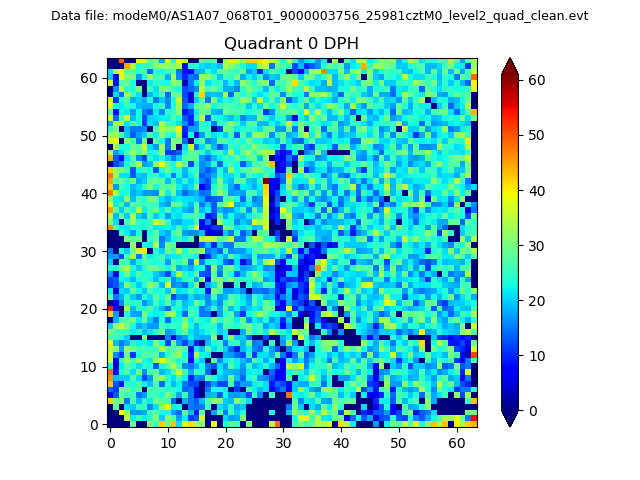 |
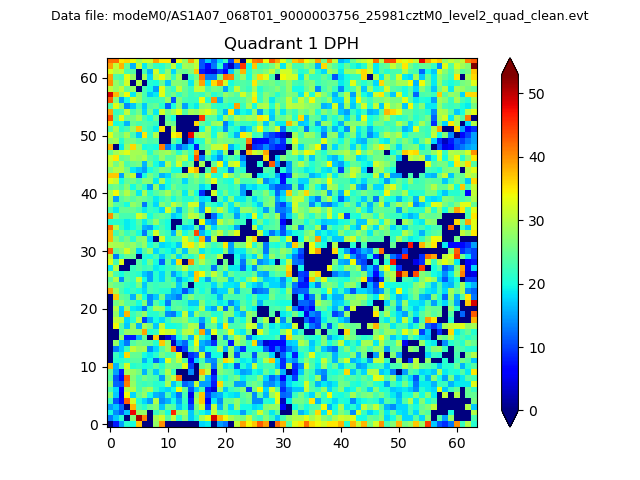 |
Quadrant B |
|---|---|---|---|
| Quadrant D | 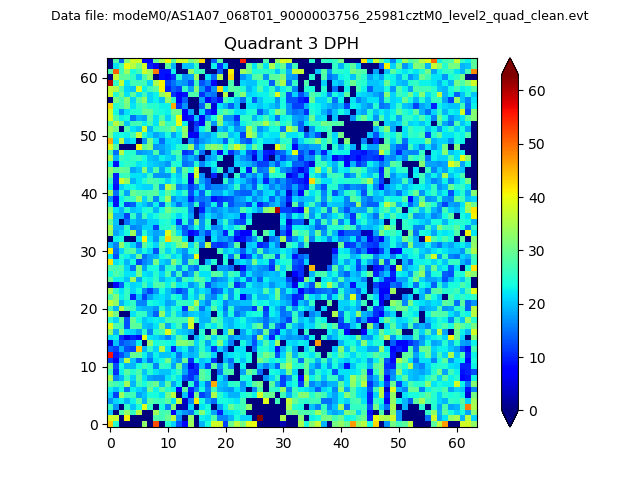 |
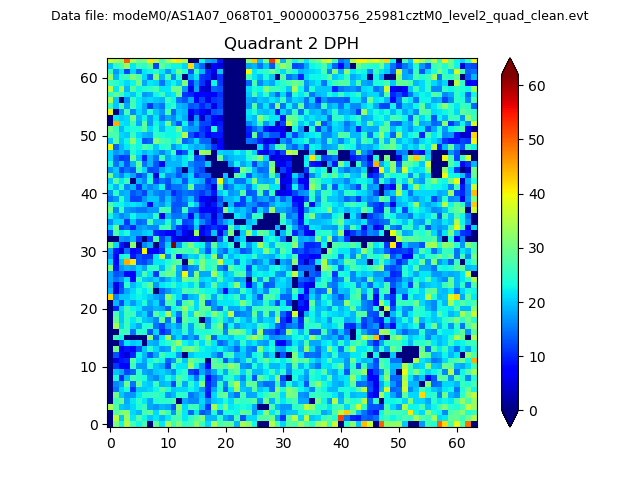 |
Quadrant C |
| Plot type | Count rate plots | Images |
|---|---|---|
| Comparison with Poisson distribution Blue bars denote a histogram of data divided into 1 sec bins. Red curve is a Poisson curve with rate = median count rate of data. |
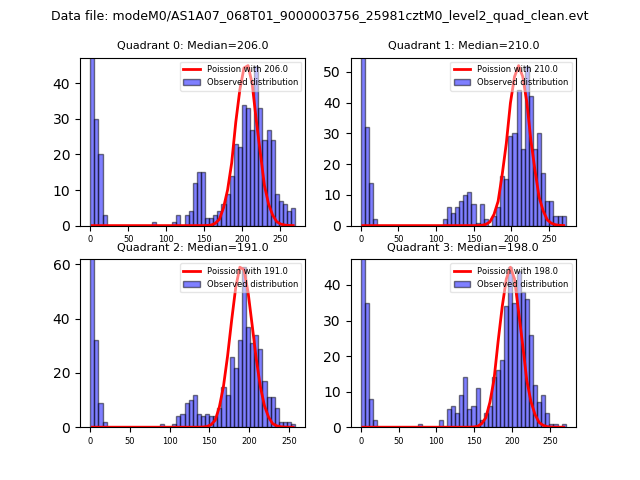 |
 |
| Quadrant-wise count rates Data is divided into 100 sec bins |
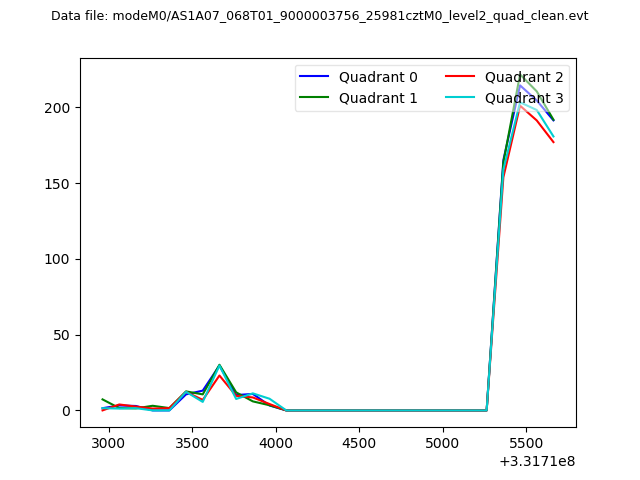 |
|
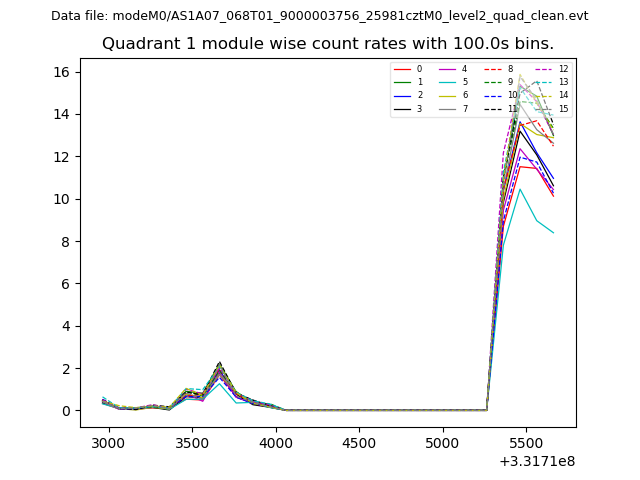
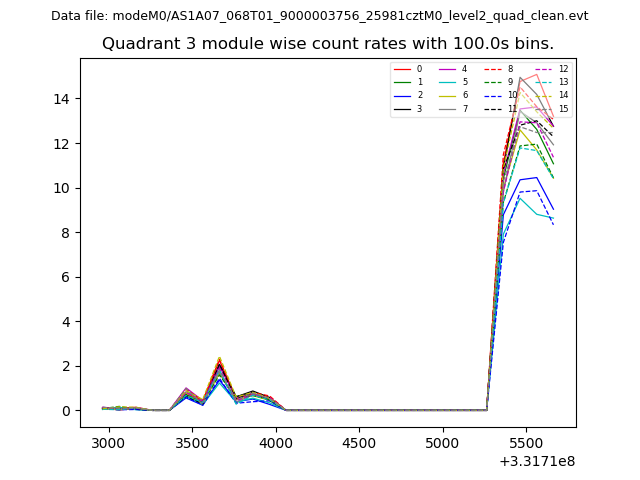
| Module-wise count rates for Quadrant A Data is divided into 100 sec bins |
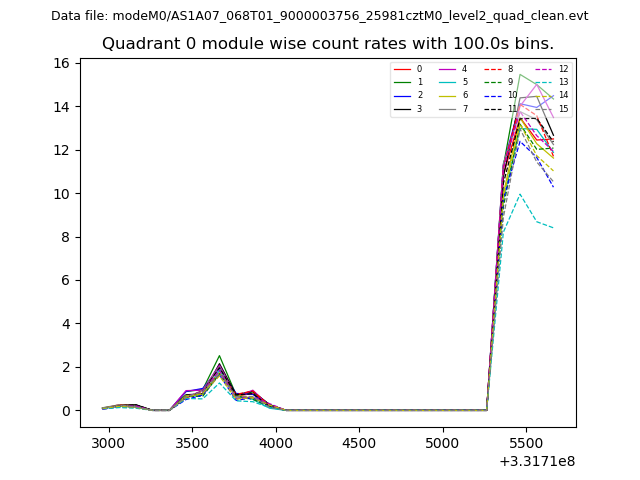 |
 |
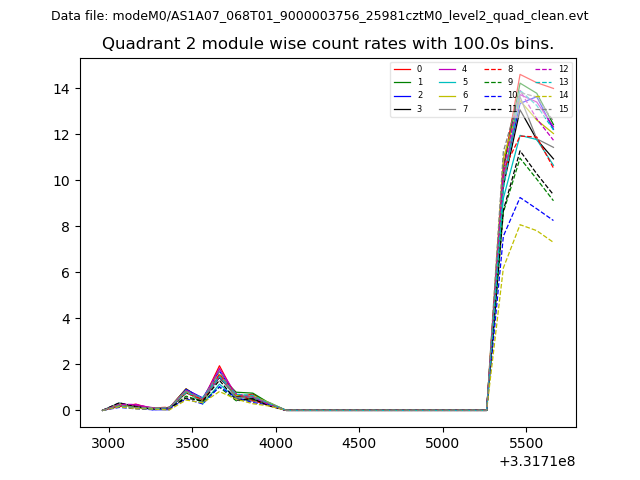
| Module-wise count rates for Quadrant B Data is divided into 100 sec bins |
 |
 |
| Module-wise count rates for Quadrant C Data is divided into 100 sec bins |
 |
 |
| Module-wise count rates for Quadrant D Data is divided into 100 sec bins |
 |
 |
| Parameter | Plot |
|---|---|
| CZT HV Monitor | 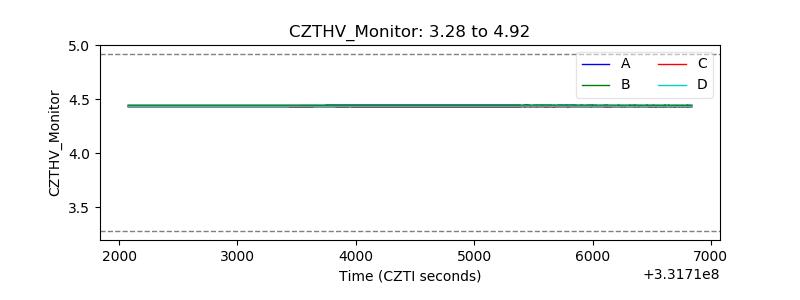 |
| D_VDD | 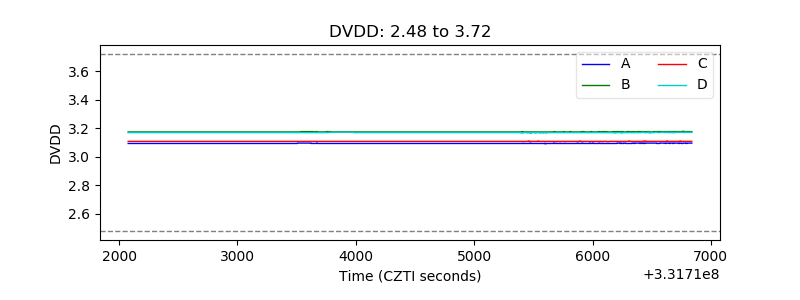 |
| Temperature 1 | 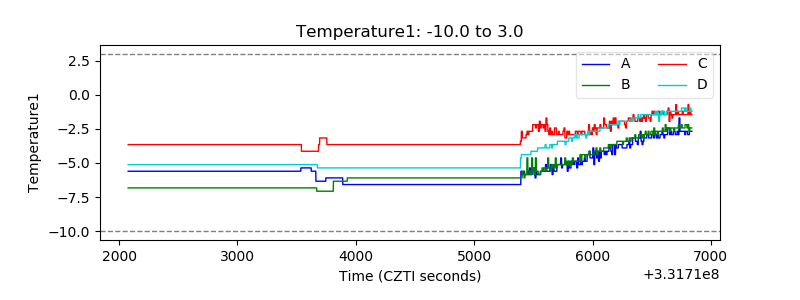 |
| Veto HV Monitor | 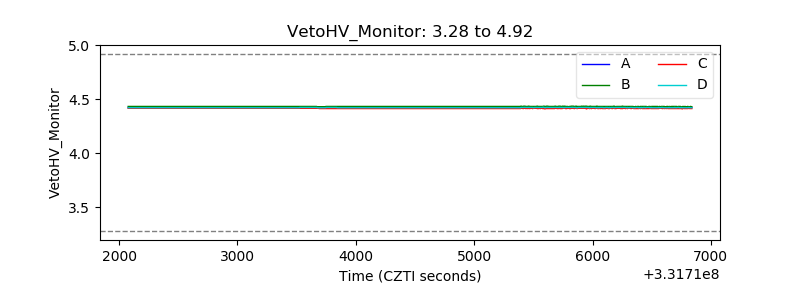 |
| Veto LLD | 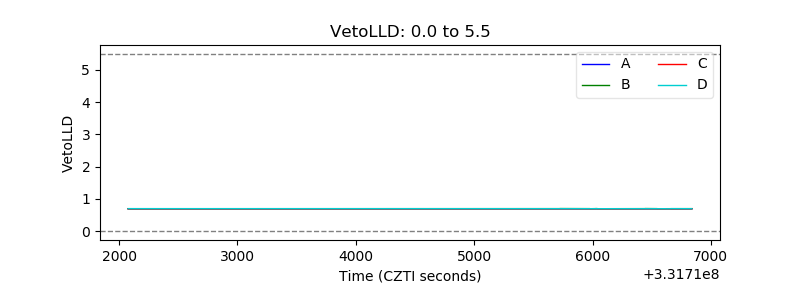 |
| Alpha Counter | 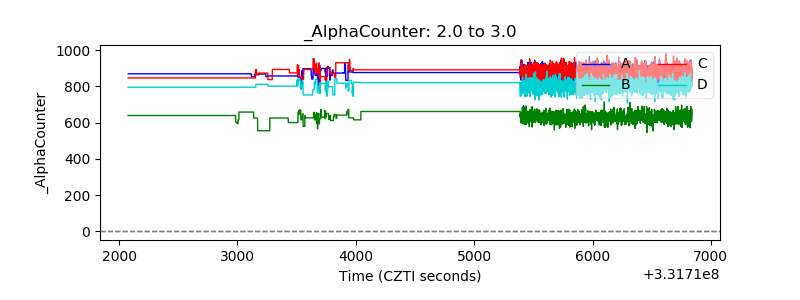 |
| _CPM_Rate | 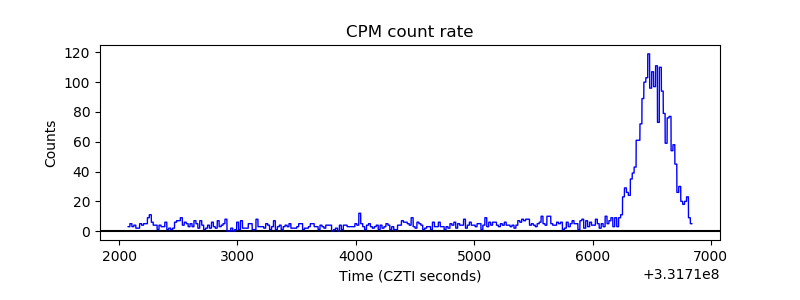 |
| CZT Counter | 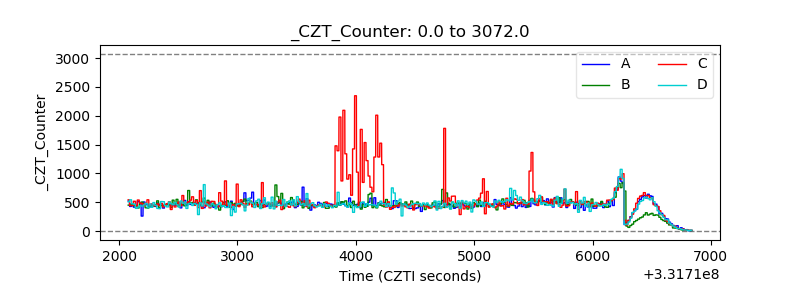 |
| +2.5 Volts monitor |  |
| +5 Volts monitor |  |
| _ROLL_ROT | 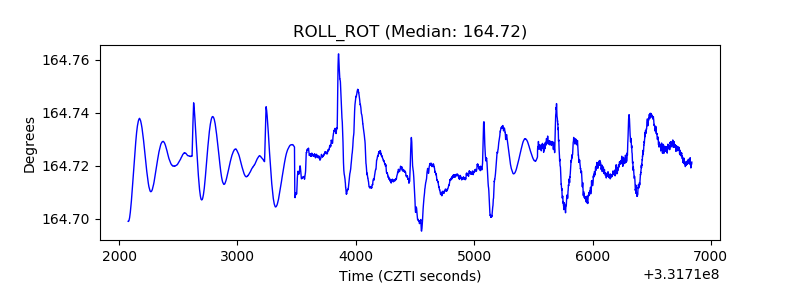 |
| _Roll_DEC | 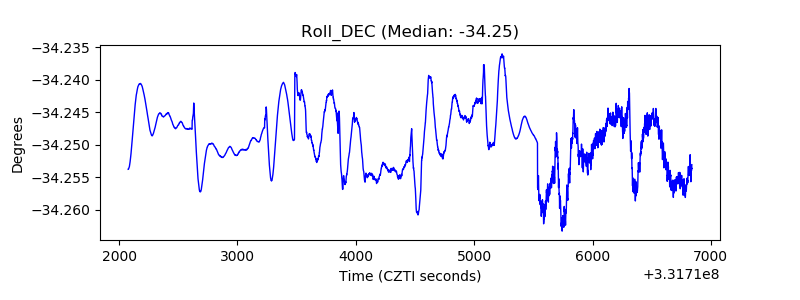 |
| _Roll_RA | 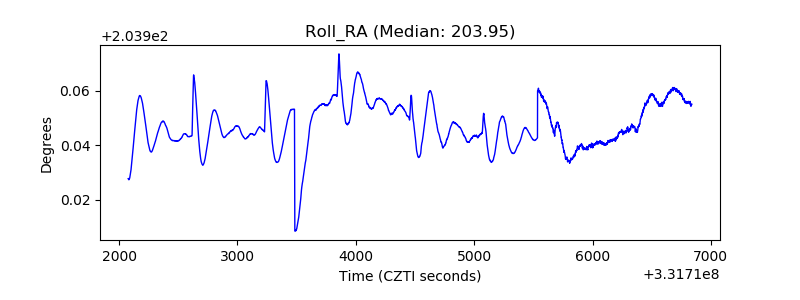 |
| Veto Counter | 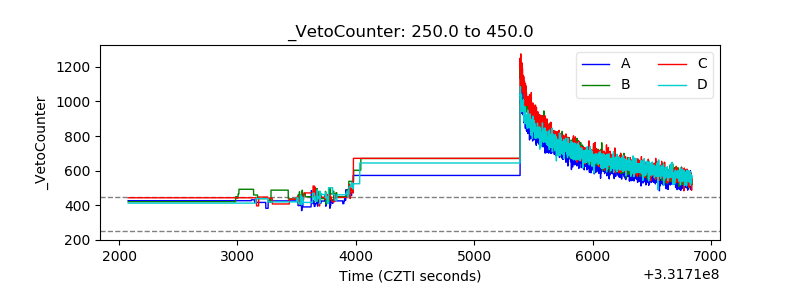 |