| Param | Original file | Final file |
|---|---|---|
| Filename | modeM0/AS1A07_068T01_9000003756_25985cztM0_level2.evt | modeM0/AS1A07_068T01_9000003756_25985cztM0_level2_quad_clean.evt |
| Size (bytes) | 120,830,400 | 10,379,520 |
| Size | 115.2 MB | 9.9 MB |
| Events in quadrant A | 994,514 | 50,197 |
| Events in quadrant B | 775,992 | 50,546 |
| Events in quadrant C | 769,637 | 47,840 |
| Events in quadrant D | 1,010,517 | 49,506 |
| Mode M0 | |||
|---|---|---|---|
| Quadrant | BADHDUFLAG | Total packets | Discarded packets |
| A | 0 | 3886 | 0 |
| B | 0 | 3217 | 0 |
| C | 0 | 3207 | 0 |
| D | 0 | 3985 | 0 |
| Mode M9 | |||
|---|---|---|---|
| Quadrant | BADHDUFLAG | Total packets | Discarded packets |
| A | 0 | 8 | 0 |
| B | 0 | 9 | 1 |
| C | 0 | 8 | 0 |
| D | 0 | 8 | 0 |
| Quadrant | Total seconds | Saturated seconds | Saturation percentage |
|---|---|---|---|
| A | 1465 | 38 | 2.593857% |
| B | 1472 | 45 | 3.057065% |
| C | 1463 | 42 | 2.870813% |
| D | 1466 | 44 | 3.001364% |
Noise dominated data is calculated using 1-second bins in cleaned event files. If a bin has >2000 counts, and if more than 50% of those come from <1% of pixels, then it is considered to be noise-dominated and hence unusable.
| Quadrant | # 1 sec bins | Bins with >0 counts | Bins with >2000 counts | High rate bins dominated by noise | Noise dominated (total time) | Noise dominated (detector-on time) | Marked lightcurve |
|---|---|---|---|---|---|---|---|
| A | 2795 | 1496 | 1 | 1 | 0.04% | 0.07% | 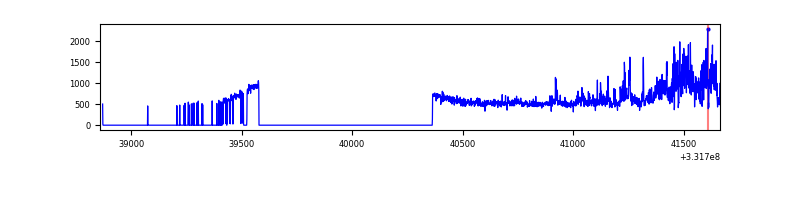 |
| B | 2807 | 1507 | 0 | 0 | 0.00% | 0.00% | 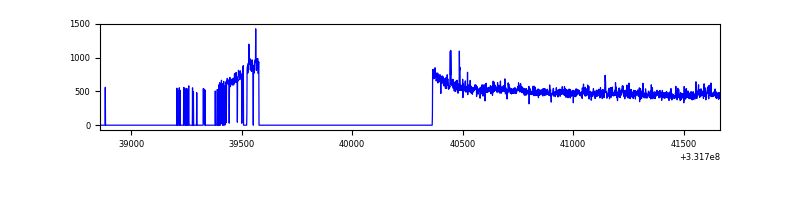 |
| C | 2783 | 1491 | 0 | 0 | 0.00% | 0.00% | 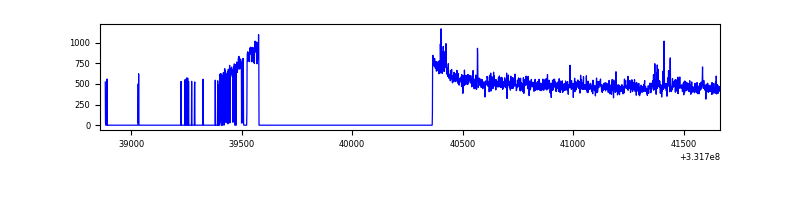 |
| D | 2787 | 1496 | 12 | 12 | 0.43% | 0.80% | 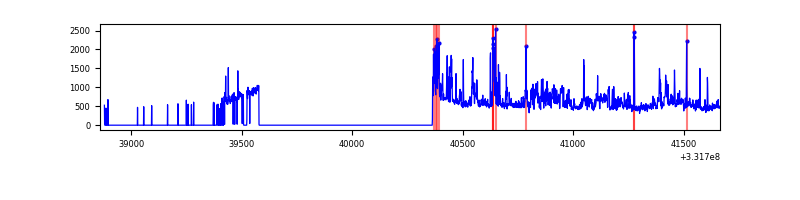 |
Top three noisy pixels from each quadrant. If the there are fewer than three noisy pixels in the level2.evt file, extra rows are filled as -1
| Pixel properties | Quadrant properties | ||||||
|---|---|---|---|---|---|---|---|
| Quadrant | DetID | PixID | Counts | Sigma | Mean | Median | Sigma |
| A | 0 | 13 | 229217 | 5332.01 | 198 | 193 | 43.0 |
| A | 13 | 254 | 2349 | 50.19 | 198 | 193 | 43.0 |
| A | 3 | 137 | 1872 | 39.09 | 198 | 193 | 43.0 |
| B | 0 | 229 | 6507 | 156.74 | 194 | 189 | 40.3 |
| B | 0 | 190 | 5610 | 134.49 | 194 | 189 | 40.3 |
| B | 12 | 111 | 4709 | 112.14 | 194 | 189 | 40.3 |
| C | 14 | 238 | 28882 | 633.57 | 184 | 184 | 45.3 |
| C | 0 | 207 | 13762 | 299.76 | 184 | 184 | 45.3 |
| C | 3 | 233 | 8396 | 181.3 | 184 | 184 | 45.3 |
| D | 10 | 230 | 104479 | 2200.89 | 189 | 185 | 47.4 |
| D | 12 | 233 | 92468 | 1947.43 | 189 | 185 | 47.4 |
| D | 1 | 52 | 78575 | 1654.25 | 189 | 185 | 47.4 |
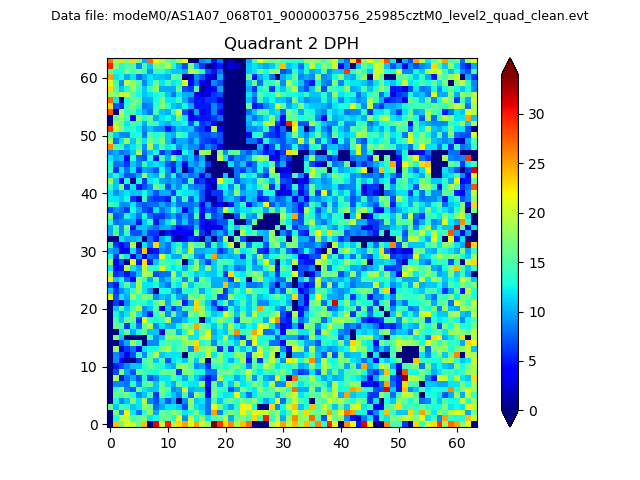
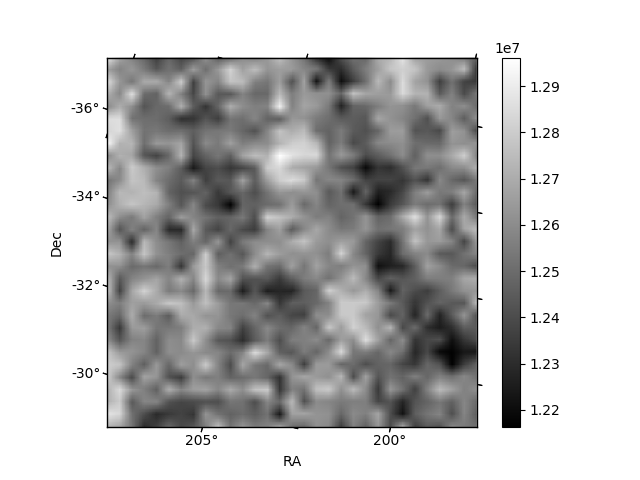
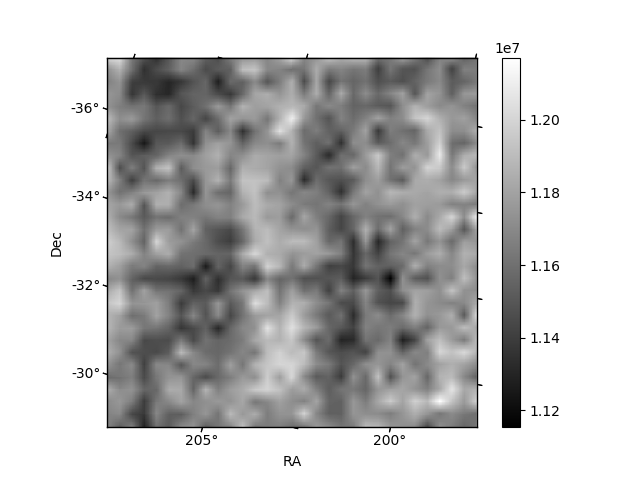
Histogram calculated using DETX and DETY for each event in the final _common_clean file
| Quadrant A |  |
 |
Quadrant B |
|---|---|---|---|
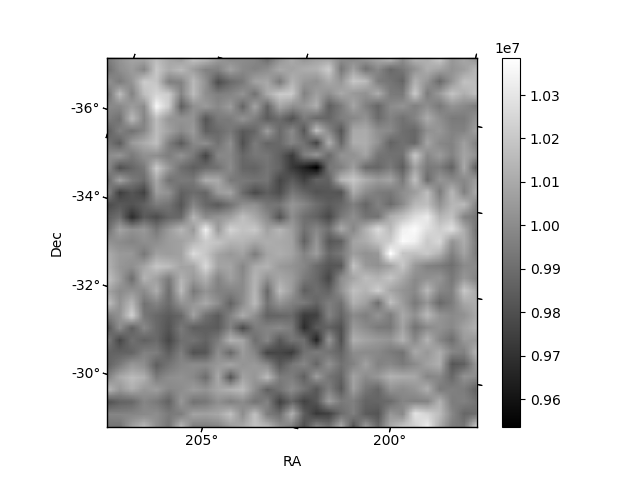
| Quadrant D | 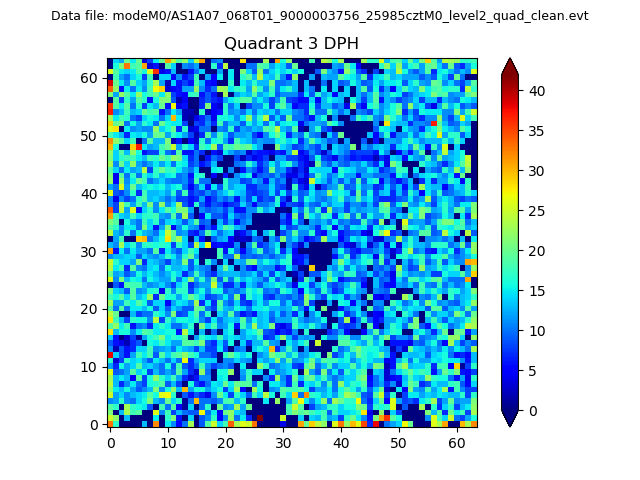 |
 |
Quadrant C |
| Plot type | Count rate plots | Images |
|---|---|---|
| Comparison with Poisson distribution Blue bars denote a histogram of data divided into 1 sec bins. Red curve is a Poisson curve with rate = median count rate of data. |
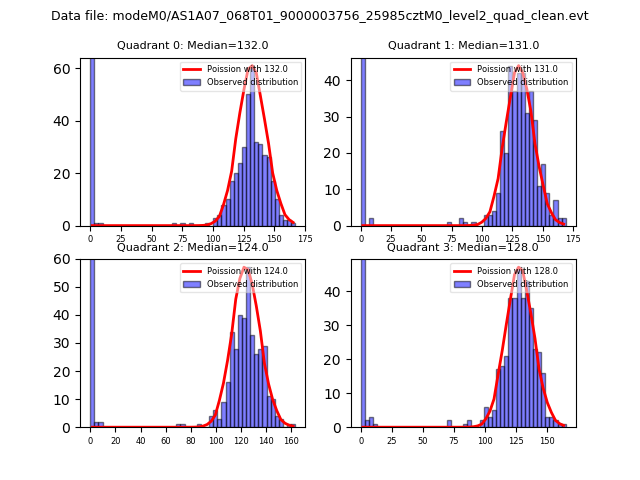 |
 |
| Quadrant-wise count rates Data is divided into 100 sec bins |
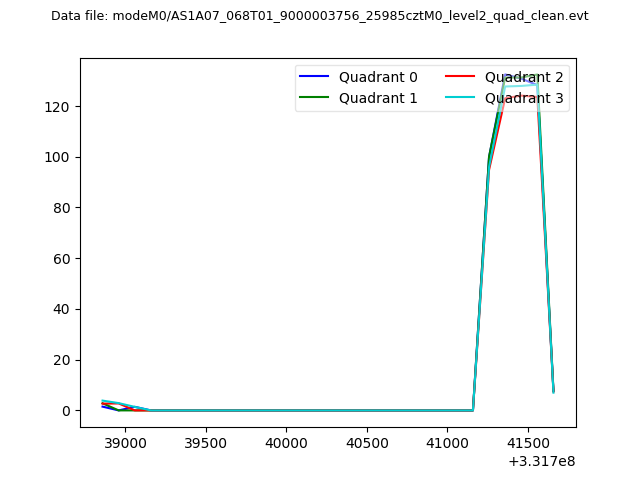 |
|
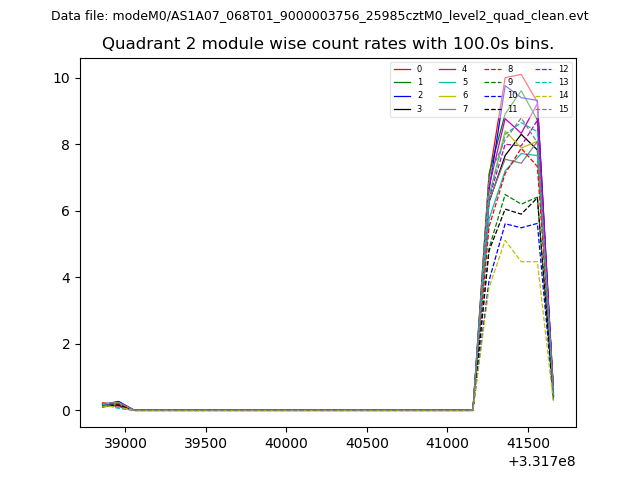
| Module-wise count rates for Quadrant A Data is divided into 100 sec bins |
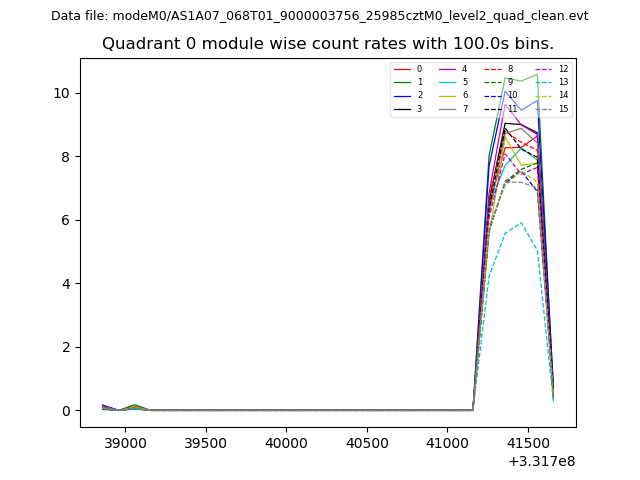 |
 |
| Module-wise count rates for Quadrant B Data is divided into 100 sec bins |
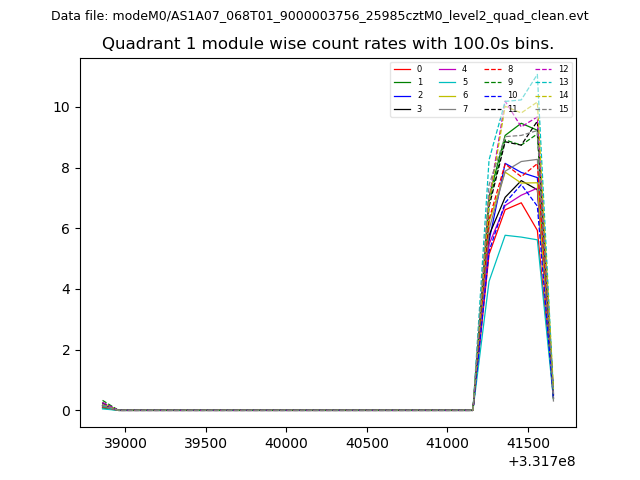 |
 |
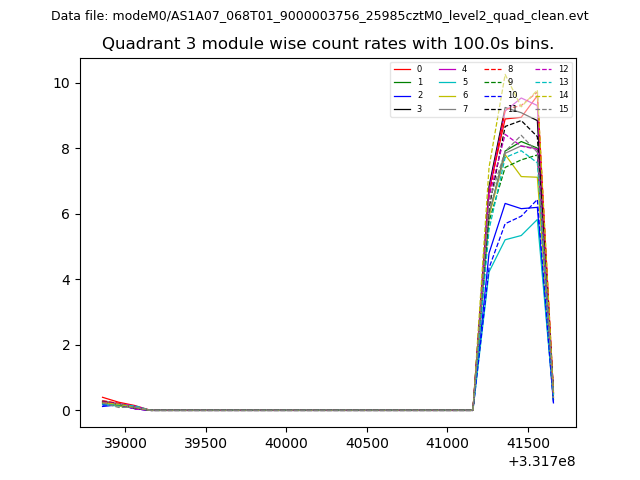
| Module-wise count rates for Quadrant C Data is divided into 100 sec bins |
 |
 |
| Module-wise count rates for Quadrant D Data is divided into 100 sec bins |
 |
 |
| Parameter | Plot |
|---|---|
| CZT HV Monitor | 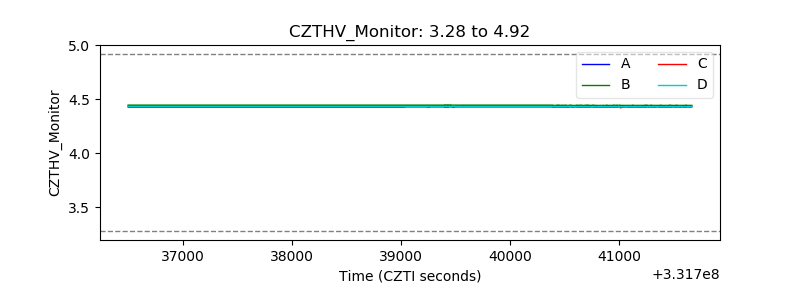 |
| D_VDD | 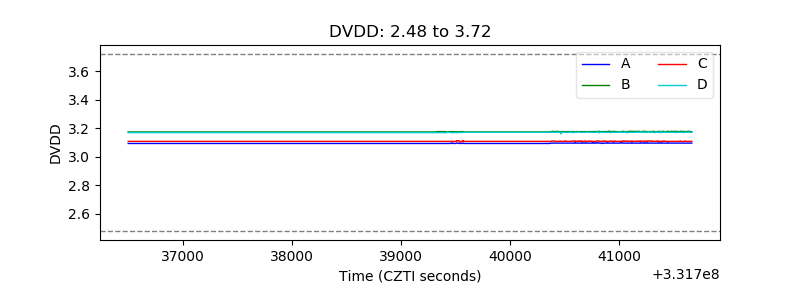 |
| Temperature 1 | 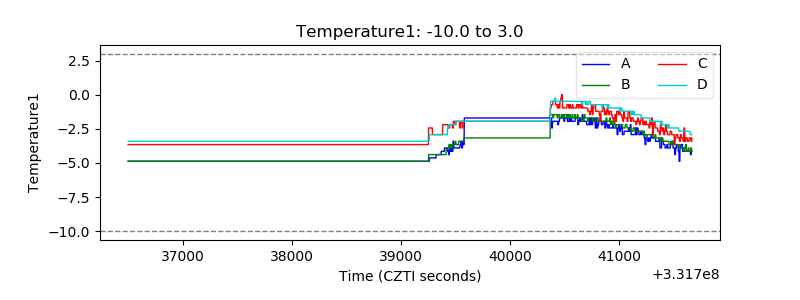 |
| Veto HV Monitor | 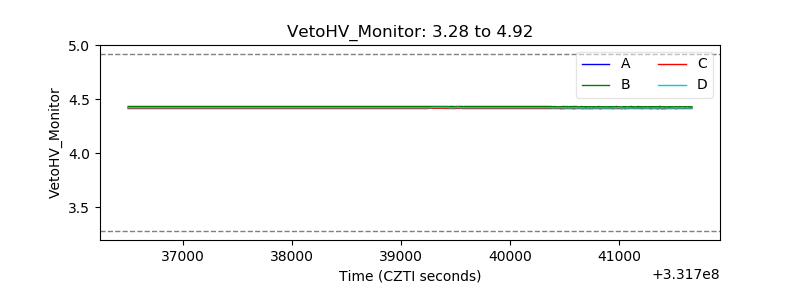 |
| Veto LLD | 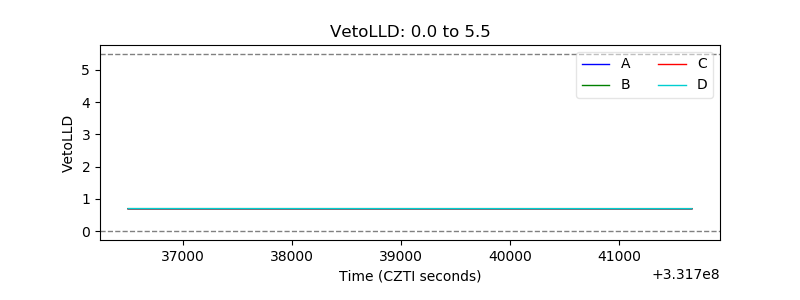 |
| Alpha Counter | 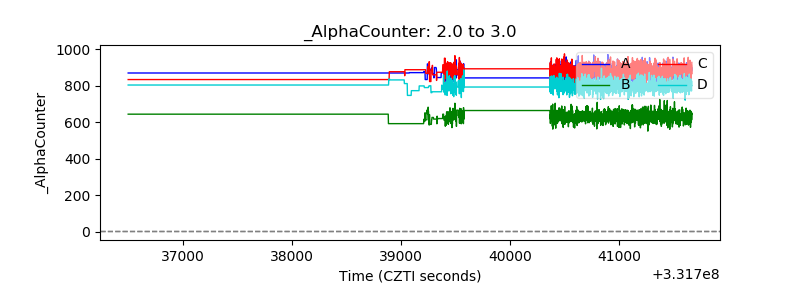 |
| _CPM_Rate | 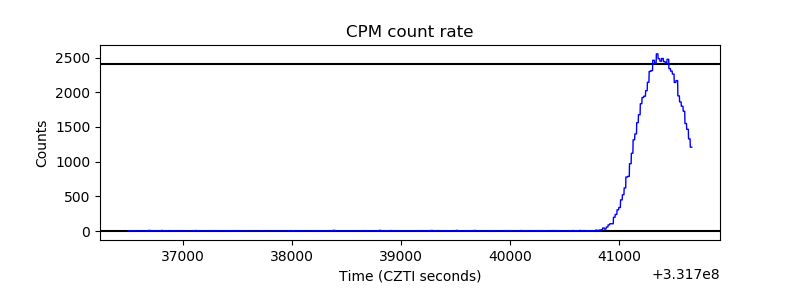 |
| CZT Counter | 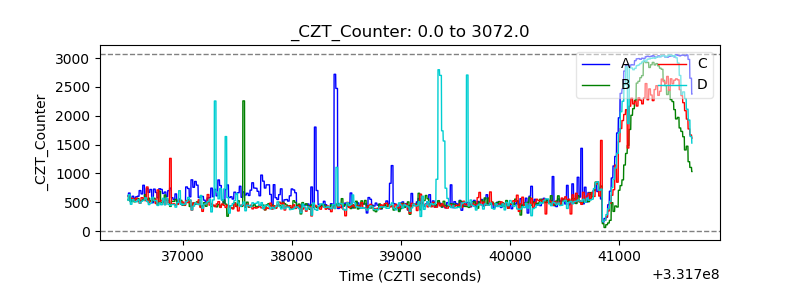 |
| +2.5 Volts monitor | 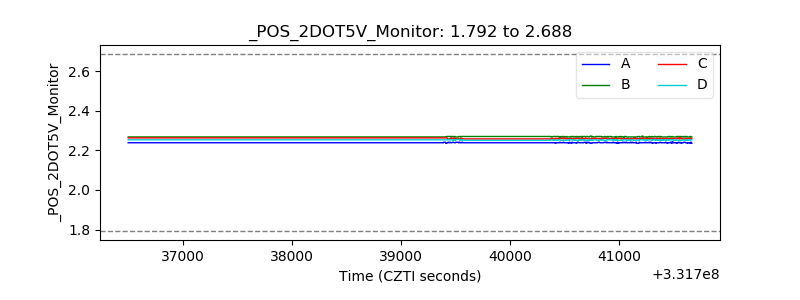 |
| +5 Volts monitor | 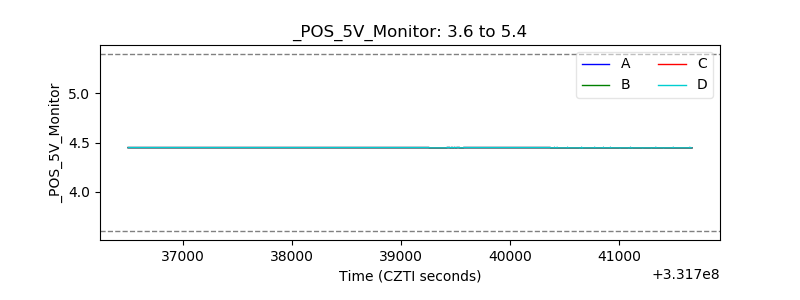 |
| _ROLL_ROT | 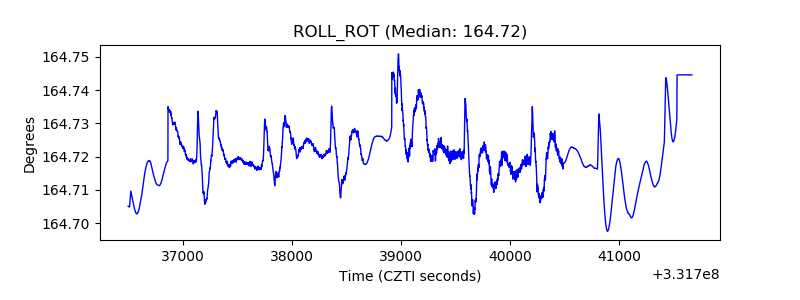 |
| _Roll_DEC | 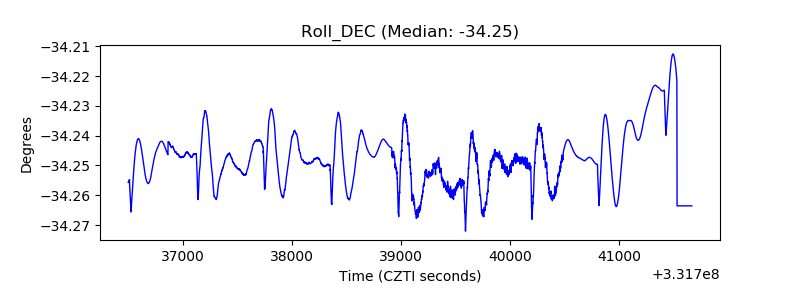 |
| _Roll_RA | 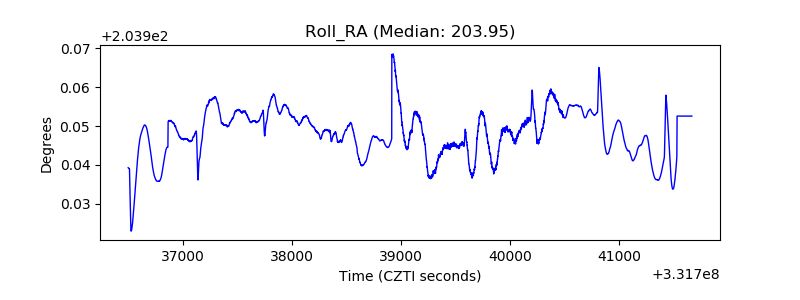 |
| Veto Counter | 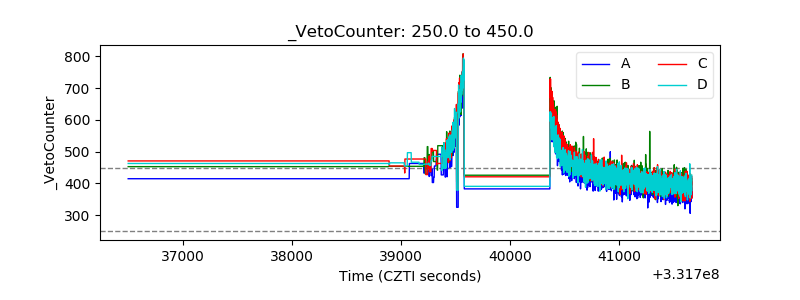 |