| Param | Original file | Final file |
|---|---|---|
| Filename | modeM0/AS1T03_214T01_9000003758_25918cztM0_level2.evt | modeM0/AS1T03_214T01_9000003758_25918cztM0_level2_quad_clean.evt |
| Size (bytes) | 1,779,327,360 | 152,985,600 |
| Size | 1.7 GB | 145.9 MB |
| Events in quadrant A | 32,456,618 | 375,431 |
| Events in quadrant B | 6,418,833 | 1,145,522 |
| Events in quadrant C | 6,474,184 | 1,100,250 |
| Events in quadrant D | 7,637,044 | 1,084,961 |
| Mode M0 | |||
|---|---|---|---|
| Quadrant | BADHDUFLAG | Total packets | Discarded packets |
| A | 0 | 105580 | 0 |
| B | 0 | 27571 | 0 |
| C | 0 | 27726 | 0 |
| D | 0 | 31797 | 0 |
| Mode M9 | |||
|---|---|---|---|
| Quadrant | BADHDUFLAG | Total packets | Discarded packets |
| A | 0 | 20 | 0 |
| B | 0 | 20 | 0 |
| C | 0 | 20 | 0 |
| D | 0 | 20 | 0 |
| Quadrant | Total seconds | Saturated seconds | Saturation percentage |
|---|---|---|---|
| A | 13363 | 12305 | 92.082616% |
| B | 13363 | 135 | 1.010252% |
| C | 13363 | 188 | 1.406870% |
| D | 13363 | 261 | 1.953154% |
Noise dominated data is calculated using 1-second bins in cleaned event files. If a bin has >2000 counts, and if more than 50% of those come from <1% of pixels, then it is considered to be noise-dominated and hence unusable.
| Quadrant | # 1 sec bins | Bins with >0 counts | Bins with >2000 counts | High rate bins dominated by noise | Noise dominated (total time) | Noise dominated (detector-on time) | Marked lightcurve |
|---|---|---|---|---|---|---|---|
| A | 15268 | 13363 | 10815 | 10815 | 70.83% | 80.93% | 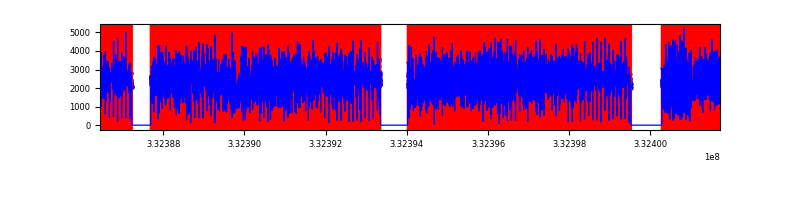 |
| B | 15268 | 13366 | 3 | 3 | 0.02% | 0.02% | 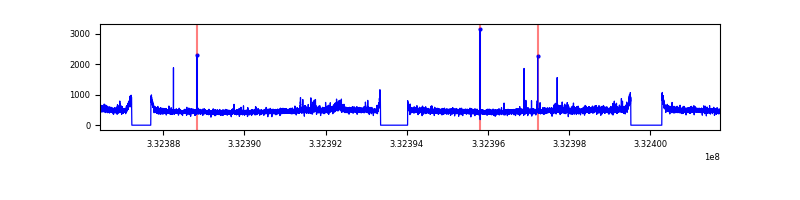 |
| C | 15268 | 13366 | 0 | 0 | 0.00% | 0.00% | 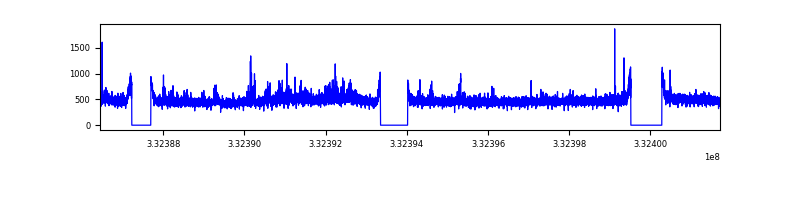 |
| D | 15268 | 13366 | 146 | 146 | 0.96% | 1.09% | 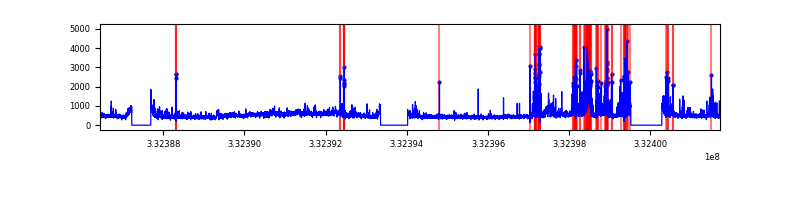 |
Top three noisy pixels from each quadrant. If the there are fewer than three noisy pixels in the level2.evt file, extra rows are filled as -1
| Pixel properties | Quadrant properties | ||||||
|---|---|---|---|---|---|---|---|
| Quadrant | DetID | PixID | Counts | Sigma | Mean | Median | Sigma |
| A | 0 | 13 | 29624006 | 203201.67 | 733 | 718 | 145.8 |
| A | 13 | 254 | 9351 | 59.22 | 733 | 718 | 145.8 |
| A | 3 | 137 | 6679 | 40.89 | 733 | 718 | 145.8 |
| B | 0 | 219 | 88519 | 288.43 | 1594 | 1549 | 301.5 |
| B | 0 | 190 | 45572 | 146.0 | 1594 | 1549 | 301.5 |
| B | 12 | 111 | 37849 | 120.39 | 1594 | 1549 | 301.5 |
| C | 14 | 238 | 245876 | 684.26 | 1531 | 1540 | 357.1 |
| C | 3 | 233 | 239344 | 665.97 | 1531 | 1540 | 357.1 |
| C | 2 | 16 | 29319 | 77.8 | 1531 | 1540 | 357.1 |
| D | 7 | 80 | 914669 | 2496.24 | 1540 | 1500 | 365.8 |
| D | 1 | 52 | 814301 | 2221.87 | 1540 | 1500 | 365.8 |
| D | 2 | 234 | 56373 | 150.0 | 1540 | 1500 | 365.8 |
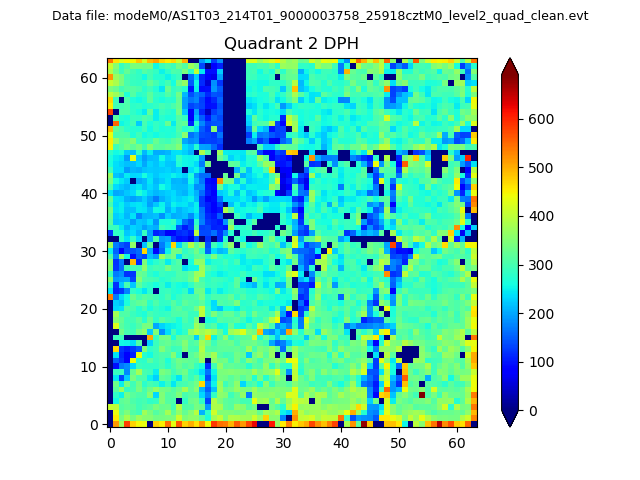
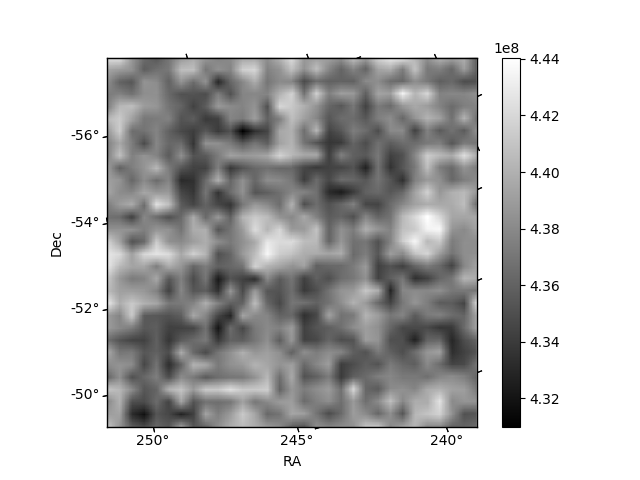
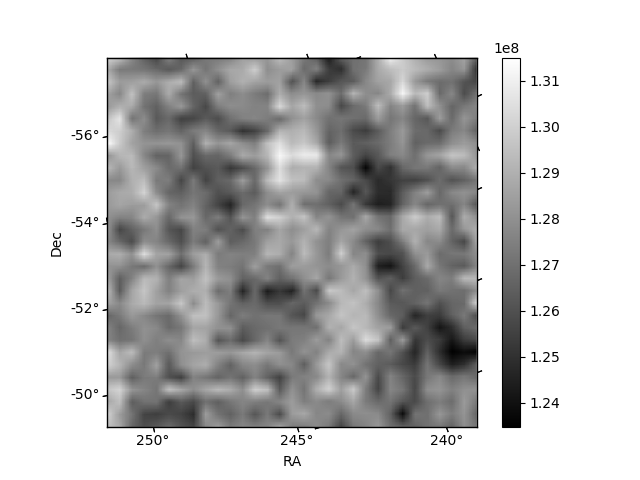
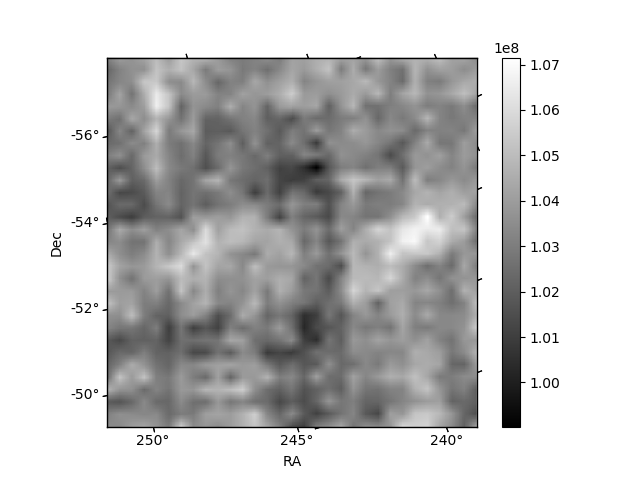
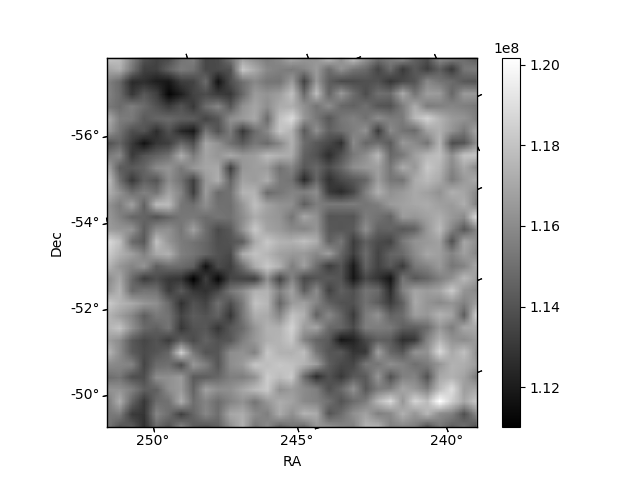
Histogram calculated using DETX and DETY for each event in the final _common_clean file
| Quadrant A | 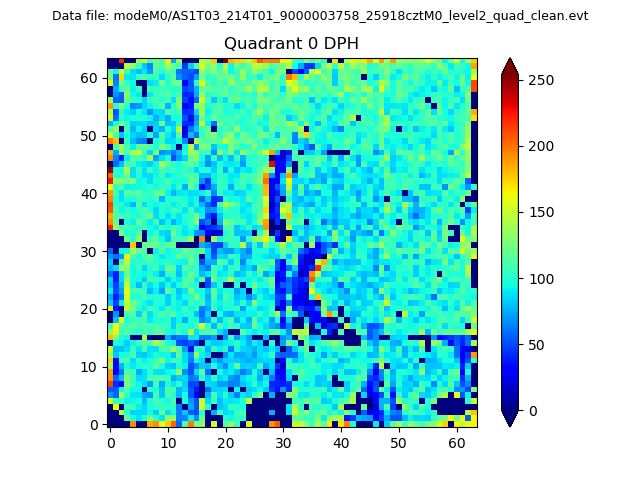 |
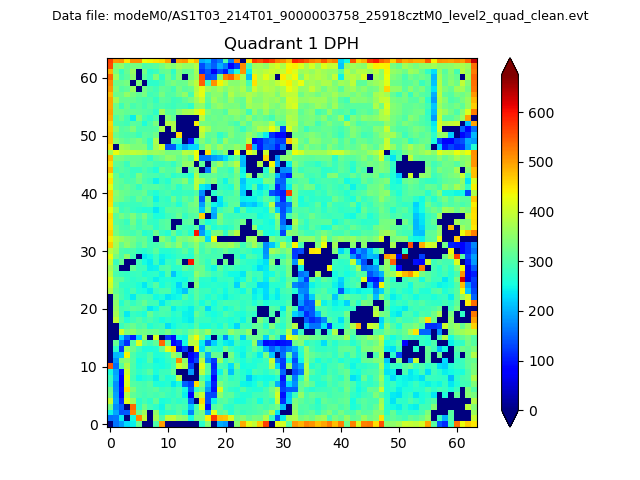 |
Quadrant B |
|---|---|---|---|
| Quadrant D | 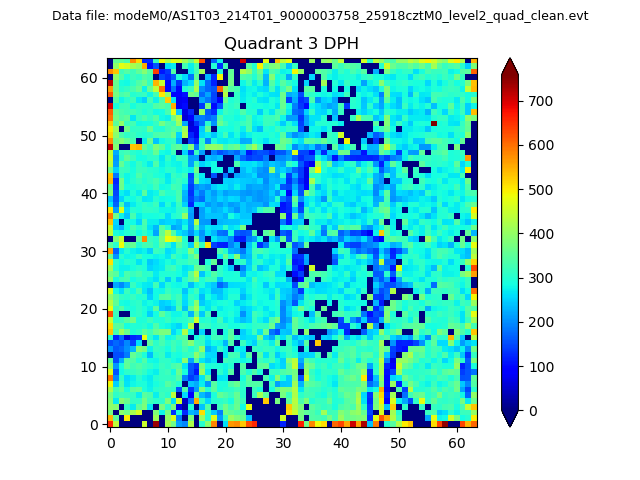 |
 |
Quadrant C |
| Plot type | Count rate plots | Images |
|---|---|---|
| Comparison with Poisson distribution Blue bars denote a histogram of data divided into 1 sec bins. Red curve is a Poisson curve with rate = median count rate of data. |
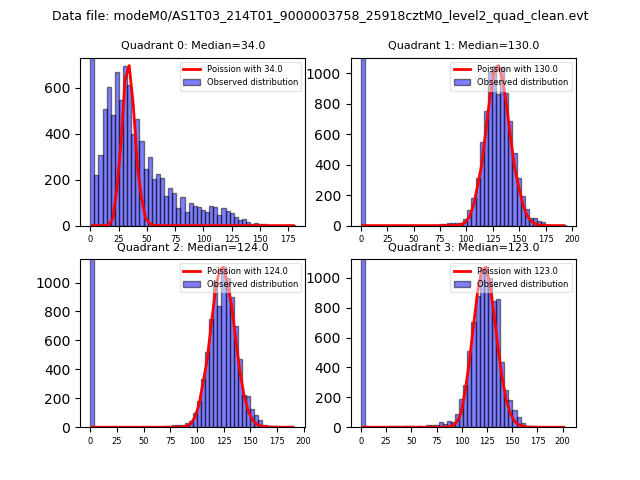 |
 |
| Quadrant-wise count rates Data is divided into 100 sec bins |
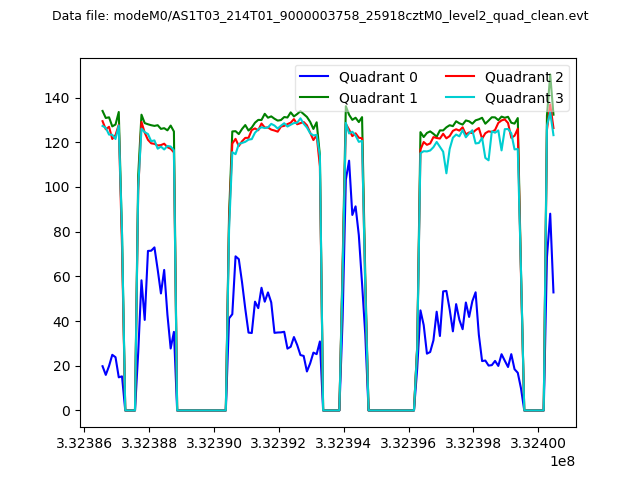 |
|
| Module-wise count rates for Quadrant A Data is divided into 100 sec bins |
 |
 |
| Module-wise count rates for Quadrant B Data is divided into 100 sec bins |
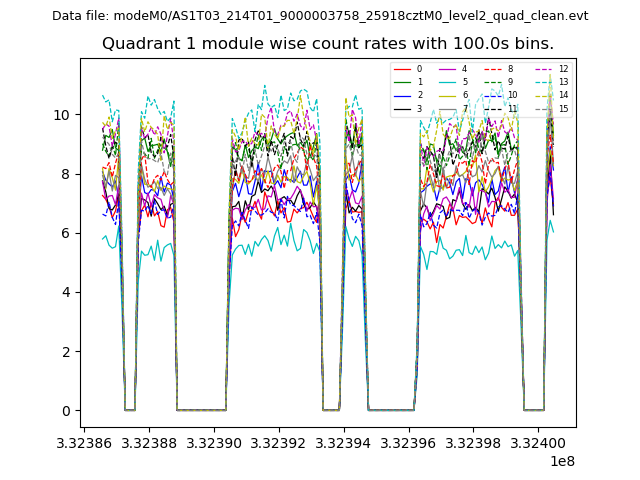 |
 |
| Module-wise count rates for Quadrant C Data is divided into 100 sec bins |
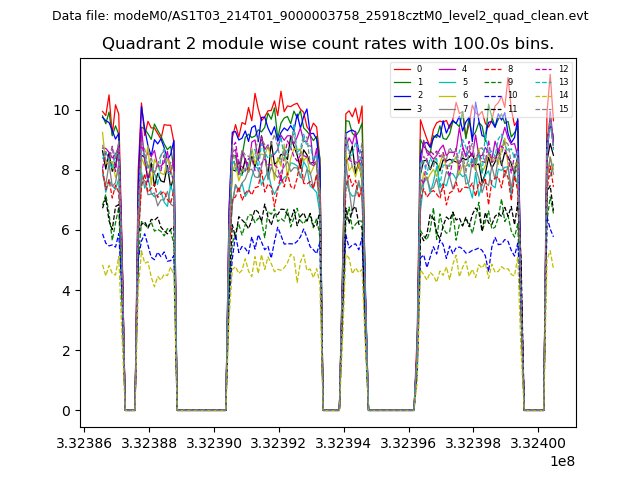 |
 |
| Module-wise count rates for Quadrant D Data is divided into 100 sec bins |
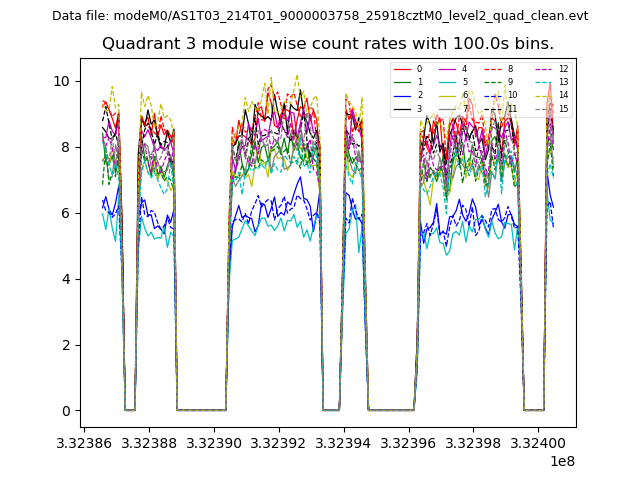 |
 |
| Parameter | Plot |
|---|---|
| CZT HV Monitor |  |
| D_VDD | 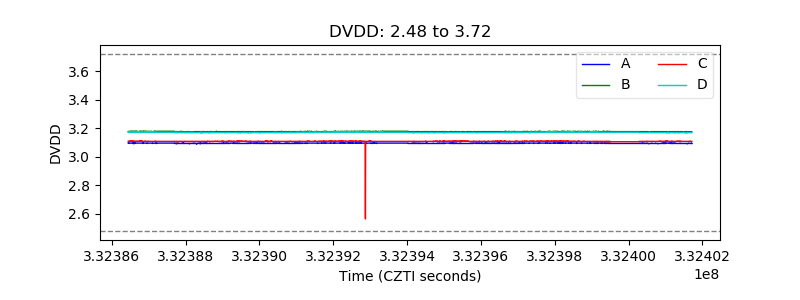 |
| Temperature 1 | 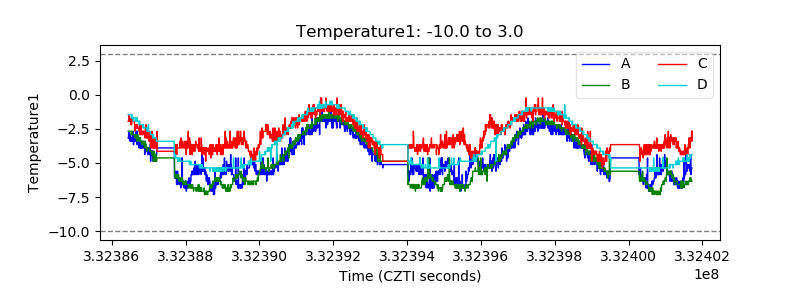 |
| Veto HV Monitor | 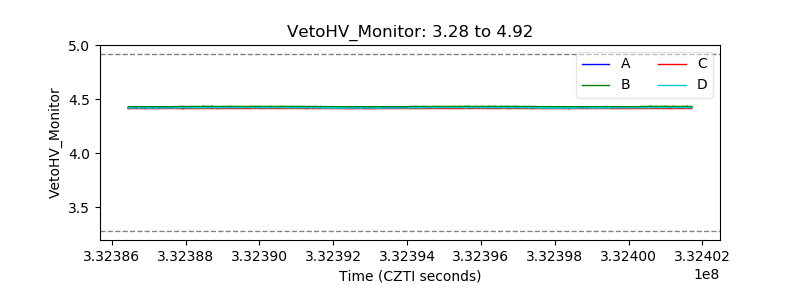 |
| Veto LLD | 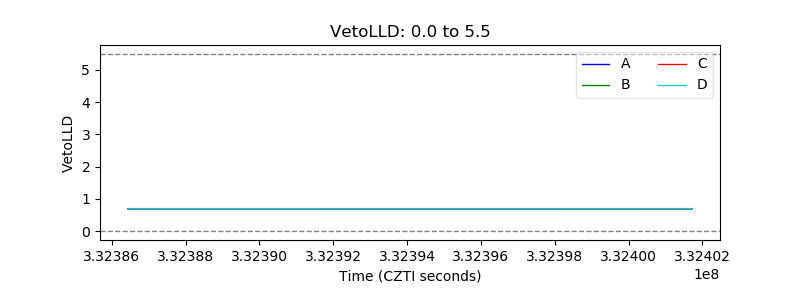 |
| Alpha Counter | 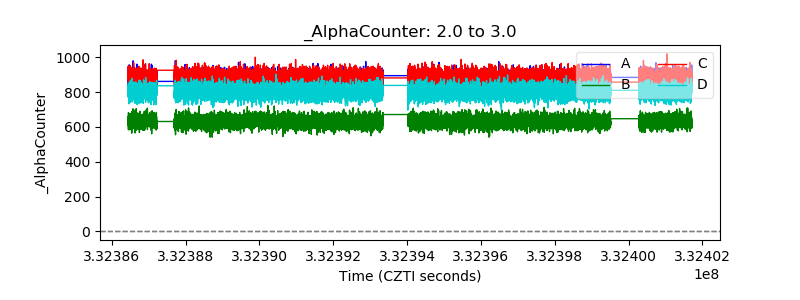 |
| _CPM_Rate | 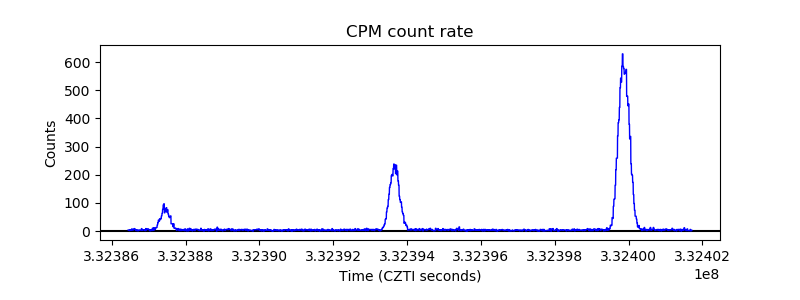 |
| CZT Counter | 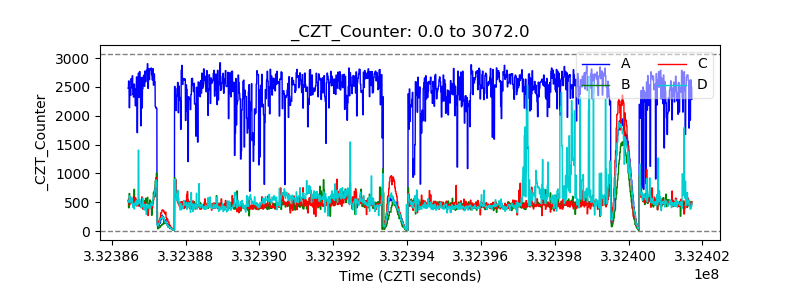 |
| +2.5 Volts monitor |  |
| +5 Volts monitor |  |
| _ROLL_ROT | 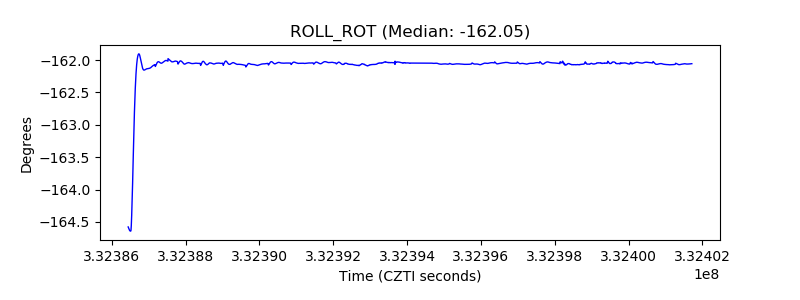 |
| _Roll_DEC | 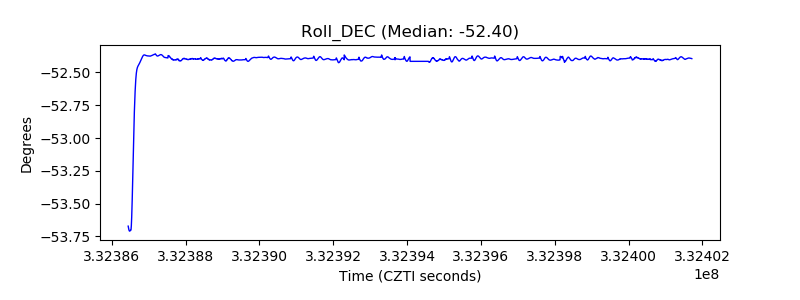 |
| _Roll_RA | 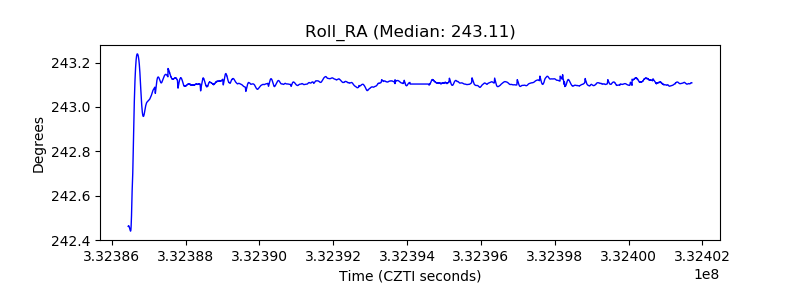 |
| Veto Counter |  |