| Param | Original file | Final file |
|---|---|---|
| Filename | modeM0/AS1T03_214T01_9000003758_25919cztM0_level2.evt | modeM0/AS1T03_214T01_9000003758_25919cztM0_level2_quad_clean.evt |
| Size (bytes) | 857,537,280 | 64,840,320 |
| Size | 817.8 MB | 61.8 MB |
| Events in quadrant A | 15,474,355 | 186,980 |
| Events in quadrant B | 3,161,822 | 448,680 |
| Events in quadrant C | 3,195,897 | 436,401 |
| Events in quadrant D | 3,696,194 | 433,715 |
| Mode M0 | |||
|---|---|---|---|
| Quadrant | BADHDUFLAG | Total packets | Discarded packets |
| A | 0 | 50433 | 0 |
| B | 0 | 13399 | 0 |
| C | 0 | 13533 | 0 |
| D | 0 | 15291 | 0 |
| Mode M9 | |||
|---|---|---|---|
| Quadrant | BADHDUFLAG | Total packets | Discarded packets |
| A | 0 | 10 | 0 |
| B | 0 | 10 | 0 |
| C | 0 | 10 | 0 |
| D | 0 | 10 | 0 |
| Quadrant | Total seconds | Saturated seconds | Saturation percentage |
|---|---|---|---|
| A | 6536 | 5862 | 89.687882% |
| B | 6537 | 30 | 0.458926% |
| C | 6537 | 69 | 1.055530% |
| D | 6537 | 66 | 1.009637% |
Noise dominated data is calculated using 1-second bins in cleaned event files. If a bin has >2000 counts, and if more than 50% of those come from <1% of pixels, then it is considered to be noise-dominated and hence unusable.
| Quadrant | # 1 sec bins | Bins with >0 counts | Bins with >2000 counts | High rate bins dominated by noise | Noise dominated (total time) | Noise dominated (detector-on time) | Marked lightcurve |
|---|---|---|---|---|---|---|---|
| A | 7491 | 6537 | 4936 | 4936 | 65.89% | 75.51% | 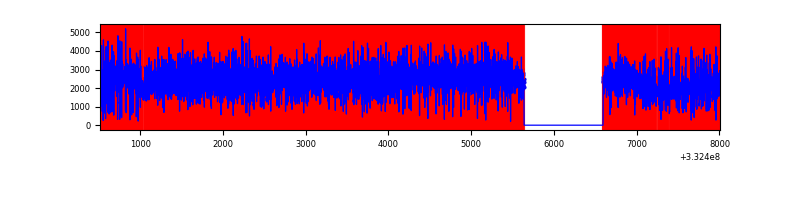 |
| B | 7492 | 6538 | 0 | 0 | 0.00% | 0.00% | 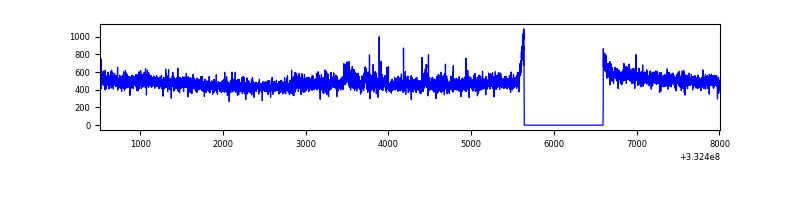 |
| C | 7492 | 6538 | 0 | 0 | 0.00% | 0.00% | 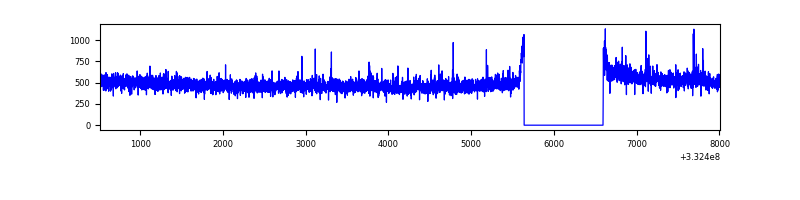 |
| D | 7492 | 6538 | 39 | 39 | 0.52% | 0.60% | 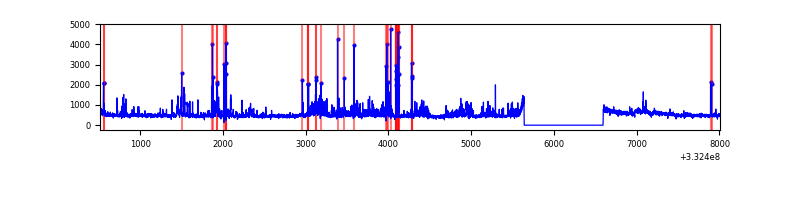 |
Top three noisy pixels from each quadrant. If the there are fewer than three noisy pixels in the level2.evt file, extra rows are filled as -1
| Pixel properties | Quadrant properties | ||||||
|---|---|---|---|---|---|---|---|
| Quadrant | DetID | PixID | Counts | Sigma | Mean | Median | Sigma |
| A | 0 | 13 | 13765385 | 157589.32 | 437 | 428 | 87.3 |
| A | 12 | 16 | 15097 | 167.94 | 437 | 428 | 87.3 |
| A | 6 | 16 | 5691 | 60.25 | 437 | 428 | 87.3 |
| B | 0 | 219 | 54383 | 357.18 | 790 | 772 | 150.1 |
| B | 12 | 111 | 18647 | 119.09 | 790 | 772 | 150.1 |
| B | 11 | 111 | 16720 | 106.25 | 790 | 772 | 150.1 |
| C | 14 | 238 | 123041 | 685.79 | 767 | 771 | 178.3 |
| C | 3 | 233 | 72520 | 402.43 | 767 | 771 | 178.3 |
| C | 2 | 16 | 11064 | 57.73 | 767 | 771 | 178.3 |
| D | 1 | 52 | 493874 | 2679.84 | 771 | 751 | 184.0 |
| D | 13 | 168 | 196135 | 1061.8 | 771 | 751 | 184.0 |
| D | 7 | 80 | 44352 | 236.95 | 771 | 751 | 184.0 |
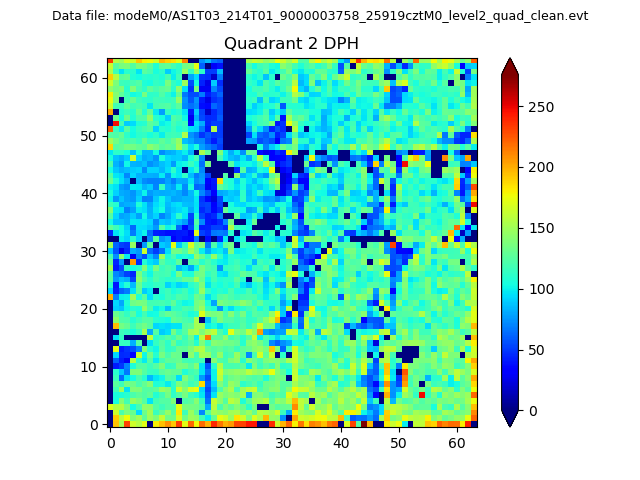
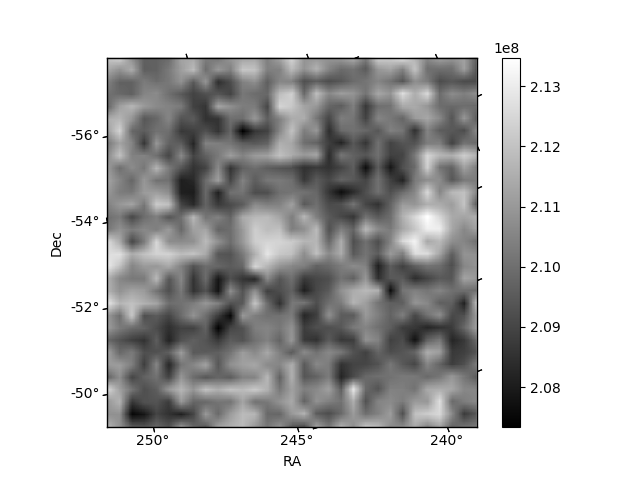
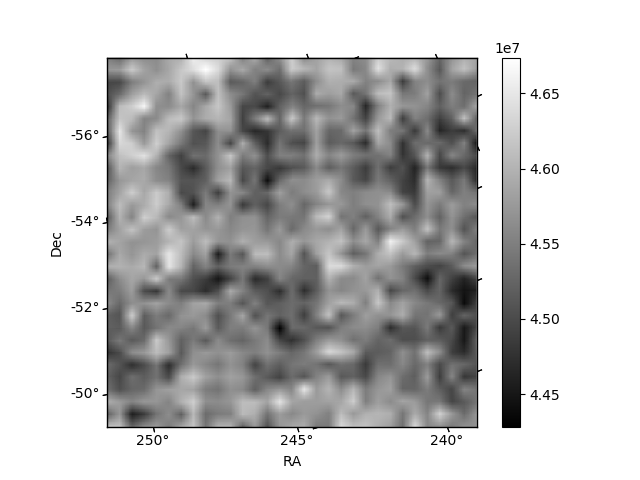
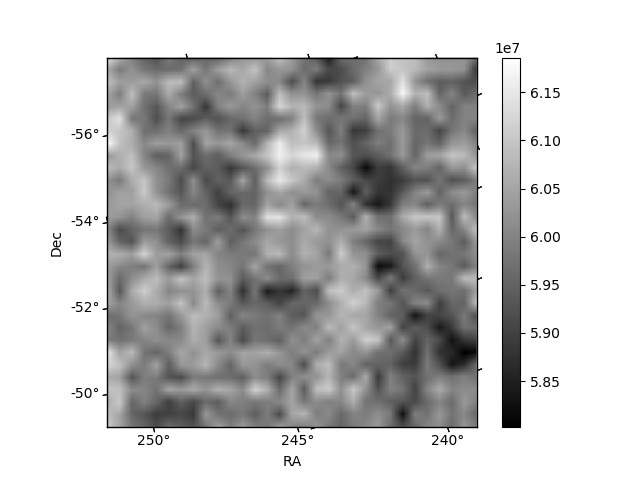
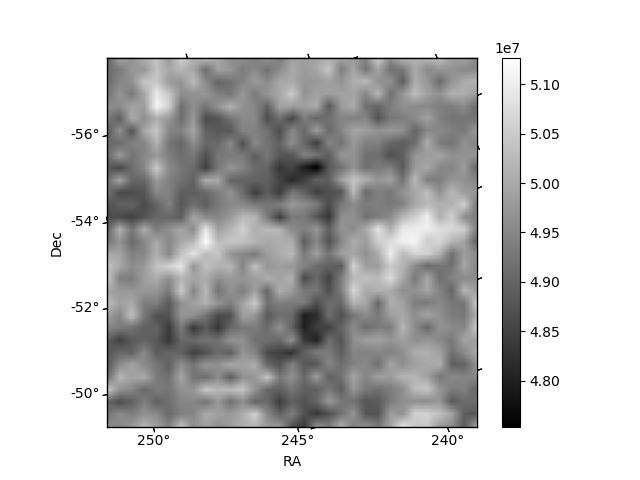
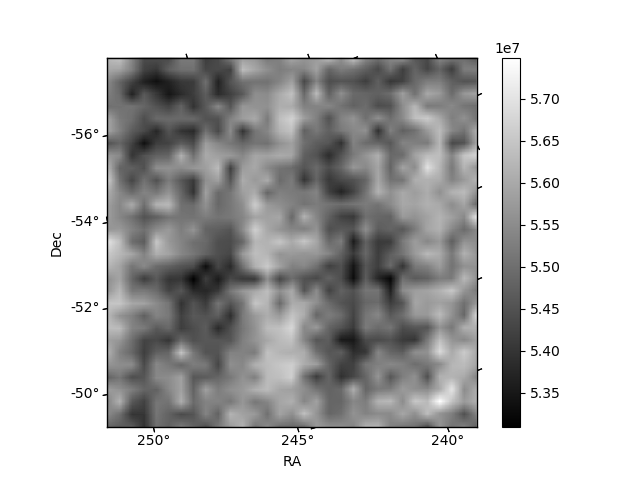
Histogram calculated using DETX and DETY for each event in the final _common_clean file
| Quadrant A | 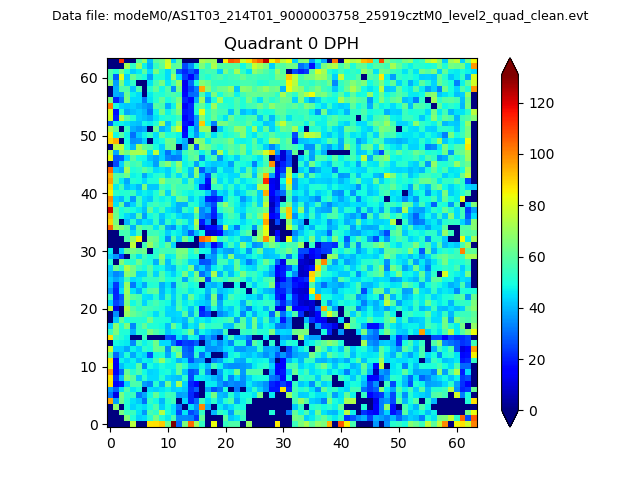 |
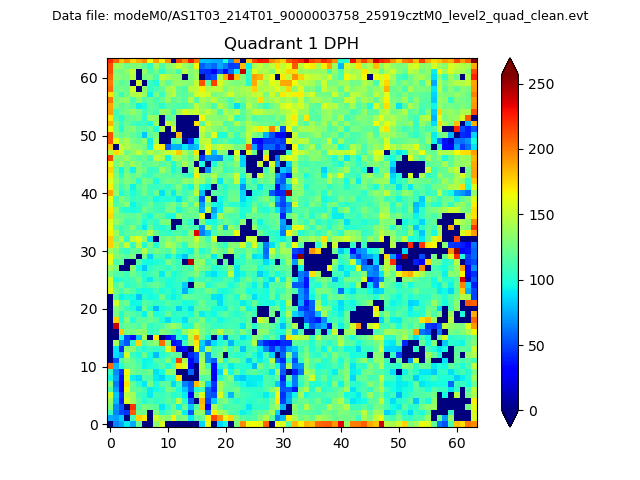 |
Quadrant B |
|---|---|---|---|
| Quadrant D | 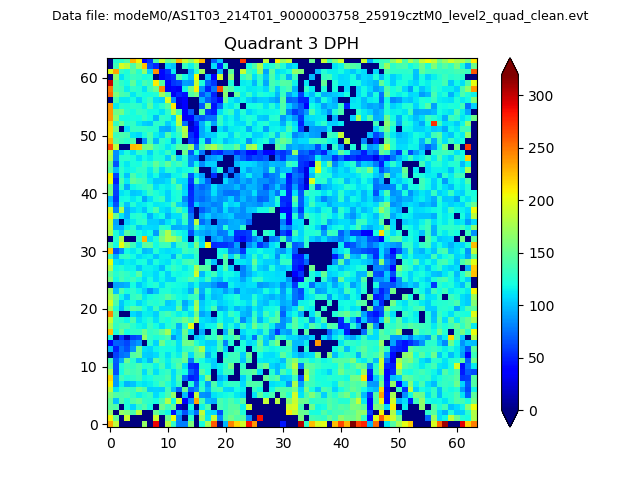 |
 |
Quadrant C |
| Plot type | Count rate plots | Images |
|---|---|---|
| Comparison with Poisson distribution Blue bars denote a histogram of data divided into 1 sec bins. Red curve is a Poisson curve with rate = median count rate of data. |
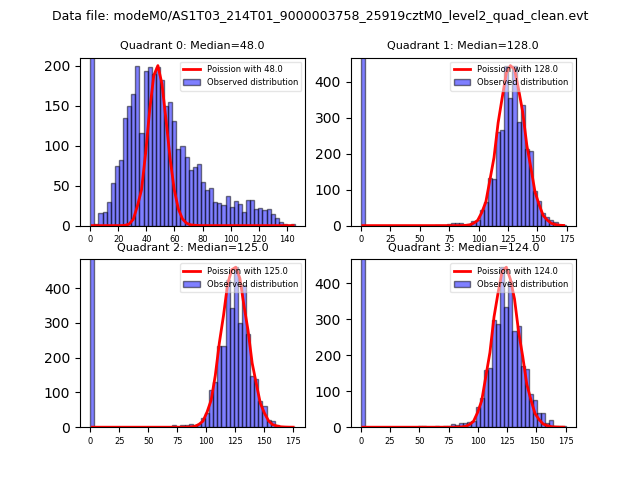 |
 |
| Quadrant-wise count rates Data is divided into 100 sec bins |
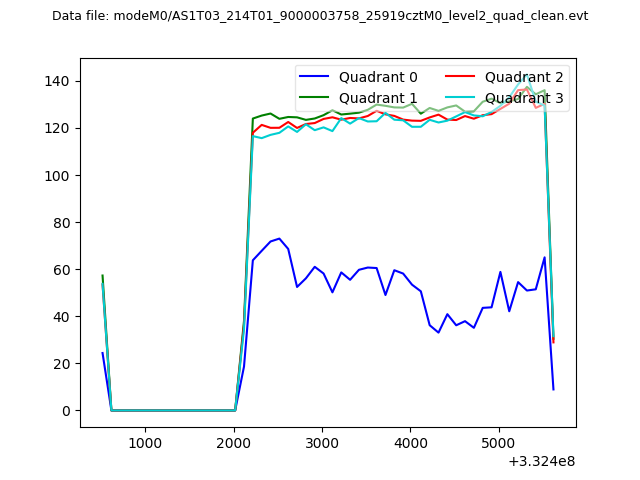 |
|
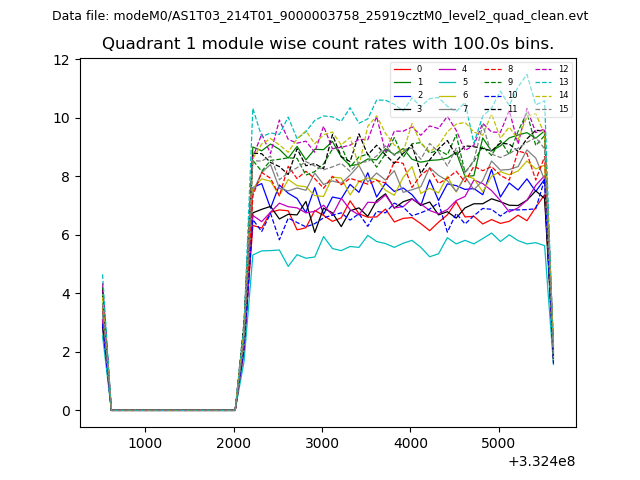
| Module-wise count rates for Quadrant A Data is divided into 100 sec bins |
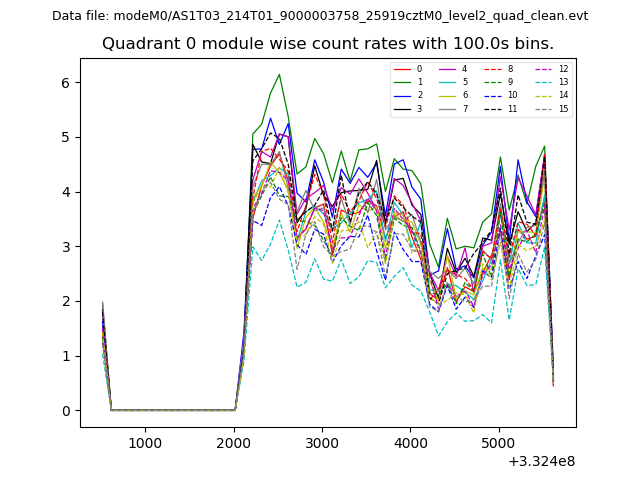 |
 |
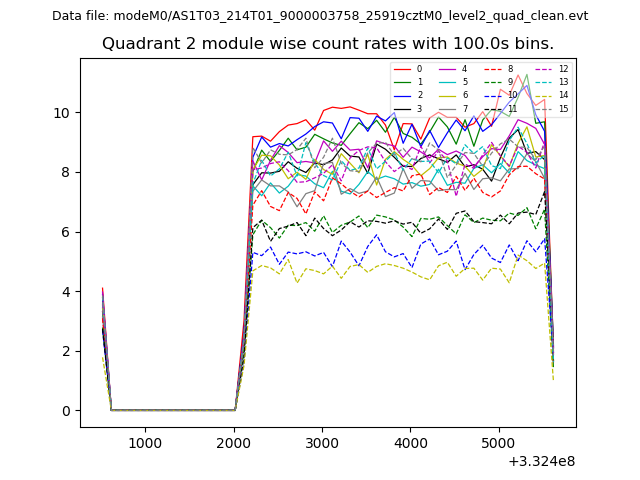
| Module-wise count rates for Quadrant B Data is divided into 100 sec bins |
 |
 |
| Module-wise count rates for Quadrant C Data is divided into 100 sec bins |
 |
 |
| Module-wise count rates for Quadrant D Data is divided into 100 sec bins |
 |
 |
| Parameter | Plot |
|---|---|
| CZT HV Monitor | 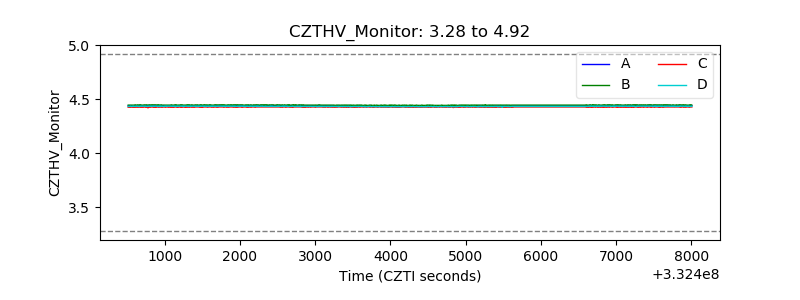 |
| D_VDD |  |
| Temperature 1 | 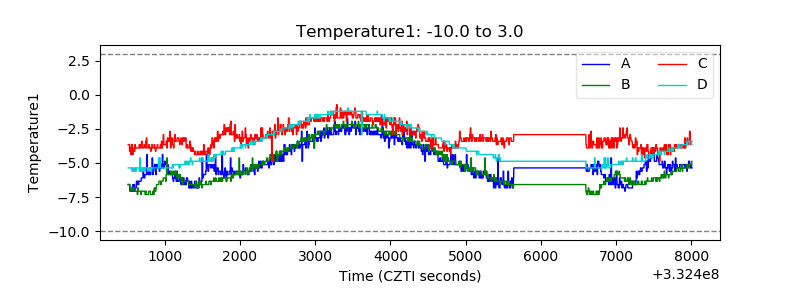 |
| Veto HV Monitor | 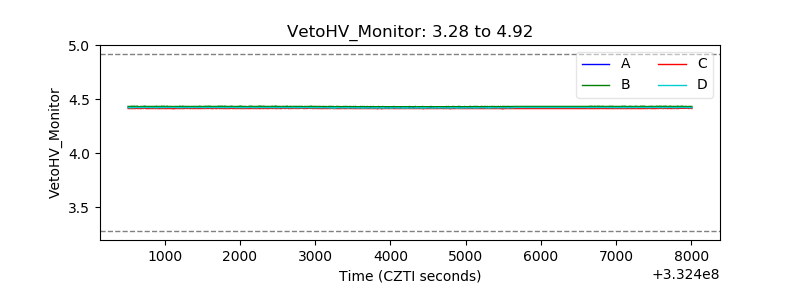 |
| Veto LLD |  |
| Alpha Counter | 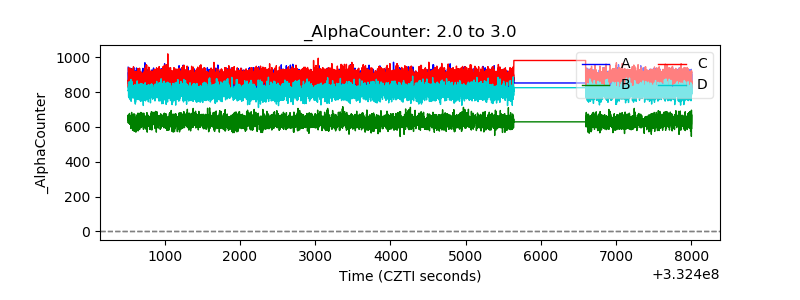 |
| _CPM_Rate | 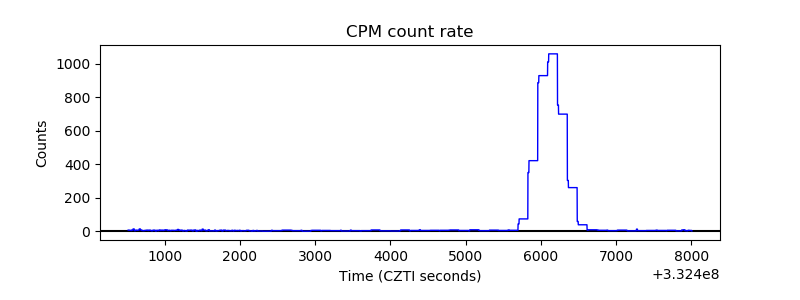 |
| CZT Counter | 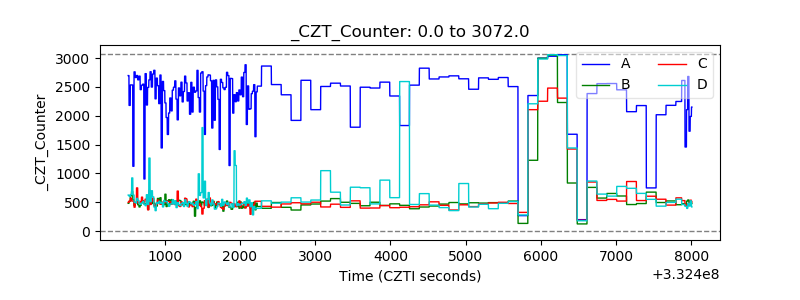 |
| +2.5 Volts monitor |  |
| +5 Volts monitor |  |
| _ROLL_ROT |  |
| _Roll_DEC |  |
| _Roll_RA | 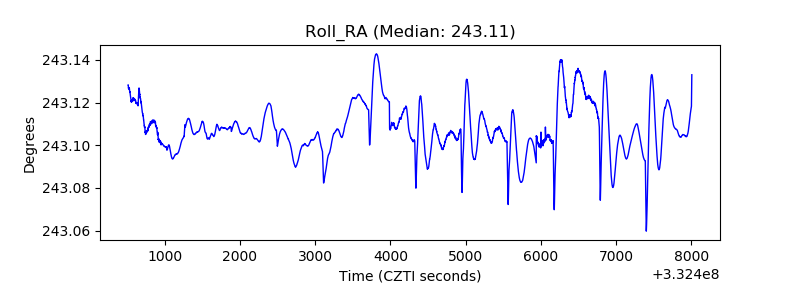 |
| Veto Counter | 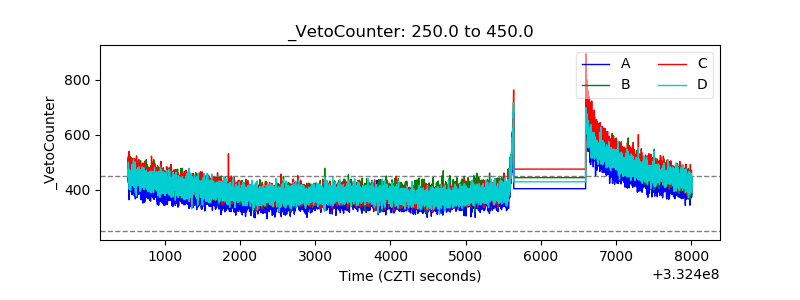 |