| Param | Original file | Final file |
|---|---|---|
| Filename | modeM0/AS1T03_214T01_9000003758_25924cztM0_level2.evt | modeM0/AS1T03_214T01_9000003758_25924cztM0_level2_quad_clean.evt |
| Size (bytes) | 808,727,040 | 108,060,480 |
| Size | 771.3 MB | 103.1 MB |
| Events in quadrant A | 13,771,827 | 326,607 |
| Events in quadrant B | 3,360,121 | 877,852 |
| Events in quadrant C | 3,125,418 | 827,257 |
| Events in quadrant D | 3,830,900 | 821,635 |
| Mode M0 | |||
|---|---|---|---|
| Quadrant | BADHDUFLAG | Total packets | Discarded packets |
| A | 0 | 44980 | 0 |
| B | 0 | 13873 | 0 |
| C | 0 | 13044 | 0 |
| D | 0 | 15397 | 0 |
| Mode M9 | |||
|---|---|---|---|
| Quadrant | BADHDUFLAG | Total packets | Discarded packets |
| A | 0 | 13 | 0 |
| B | 0 | 13 | 0 |
| C | 0 | 13 | 0 |
| D | 0 | 13 | 0 |
| Quadrant | Total seconds | Saturated seconds | Saturation percentage |
|---|---|---|---|
| A | 5970 | 5172 | 86.633166% |
| B | 5970 | 102 | 1.708543% |
| C | 5970 | 113 | 1.892797% |
| D | 5969 | 200 | 3.350645% |
Noise dominated data is calculated using 1-second bins in cleaned event files. If a bin has >2000 counts, and if more than 50% of those come from <1% of pixels, then it is considered to be noise-dominated and hence unusable.
| Quadrant | # 1 sec bins | Bins with >0 counts | Bins with >2000 counts | High rate bins dominated by noise | Noise dominated (total time) | Noise dominated (detector-on time) | Marked lightcurve |
|---|---|---|---|---|---|---|---|
| A | 7299 | 5970 | 4621 | 4621 | 63.31% | 77.40% | 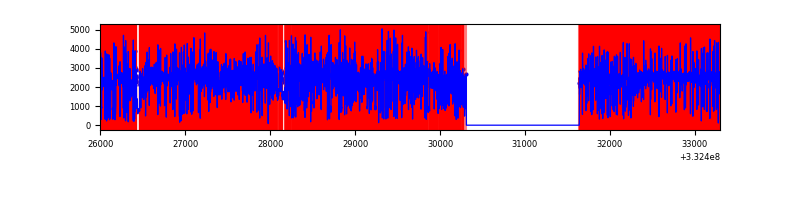 |
| B | 7300 | 5971 | 20 | 20 | 0.27% | 0.33% | 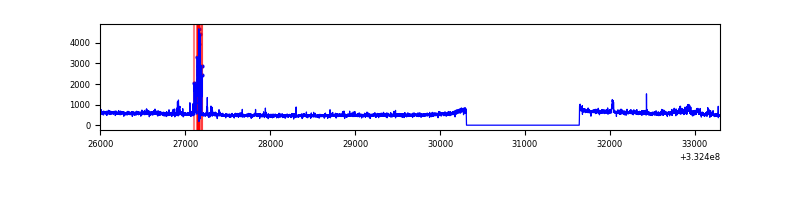 |
| C | 7300 | 5971 | 1 | 1 | 0.01% | 0.02% | 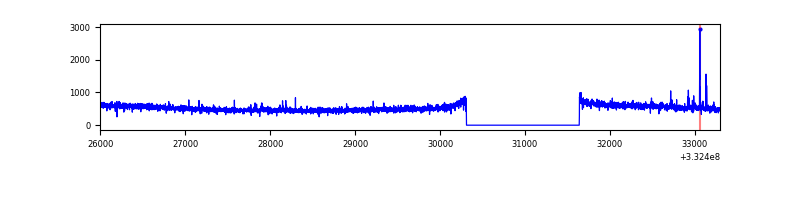 |
| D | 7299 | 5970 | 126 | 126 | 1.73% | 2.11% | 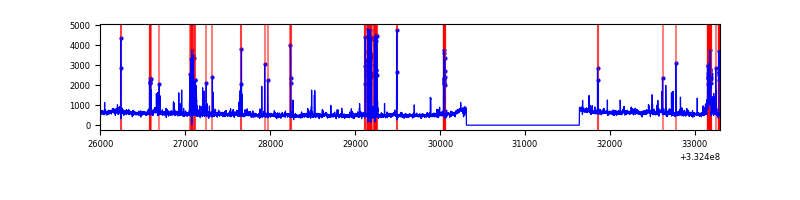 |
Top three noisy pixels from each quadrant. If the there are fewer than three noisy pixels in the level2.evt file, extra rows are filled as -1
| Pixel properties | Quadrant properties | ||||||
|---|---|---|---|---|---|---|---|
| Quadrant | DetID | PixID | Counts | Sigma | Mean | Median | Sigma |
| A | 0 | 13 | 12325794 | 164885.04 | 374 | 369 | 74.8 |
| A | 13 | 254 | 4815 | 59.48 | 374 | 369 | 74.8 |
| A | 0 | 226 | 3095 | 36.47 | 374 | 369 | 74.8 |
| B | 15 | 220 | 114348 | 763.77 | 796 | 779 | 148.7 |
| B | 0 | 190 | 47999 | 317.56 | 796 | 779 | 148.7 |
| B | 15 | 33 | 42120 | 278.03 | 796 | 779 | 148.7 |
| C | 14 | 238 | 126702 | 729.93 | 756 | 761 | 172.5 |
| C | 3 | 233 | 33805 | 191.52 | 756 | 761 | 172.5 |
| C | 2 | 16 | 22145 | 123.94 | 756 | 761 | 172.5 |
| D | 1 | 52 | 845372 | 4629.47 | 771 | 752 | 182.4 |
| D | 7 | 80 | 38198 | 205.25 | 771 | 752 | 182.4 |
| D | 2 | 234 | 25434 | 135.29 | 771 | 752 | 182.4 |
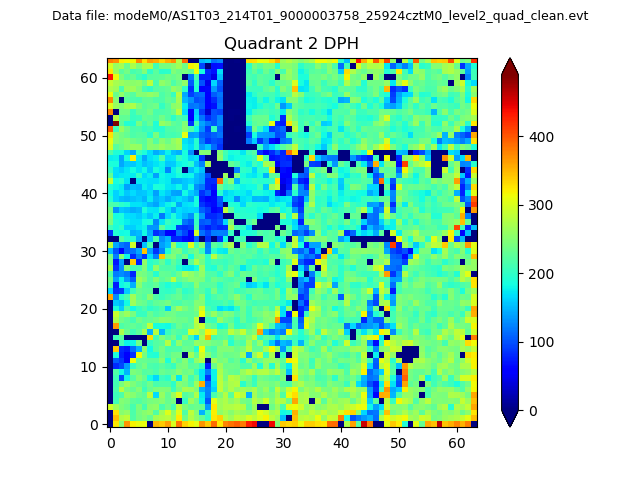
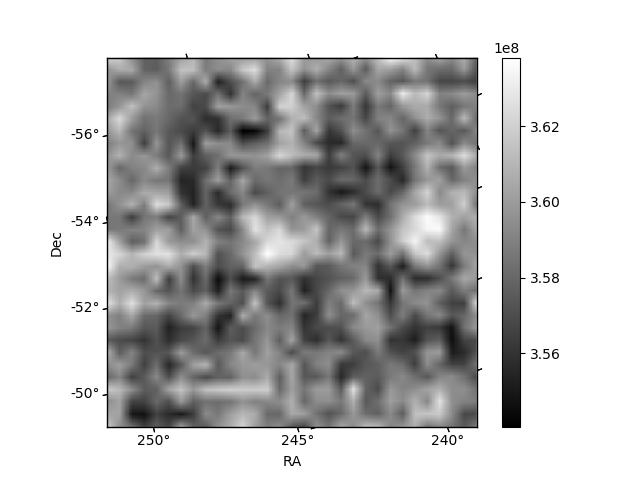
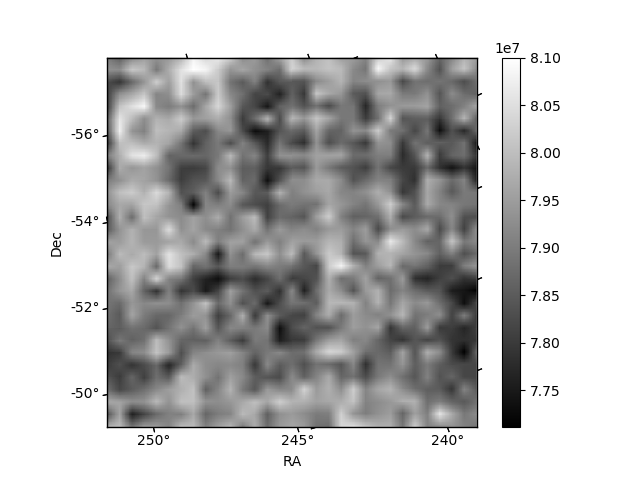
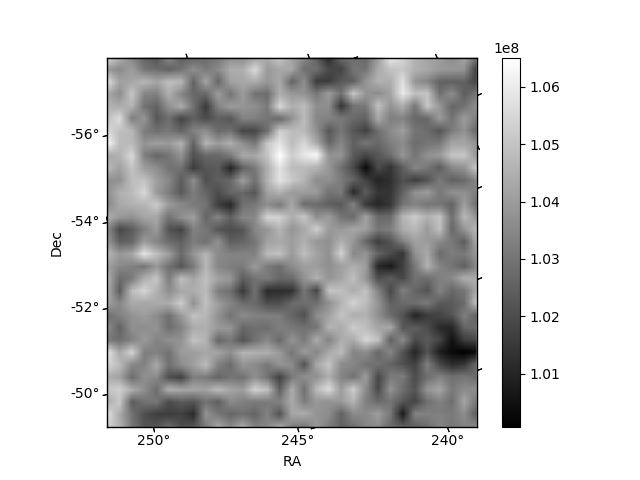
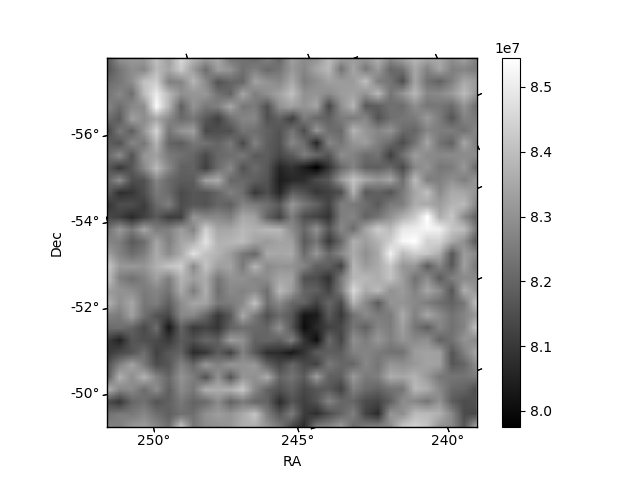
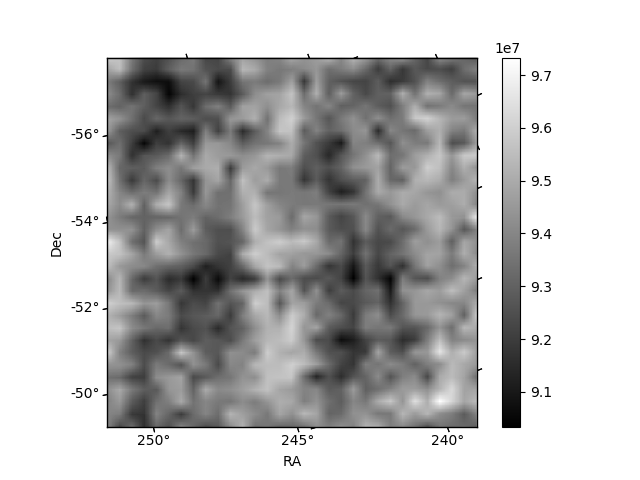
Histogram calculated using DETX and DETY for each event in the final _common_clean file
| Quadrant A | 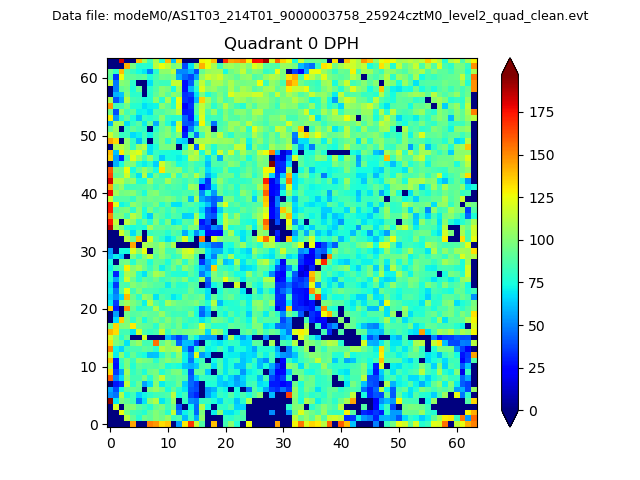 |
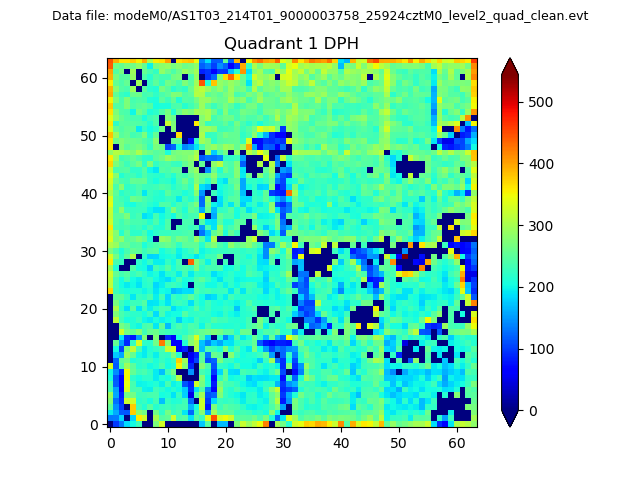 |
Quadrant B |
|---|---|---|---|
| Quadrant D | 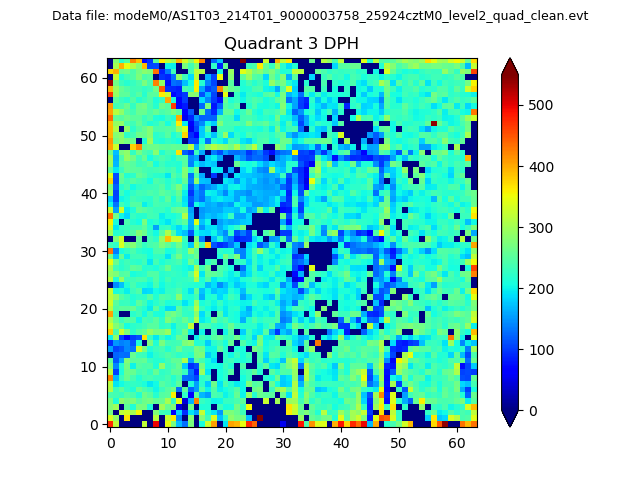 |
 |
Quadrant C |
| Plot type | Count rate plots | Images |
|---|---|---|
| Comparison with Poisson distribution Blue bars denote a histogram of data divided into 1 sec bins. Red curve is a Poisson curve with rate = median count rate of data. |
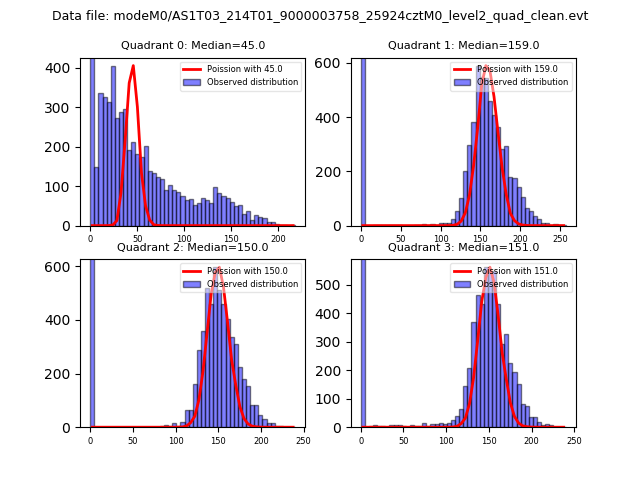 |
 |
| Quadrant-wise count rates Data is divided into 100 sec bins |
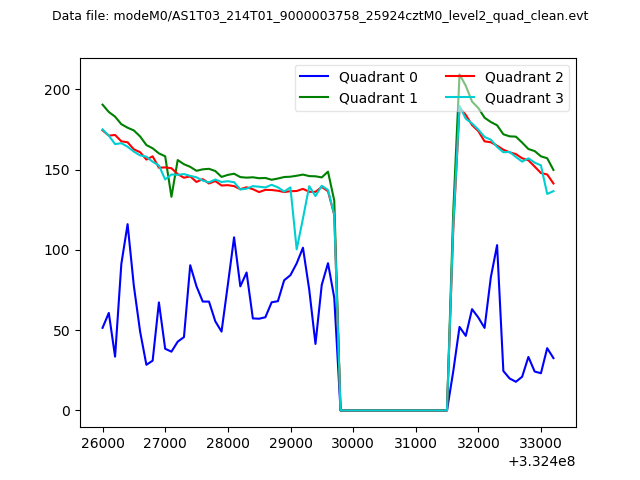 |
|
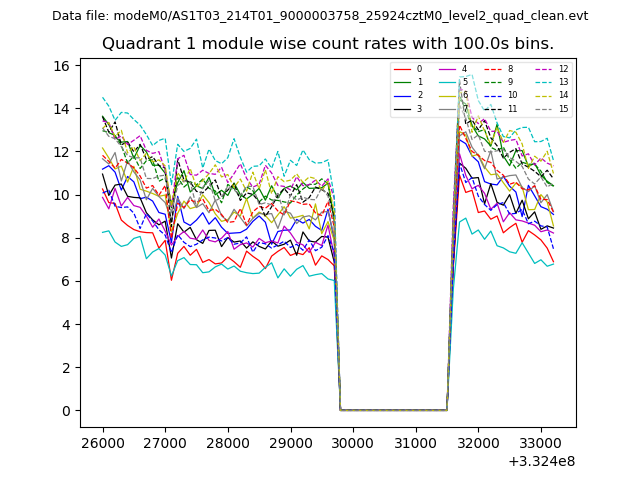
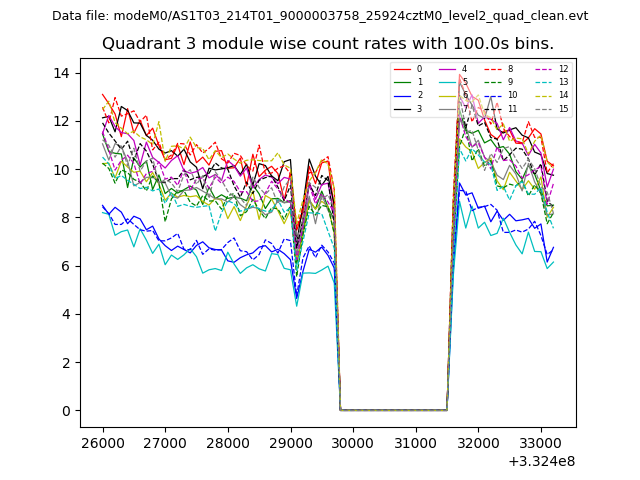
| Module-wise count rates for Quadrant A Data is divided into 100 sec bins |
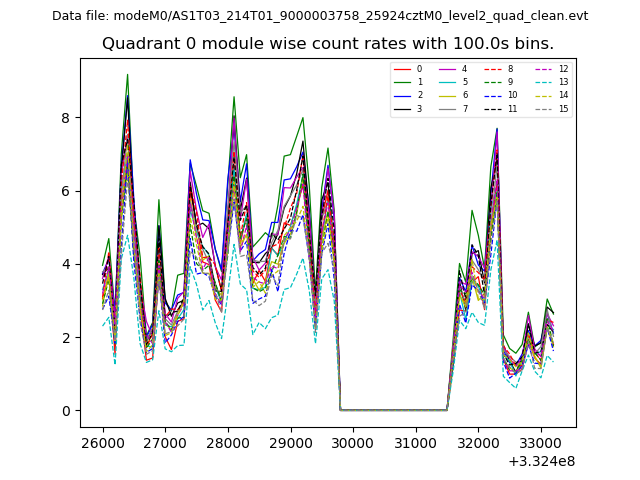 |
 |
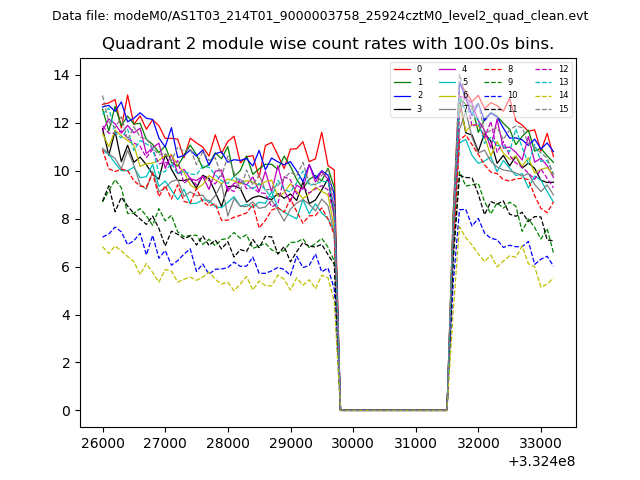
| Module-wise count rates for Quadrant B Data is divided into 100 sec bins |
 |
 |
| Module-wise count rates for Quadrant C Data is divided into 100 sec bins |
 |
 |
| Module-wise count rates for Quadrant D Data is divided into 100 sec bins |
 |
 |
| Parameter | Plot |
|---|---|
| CZT HV Monitor | 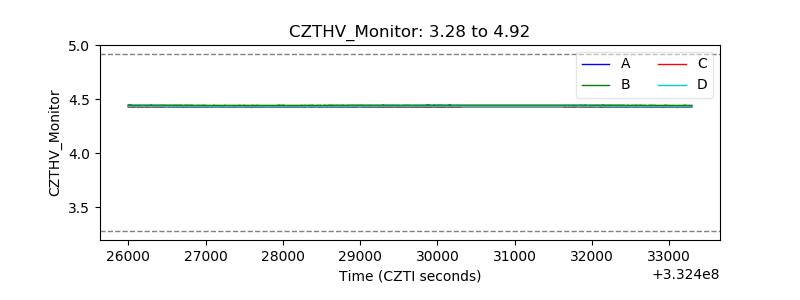 |
| D_VDD | 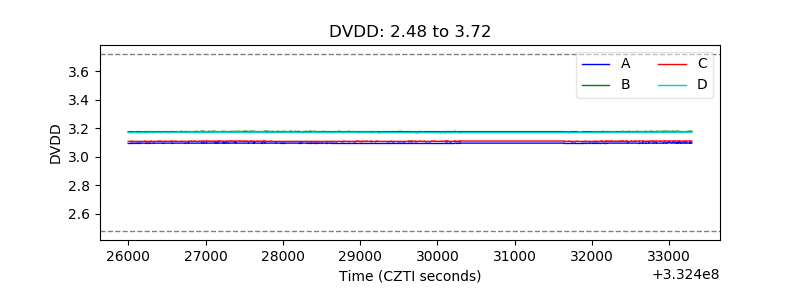 |
| Temperature 1 | 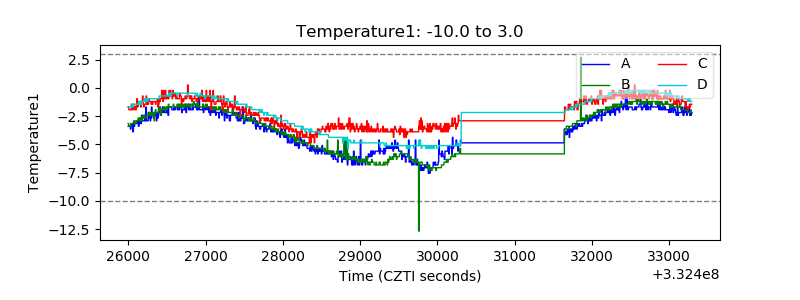 |
| Veto HV Monitor | 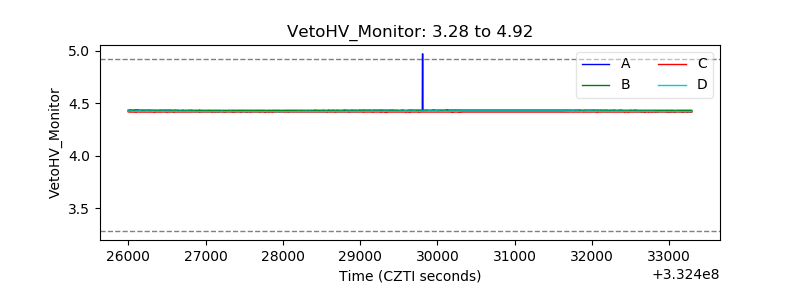 |
| Veto LLD | 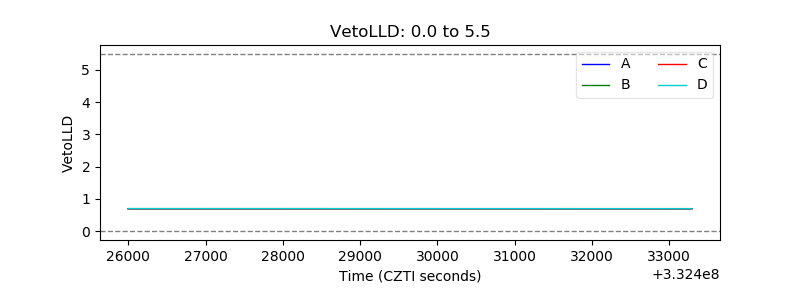 |
| Alpha Counter | 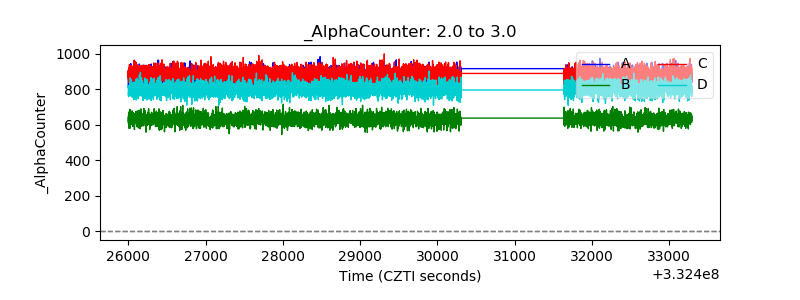 |
| _CPM_Rate | 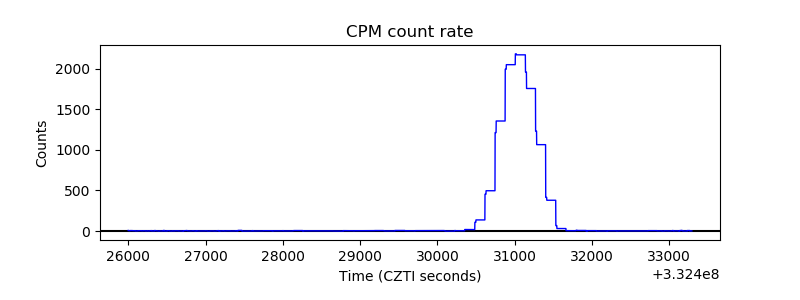 |
| CZT Counter | 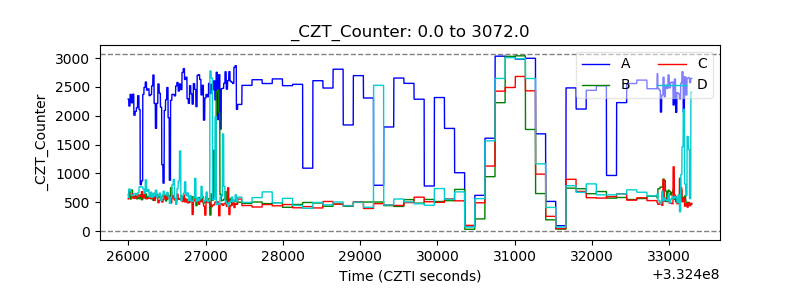 |
| +2.5 Volts monitor |  |
| +5 Volts monitor |  |
| _ROLL_ROT | 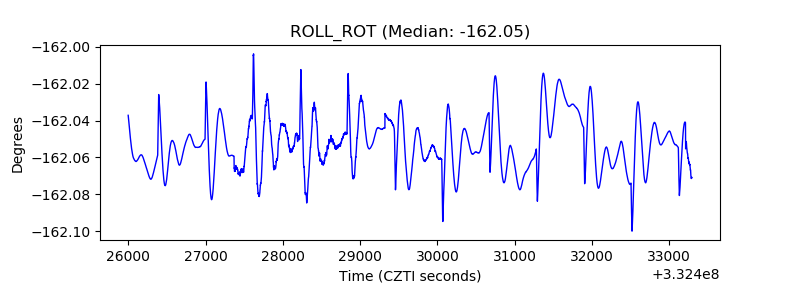 |
| _Roll_DEC | 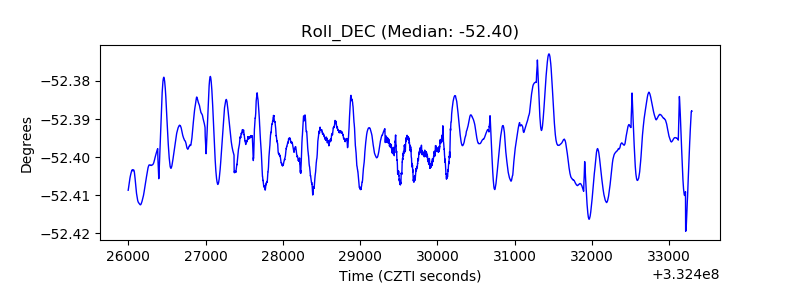 |
| _Roll_RA | 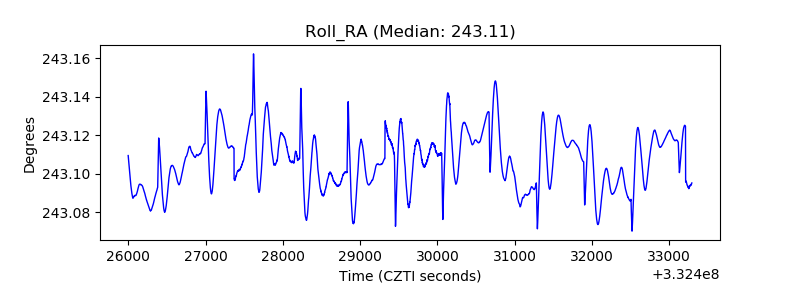 |
| Veto Counter | 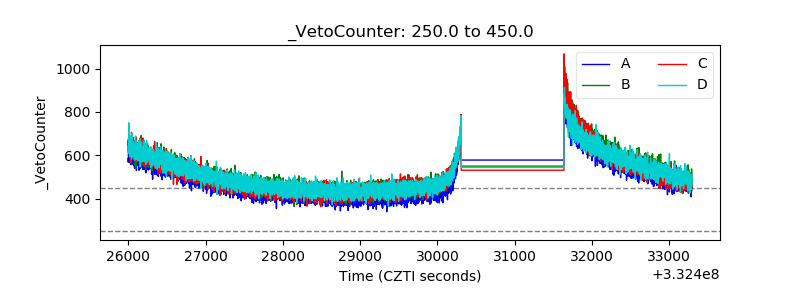 |