| Param | Original file | Final file |
|---|---|---|
| Filename | modeM0/AS1T03_214T01_9000003758_25925cztM0_level2.evt | modeM0/AS1T03_214T01_9000003758_25925cztM0_level2_quad_clean.evt |
| Size (bytes) | 776,839,680 | 89,225,280 |
| Size | 740.9 MB | 85.1 MB |
| Events in quadrant A | 13,846,426 | 250,481 |
| Events in quadrant B | 2,956,679 | 714,094 |
| Events in quadrant C | 2,839,912 | 672,673 |
| Events in quadrant D | 3,502,937 | 669,440 |
| Mode M0 | |||
|---|---|---|---|
| Quadrant | BADHDUFLAG | Total packets | Discarded packets |
| A | 0 | 44999 | 0 |
| B | 0 | 12355 | 0 |
| C | 0 | 11940 | 0 |
| D | 0 | 14019 | 0 |
| Mode M9 | |||
|---|---|---|---|
| Quadrant | BADHDUFLAG | Total packets | Discarded packets |
| A | 0 | 14 | 0 |
| B | 0 | 14 | 0 |
| C | 0 | 14 | 0 |
| D | 0 | 14 | 0 |
| Quadrant | Total seconds | Saturated seconds | Saturation percentage |
|---|---|---|---|
| A | 5624 | 5282 | 93.918919% |
| B | 5624 | 72 | 1.280228% |
| C | 5625 | 81 | 1.440000% |
| D | 5625 | 170 | 3.022222% |
Noise dominated data is calculated using 1-second bins in cleaned event files. If a bin has >2000 counts, and if more than 50% of those come from <1% of pixels, then it is considered to be noise-dominated and hence unusable.
| Quadrant | # 1 sec bins | Bins with >0 counts | Bins with >2000 counts | High rate bins dominated by noise | Noise dominated (total time) | Noise dominated (detector-on time) | Marked lightcurve |
|---|---|---|---|---|---|---|---|
| A | 6959 | 5625 | 4807 | 4807 | 69.08% | 85.46% | 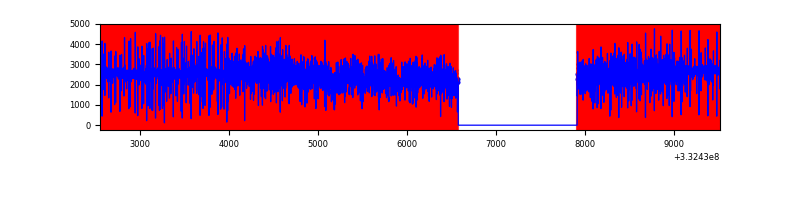 |
| B | 6959 | 5625 | 1 | 1 | 0.01% | 0.02% | 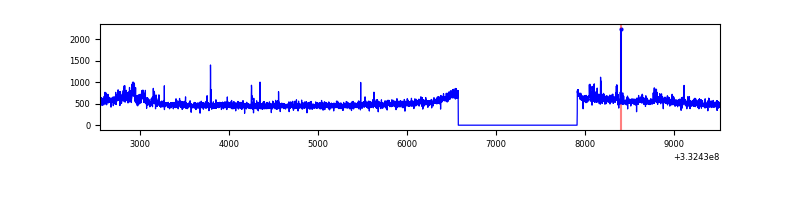 |
| C | 6960 | 5626 | 2 | 2 | 0.03% | 0.04% | 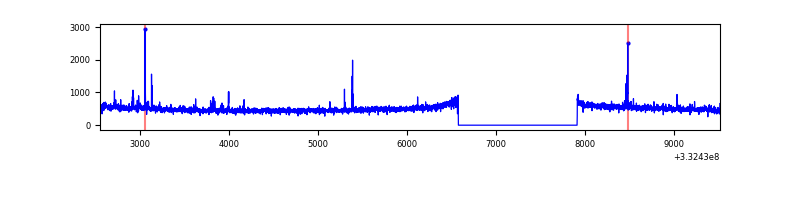 |
| D | 6960 | 5626 | 122 | 122 | 1.75% | 2.17% |  |
Top three noisy pixels from each quadrant. If the there are fewer than three noisy pixels in the level2.evt file, extra rows are filled as -1
| Pixel properties | Quadrant properties | ||||||
|---|---|---|---|---|---|---|---|
| Quadrant | DetID | PixID | Counts | Sigma | Mean | Median | Sigma |
| A | 0 | 13 | 12508304 | 180792.08 | 346 | 340 | 69.2 |
| A | 12 | 16 | 4964 | 66.84 | 346 | 340 | 69.2 |
| A | 13 | 254 | 4314 | 57.44 | 346 | 340 | 69.2 |
| B | 0 | 190 | 69037 | 509.12 | 718 | 703 | 134.2 |
| B | 15 | 33 | 45389 | 332.93 | 718 | 703 | 134.2 |
| B | 0 | 219 | 24867 | 180.03 | 718 | 703 | 134.2 |
| C | 14 | 238 | 113125 | 723.57 | 678 | 681 | 155.4 |
| C | 3 | 233 | 46992 | 298.01 | 678 | 681 | 155.4 |
| C | 2 | 16 | 37848 | 239.17 | 678 | 681 | 155.4 |
| D | 1 | 52 | 819048 | 4954.55 | 692 | 675 | 165.2 |
| D | 2 | 234 | 24694 | 145.41 | 692 | 675 | 165.2 |
| D | 13 | 168 | 24299 | 143.02 | 692 | 675 | 165.2 |
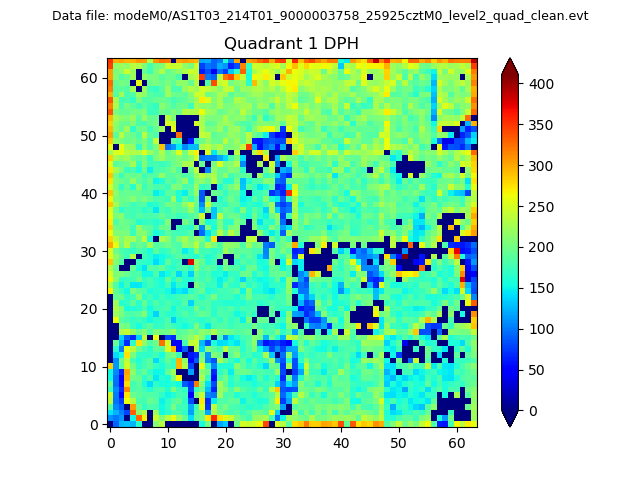
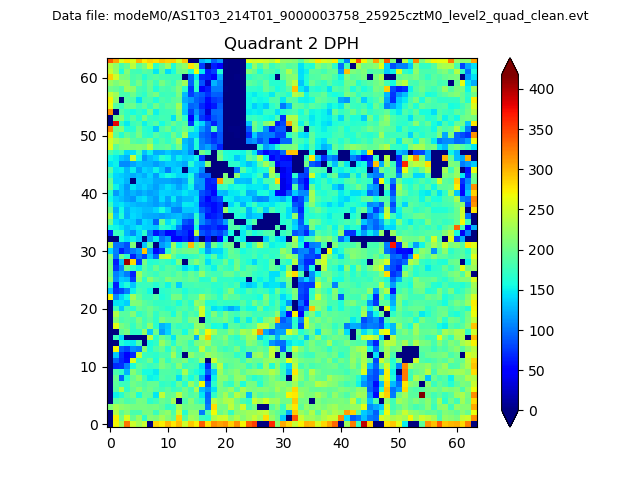
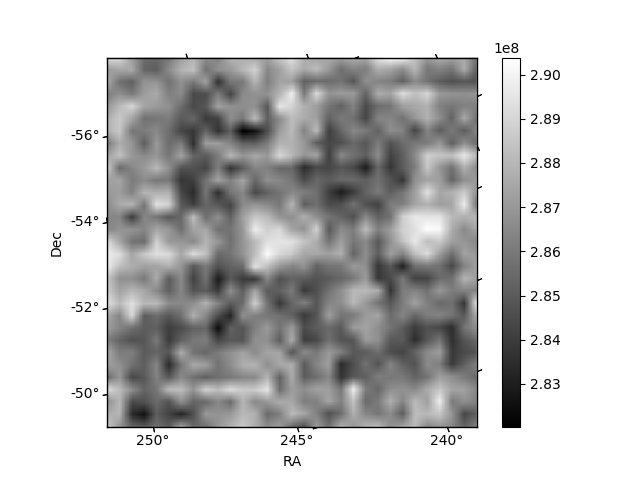
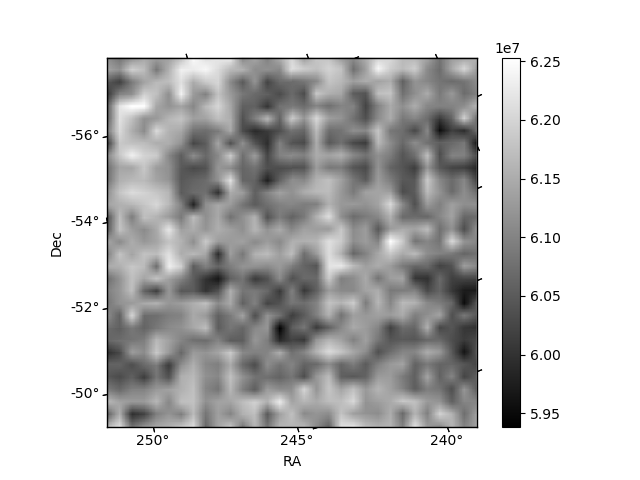
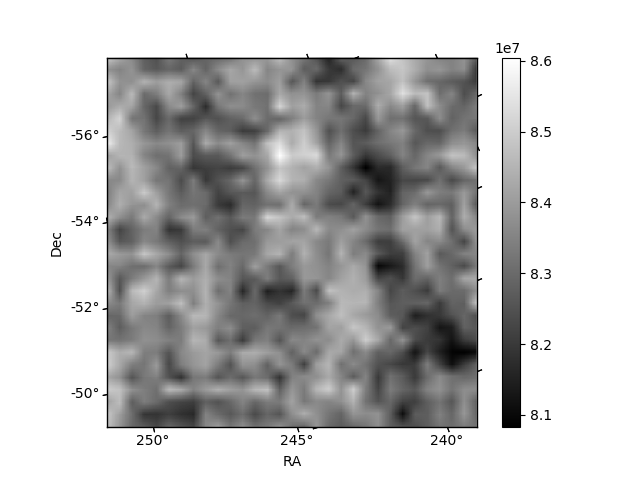
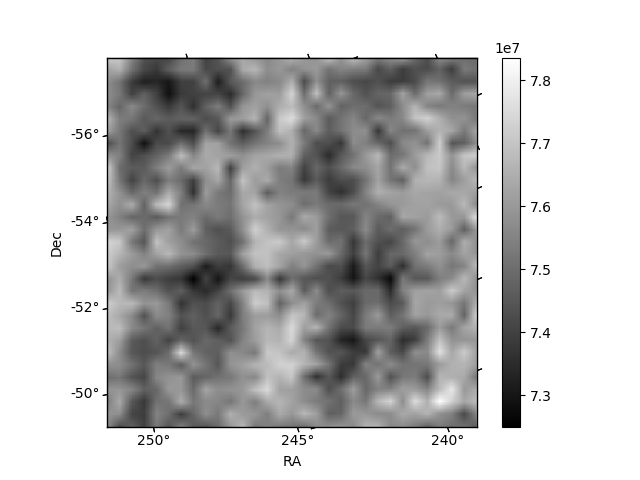
Histogram calculated using DETX and DETY for each event in the final _common_clean file
| Quadrant A | 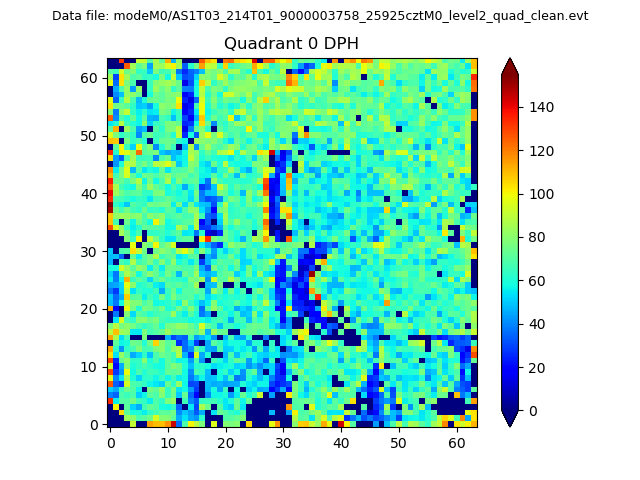 |
 |
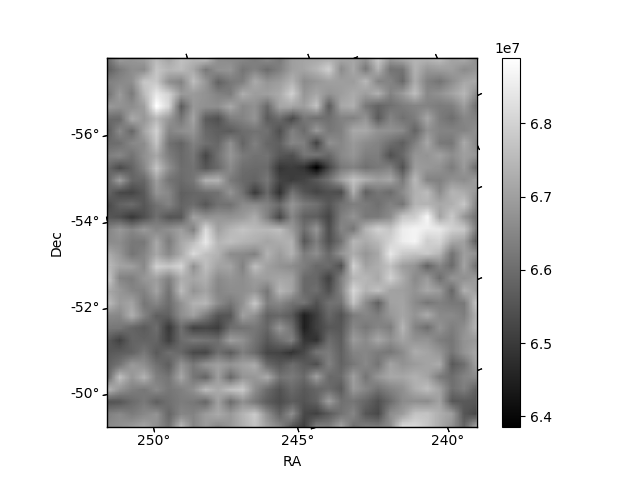
Quadrant B |
|---|---|---|---|
| Quadrant D | 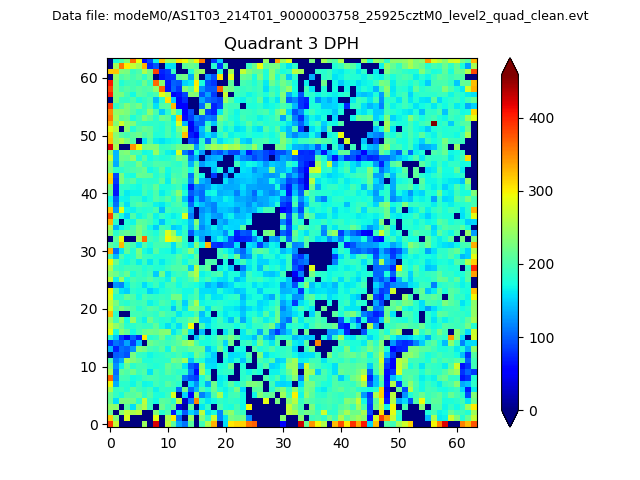 |
 |
Quadrant C |
| Plot type | Count rate plots | Images |
|---|---|---|
| Comparison with Poisson distribution Blue bars denote a histogram of data divided into 1 sec bins. Red curve is a Poisson curve with rate = median count rate of data. |
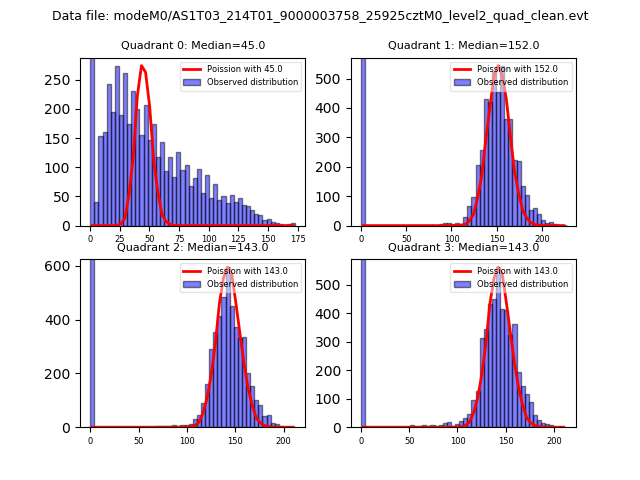 |
 |
| Quadrant-wise count rates Data is divided into 100 sec bins |
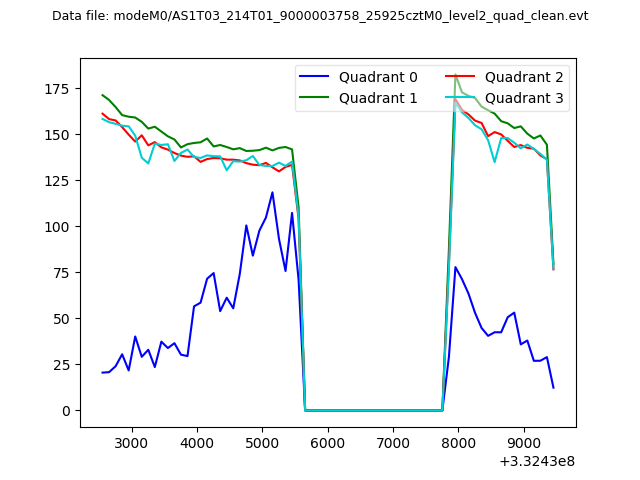 |
|
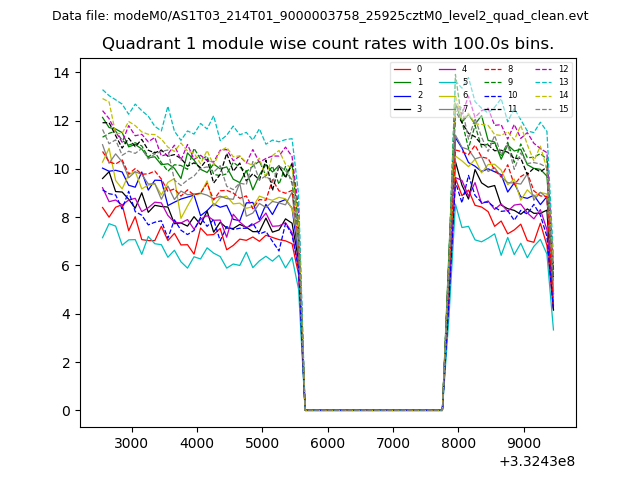
| Module-wise count rates for Quadrant A Data is divided into 100 sec bins |
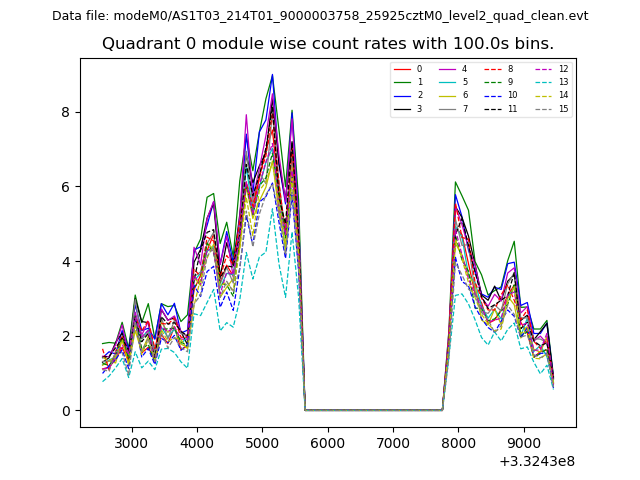 |
 |
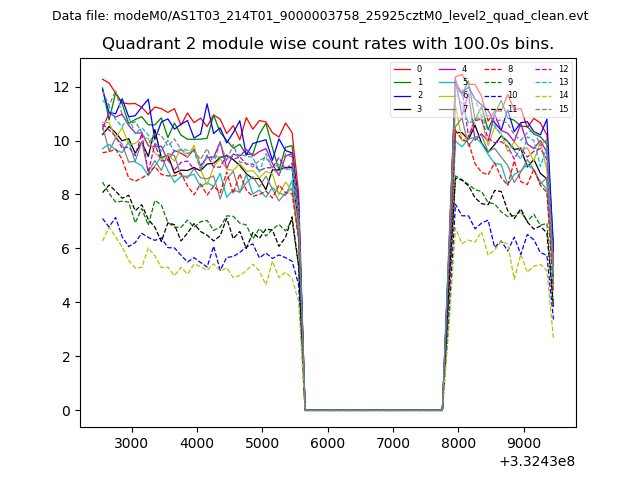
| Module-wise count rates for Quadrant B Data is divided into 100 sec bins |
 |
 |
| Module-wise count rates for Quadrant C Data is divided into 100 sec bins |
 |
 |
| Module-wise count rates for Quadrant D Data is divided into 100 sec bins |
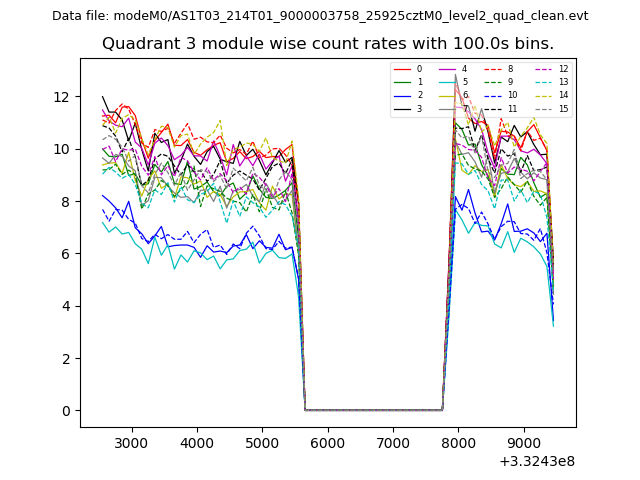 |
 |
| Parameter | Plot |
|---|---|
| CZT HV Monitor | 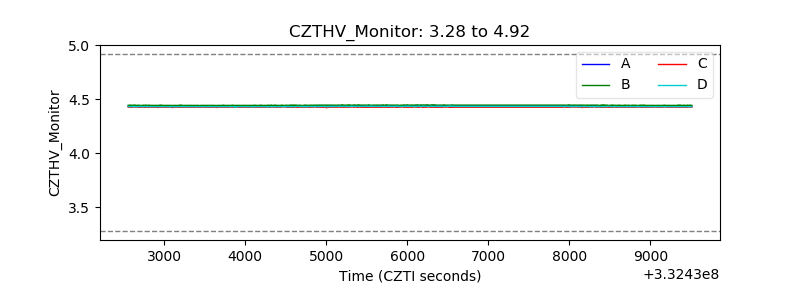 |
| D_VDD | 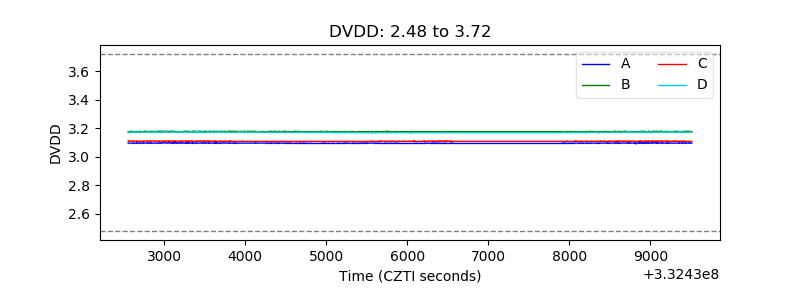 |
| Temperature 1 | 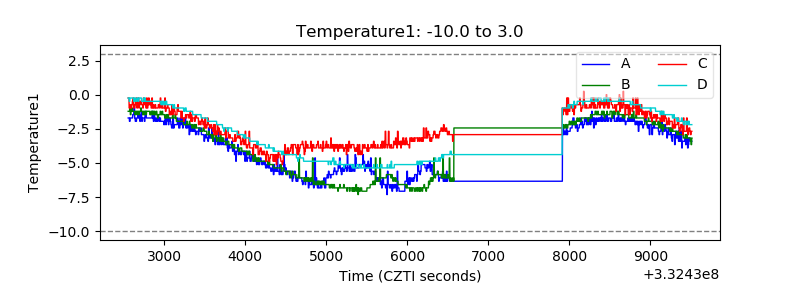 |
| Veto HV Monitor | 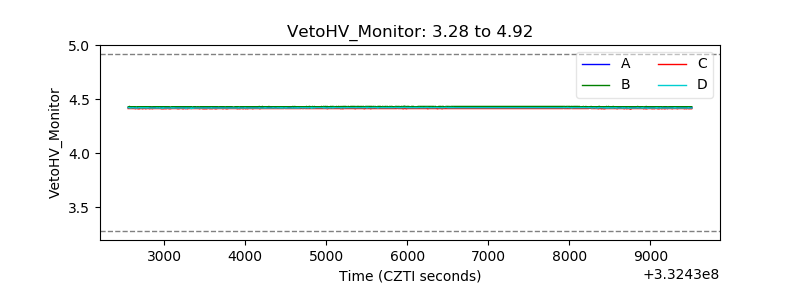 |
| Veto LLD | 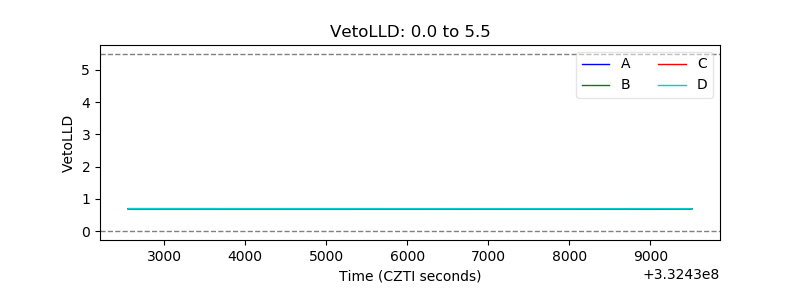 |
| Alpha Counter | 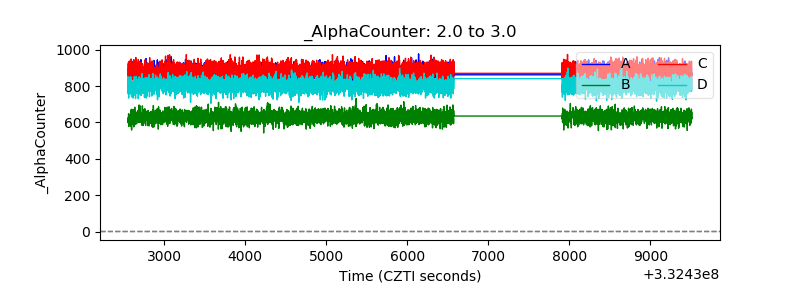 |
| _CPM_Rate | 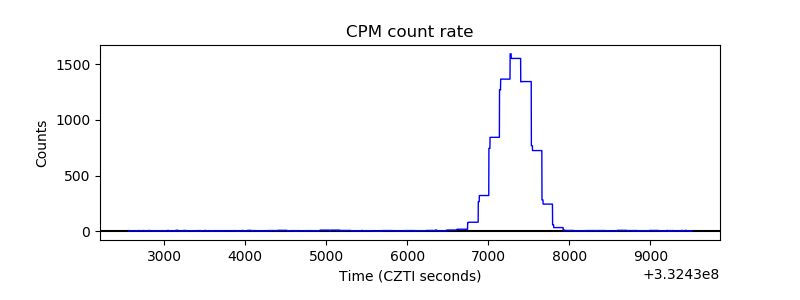 |
| CZT Counter | 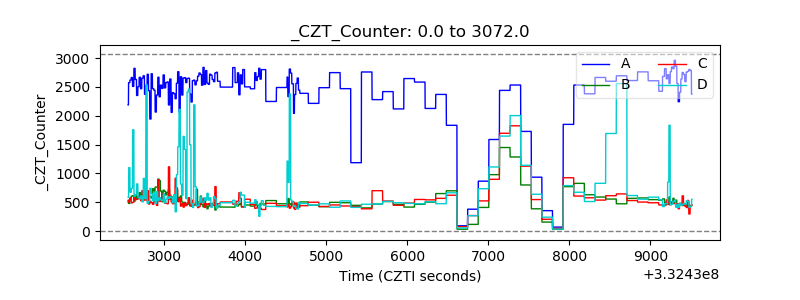 |
| +2.5 Volts monitor |  |
| +5 Volts monitor |  |
| _ROLL_ROT | 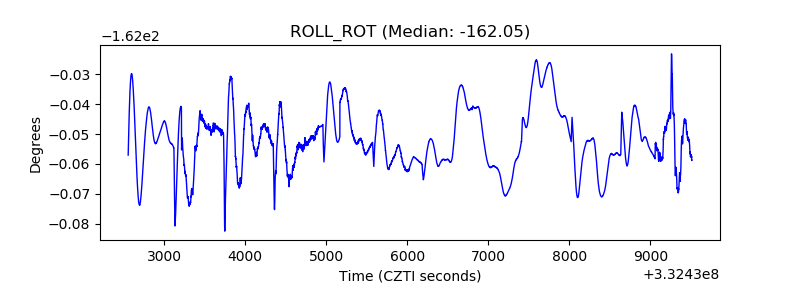 |
| _Roll_DEC | 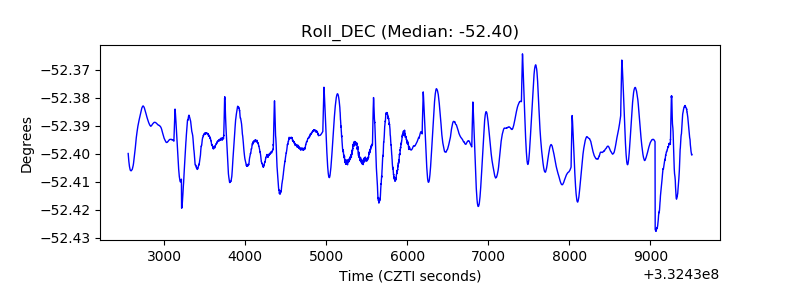 |
| _Roll_RA | 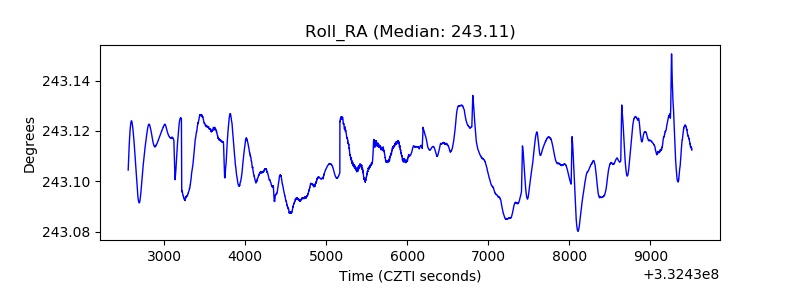 |
| Veto Counter | 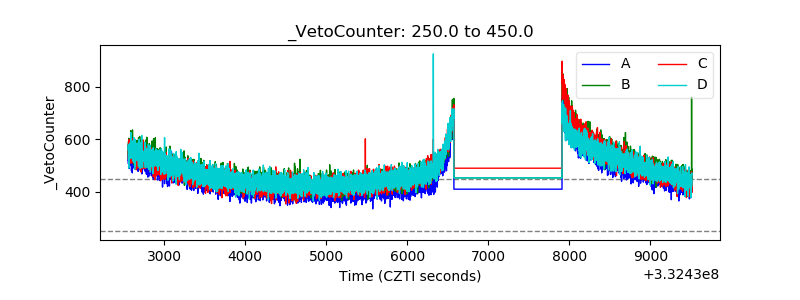 |