| Param | Original file | Final file |
|---|---|---|
| Filename | modeM0/AS1T03_214T01_9000003758_25926cztM0_level2.evt | modeM0/AS1T03_214T01_9000003758_25926cztM0_level2_quad_clean.evt |
| Size (bytes) | 838,797,120 | 80,573,760 |
| Size | 799.9 MB | 76.8 MB |
| Events in quadrant A | 15,379,488 | 171,621 |
| Events in quadrant B | 3,032,111 | 641,467 |
| Events in quadrant C | 2,949,749 | 604,130 |
| Events in quadrant D | 3,634,859 | 600,671 |
| Mode M0 | |||
|---|---|---|---|
| Quadrant | BADHDUFLAG | Total packets | Discarded packets |
| A | 0 | 49776 | 0 |
| B | 0 | 12826 | 0 |
| C | 0 | 12621 | 0 |
| D | 0 | 14822 | 0 |
| Mode M9 | |||
|---|---|---|---|
| Quadrant | BADHDUFLAG | Total packets | Discarded packets |
| A | 0 | 11 | 0 |
| B | 0 | 11 | 0 |
| C | 0 | 11 | 0 |
| D | 0 | 11 | 0 |
| Quadrant | Total seconds | Saturated seconds | Saturation percentage |
|---|---|---|---|
| A | 6005 | 5925 | 98.667777% |
| B | 6006 | 82 | 1.365301% |
| C | 6006 | 85 | 1.415251% |
| D | 6005 | 143 | 2.381349% |
Noise dominated data is calculated using 1-second bins in cleaned event files. If a bin has >2000 counts, and if more than 50% of those come from <1% of pixels, then it is considered to be noise-dominated and hence unusable.
| Quadrant | # 1 sec bins | Bins with >0 counts | Bins with >2000 counts | High rate bins dominated by noise | Noise dominated (total time) | Noise dominated (detector-on time) | Marked lightcurve |
|---|---|---|---|---|---|---|---|
| A | 7139 | 6005 | 5403 | 5403 | 75.68% | 89.98% | 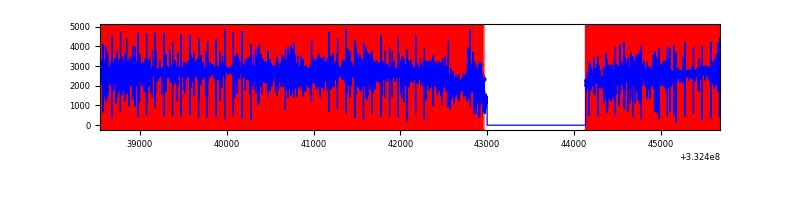 |
| B | 7141 | 6007 | 0 | 0 | 0.00% | 0.00% | 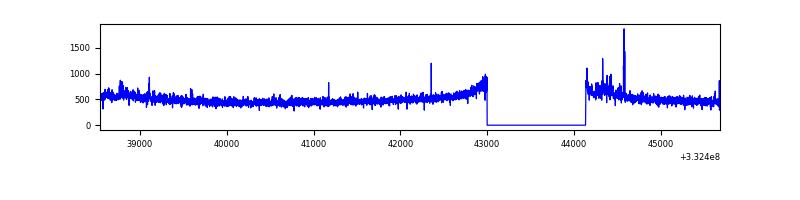 |
| C | 7141 | 6007 | 1 | 1 | 0.01% | 0.02% | 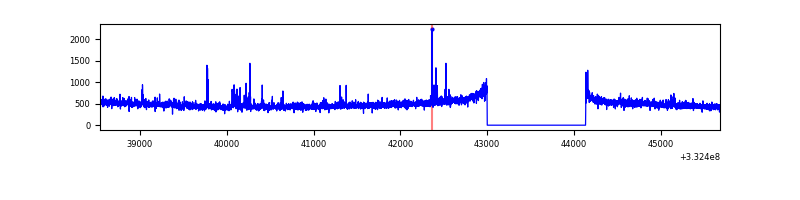 |
| D | 7140 | 6006 | 75 | 75 | 1.05% | 1.25% | 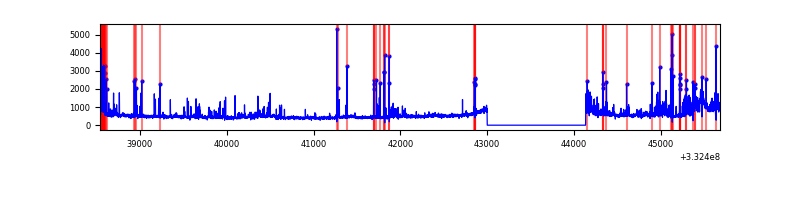 |
Top three noisy pixels from each quadrant. If the there are fewer than three noisy pixels in the level2.evt file, extra rows are filled as -1
| Pixel properties | Quadrant properties | ||||||
|---|---|---|---|---|---|---|---|
| Quadrant | DetID | PixID | Counts | Sigma | Mean | Median | Sigma |
| A | 0 | 13 | 14242382 | 237255.69 | 294 | 289 | 60.0 |
| A | 13 | 254 | 3911 | 60.34 | 294 | 289 | 60.0 |
| A | 3 | 137 | 2578 | 38.13 | 294 | 289 | 60.0 |
| B | 15 | 33 | 39081 | 271.45 | 746 | 731 | 141.3 |
| B | 0 | 190 | 38889 | 270.09 | 746 | 731 | 141.3 |
| B | 0 | 219 | 30303 | 209.32 | 746 | 731 | 141.3 |
| C | 14 | 238 | 113891 | 696.34 | 705 | 709 | 162.5 |
| C | 3 | 233 | 59465 | 361.49 | 705 | 709 | 162.5 |
| C | 2 | 16 | 28230 | 169.32 | 705 | 709 | 162.5 |
| D | 1 | 52 | 861972 | 5027.69 | 715 | 697 | 171.3 |
| D | 2 | 234 | 26759 | 152.14 | 715 | 697 | 171.3 |
| D | 7 | 80 | 24533 | 139.14 | 715 | 697 | 171.3 |
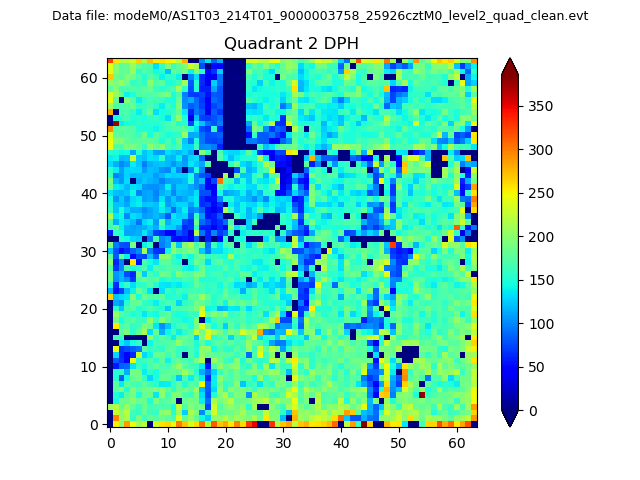
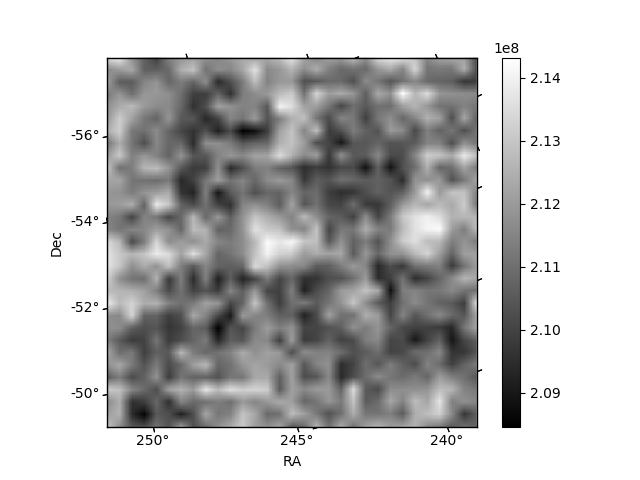
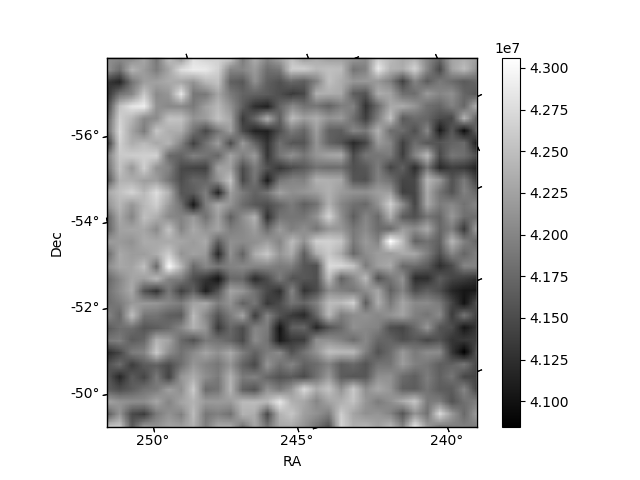
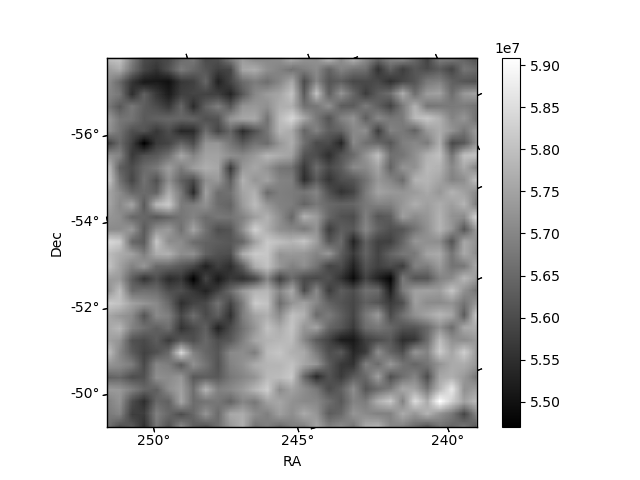
Histogram calculated using DETX and DETY for each event in the final _common_clean file
| Quadrant A | 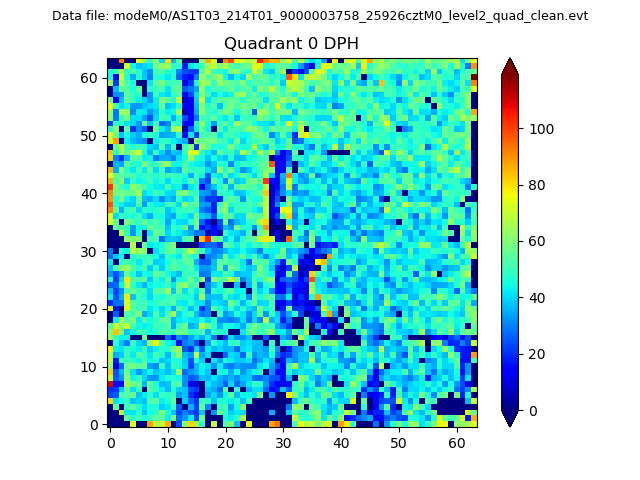 |
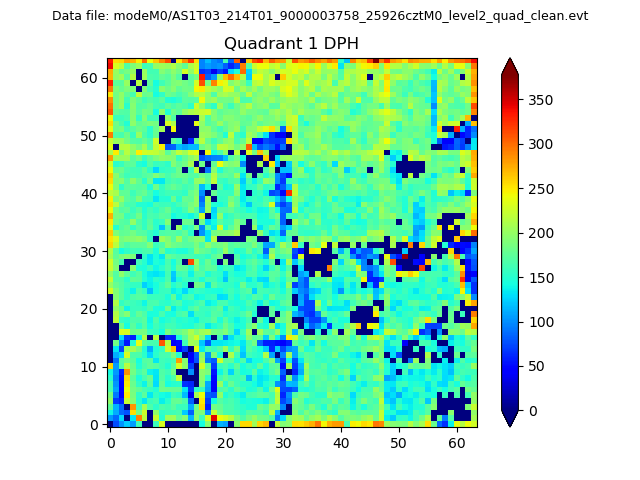 |
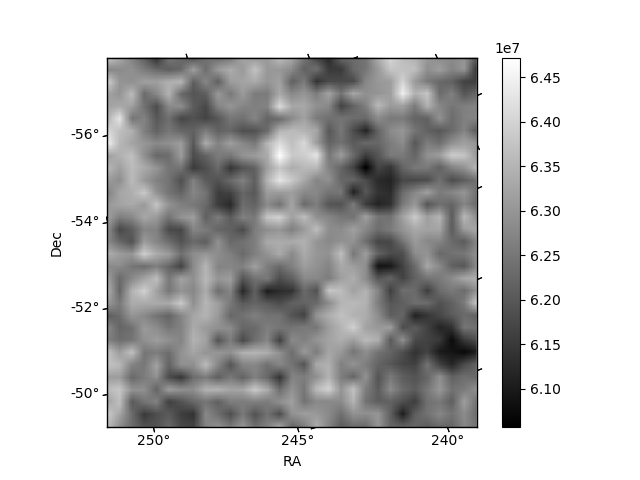
Quadrant B |
|---|---|---|---|
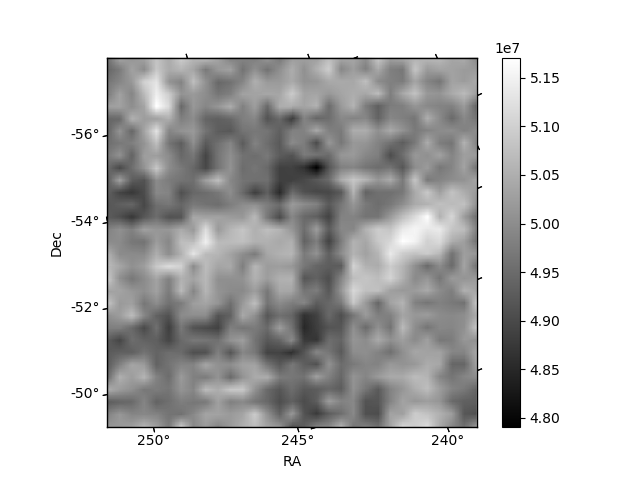
| Quadrant D | 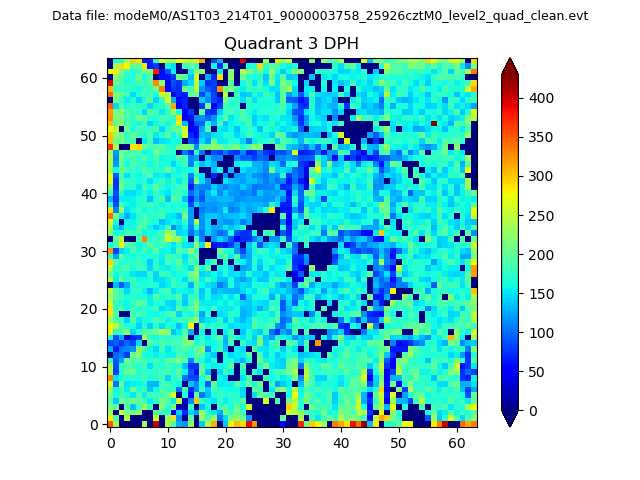 |
 |
Quadrant C |
| Plot type | Count rate plots | Images |
|---|---|---|
| Comparison with Poisson distribution Blue bars denote a histogram of data divided into 1 sec bins. Red curve is a Poisson curve with rate = median count rate of data. |
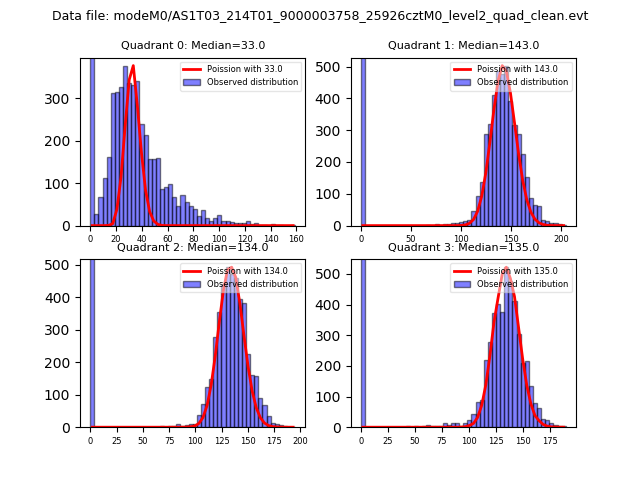 |
 |
| Quadrant-wise count rates Data is divided into 100 sec bins |
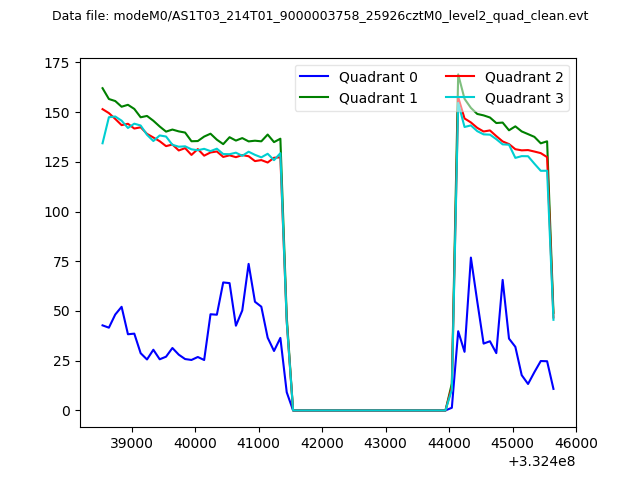 |
|
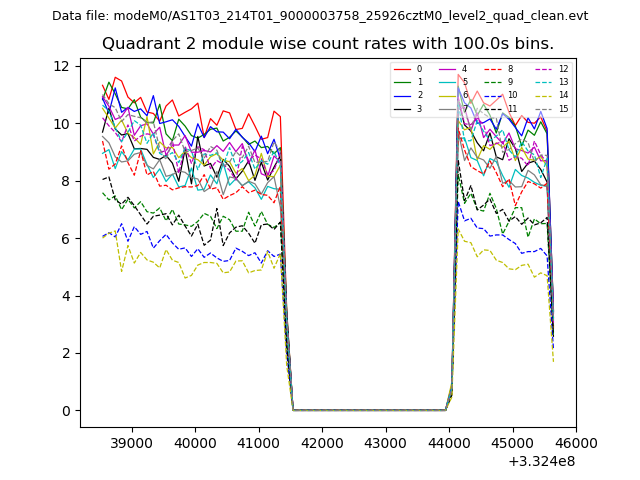
| Module-wise count rates for Quadrant A Data is divided into 100 sec bins |
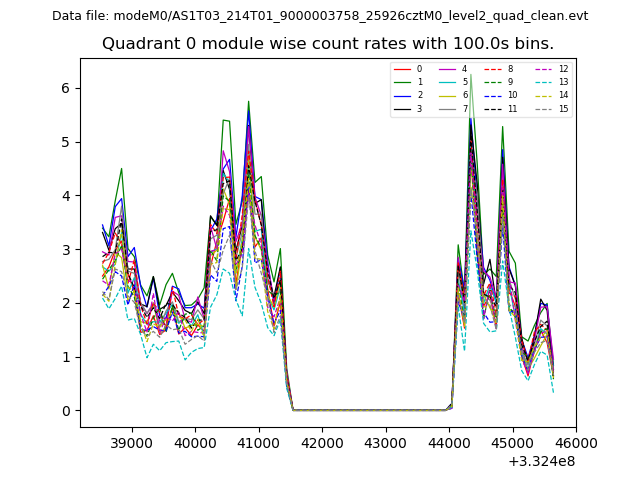 |
 |
| Module-wise count rates for Quadrant B Data is divided into 100 sec bins |
 |
 |
| Module-wise count rates for Quadrant C Data is divided into 100 sec bins |
 |
 |
| Module-wise count rates for Quadrant D Data is divided into 100 sec bins |
 |
 |
| Parameter | Plot |
|---|---|
| CZT HV Monitor | 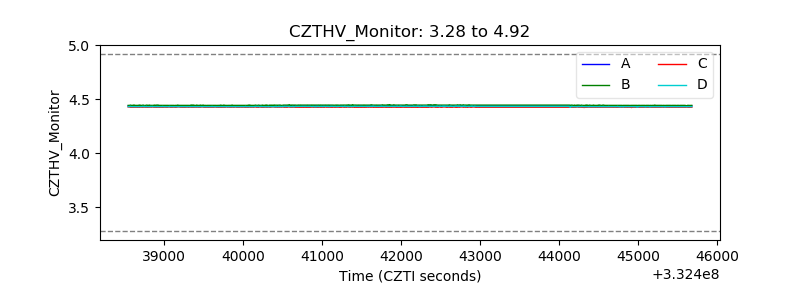 |
| D_VDD |  |
| Temperature 1 | 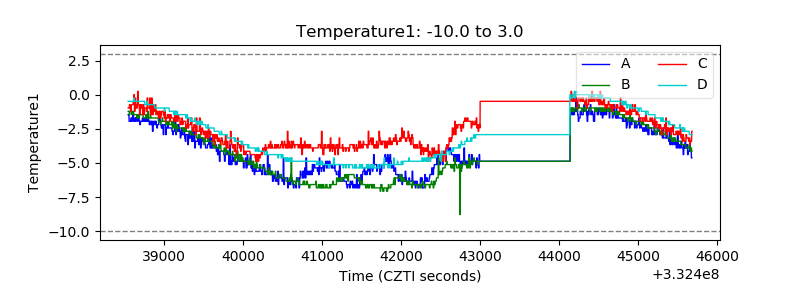 |
| Veto HV Monitor | 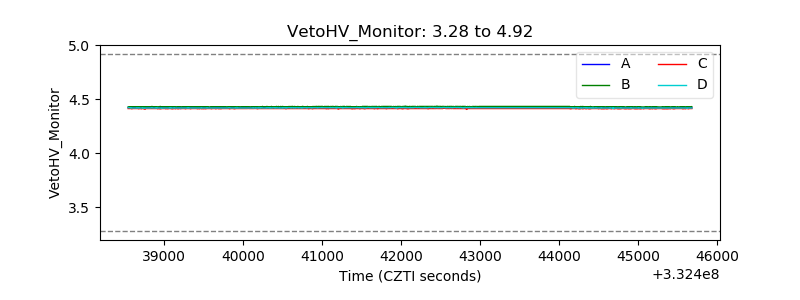 |
| Veto LLD |  |
| Alpha Counter | 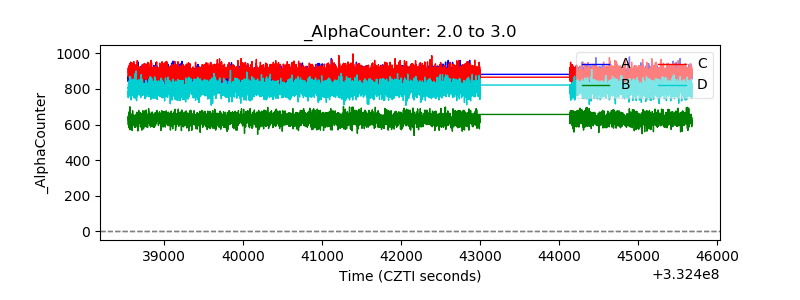 |
| _CPM_Rate | 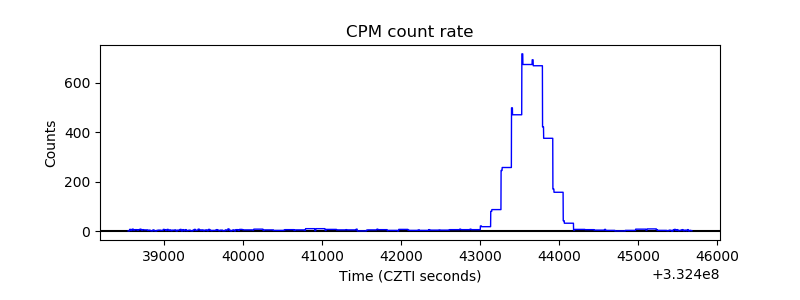 |
| CZT Counter | 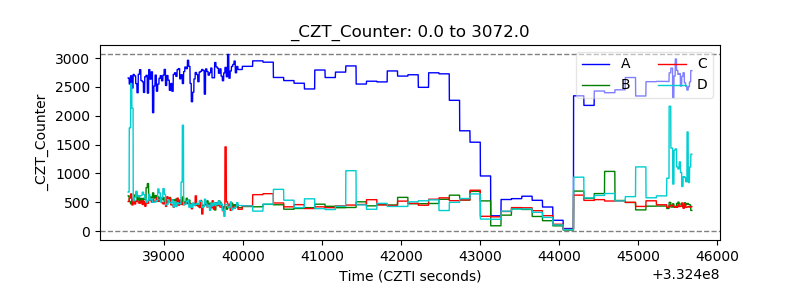 |
| +2.5 Volts monitor |  |
| +5 Volts monitor |  |
| _ROLL_ROT | 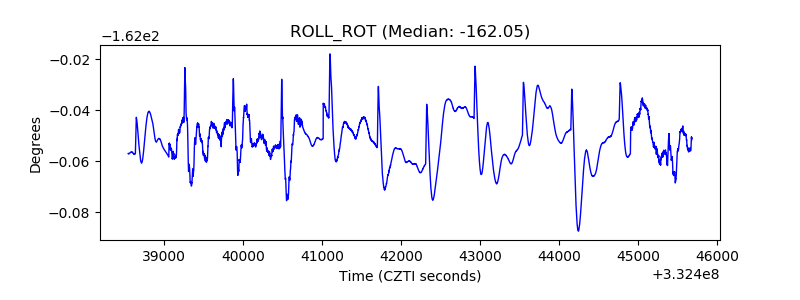 |
| _Roll_DEC | 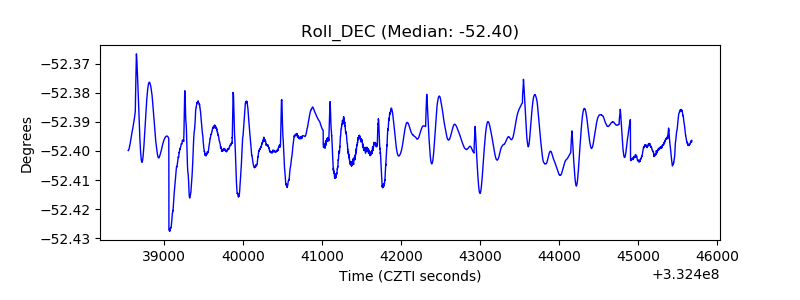 |
| _Roll_RA | 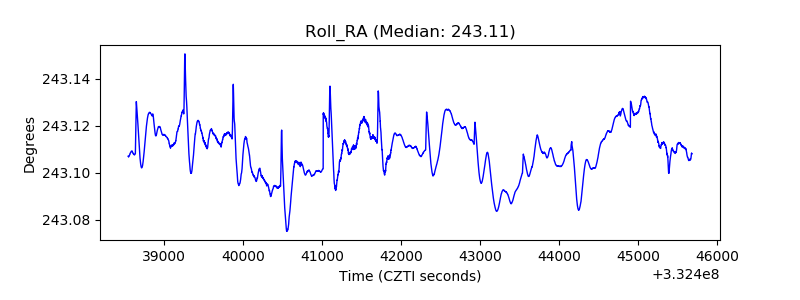 |
| Veto Counter |  |