| Param | Original file | Final file |
|---|---|---|
| Filename | modeM0/AS1T03_214T01_9000003758_25927cztM0_level2.evt | modeM0/AS1T03_214T01_9000003758_25927cztM0_level2_quad_clean.evt |
| Size (bytes) | 903,574,080 | 81,138,240 |
| Size | 861.7 MB | 77.4 MB |
| Events in quadrant A | 16,489,047 | 142,512 |
| Events in quadrant B | 3,150,835 | 648,903 |
| Events in quadrant C | 3,083,224 | 614,679 |
| Events in quadrant D | 4,209,520 | 602,738 |
| Mode M0 | |||
|---|---|---|---|
| Quadrant | BADHDUFLAG | Total packets | Discarded packets |
| A | 0 | 53370 | 0 |
| B | 0 | 13497 | 0 |
| C | 0 | 13360 | 0 |
| D | 0 | 16918 | 0 |
| Mode M9 | |||
|---|---|---|---|
| Quadrant | BADHDUFLAG | Total packets | Discarded packets |
| A | 0 | 9 | 0 |
| B | 0 | 9 | 0 |
| C | 0 | 9 | 0 |
| D | 0 | 9 | 0 |
| Quadrant | Total seconds | Saturated seconds | Saturation percentage |
|---|---|---|---|
| A | 6390 | 6349 | 99.358372% |
| B | 6390 | 42 | 0.657277% |
| C | 6390 | 55 | 0.860720% |
| D | 6390 | 141 | 2.206573% |
Noise dominated data is calculated using 1-second bins in cleaned event files. If a bin has >2000 counts, and if more than 50% of those come from <1% of pixels, then it is considered to be noise-dominated and hence unusable.
| Quadrant | # 1 sec bins | Bins with >0 counts | Bins with >2000 counts | High rate bins dominated by noise | Noise dominated (total time) | Noise dominated (detector-on time) | Marked lightcurve |
|---|---|---|---|---|---|---|---|
| A | 7274 | 6389 | 5927 | 5927 | 81.48% | 92.77% | 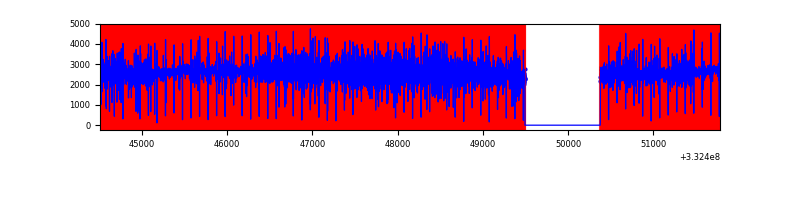 |
| B | 7275 | 6391 | 2 | 2 | 0.03% | 0.03% | 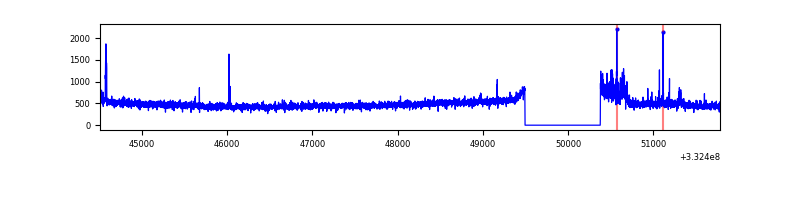 |
| C | 7275 | 6391 | 2 | 2 | 0.03% | 0.03% | 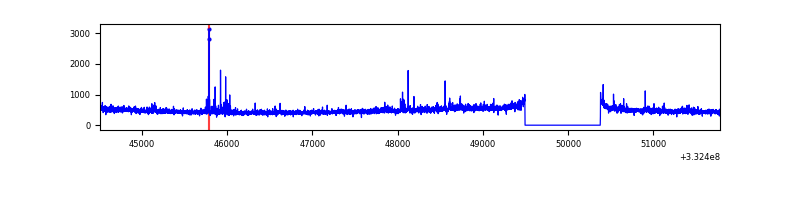 |
| D | 7275 | 6391 | 103 | 103 | 1.42% | 1.61% | 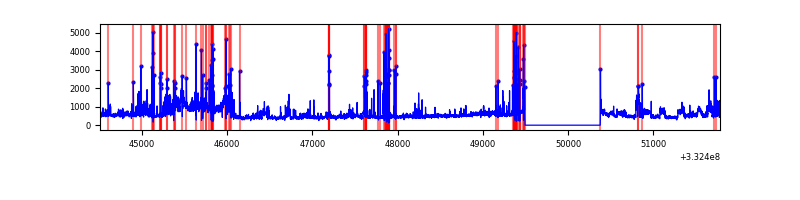 |
Top three noisy pixels from each quadrant. If the there are fewer than three noisy pixels in the level2.evt file, extra rows are filled as -1
| Pixel properties | Quadrant properties | ||||||
|---|---|---|---|---|---|---|---|
| Quadrant | DetID | PixID | Counts | Sigma | Mean | Median | Sigma |
| A | 0 | 13 | 15493030 | 294736.04 | 257 | 252 | 52.6 |
| A | 13 | 254 | 3724 | 66.05 | 257 | 252 | 52.6 |
| A | 3 | 137 | 2177 | 36.62 | 257 | 252 | 52.6 |
| B | 0 | 190 | 80958 | 552.92 | 767 | 751 | 145.1 |
| B | 15 | 33 | 41139 | 278.42 | 767 | 751 | 145.1 |
| B | 0 | 219 | 21343 | 141.95 | 767 | 751 | 145.1 |
| C | 14 | 238 | 117794 | 690.73 | 728 | 733 | 169.5 |
| C | 3 | 233 | 87311 | 510.86 | 728 | 733 | 169.5 |
| C | 2 | 16 | 42809 | 248.27 | 728 | 733 | 169.5 |
| D | 1 | 52 | 1323297 | 7573.28 | 728 | 710 | 174.6 |
| D | 7 | 80 | 98584 | 560.44 | 728 | 710 | 174.6 |
| D | 2 | 234 | 29749 | 166.28 | 728 | 710 | 174.6 |
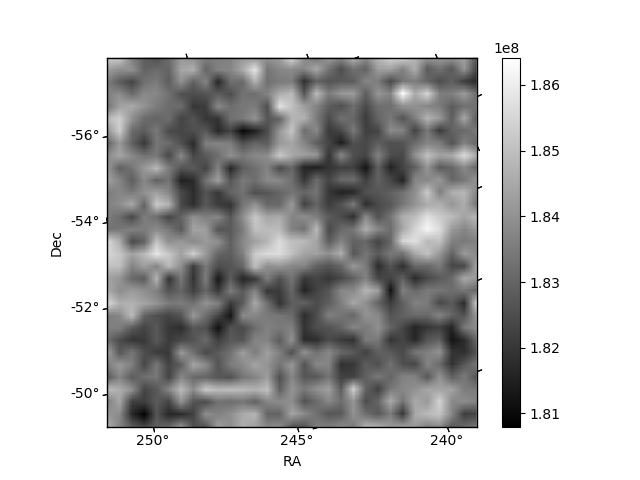
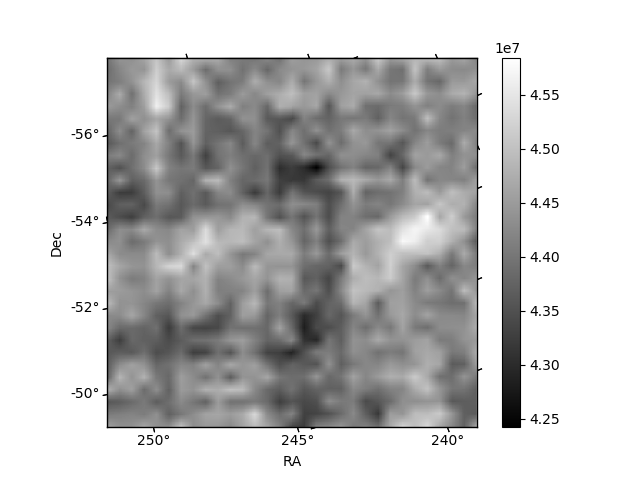
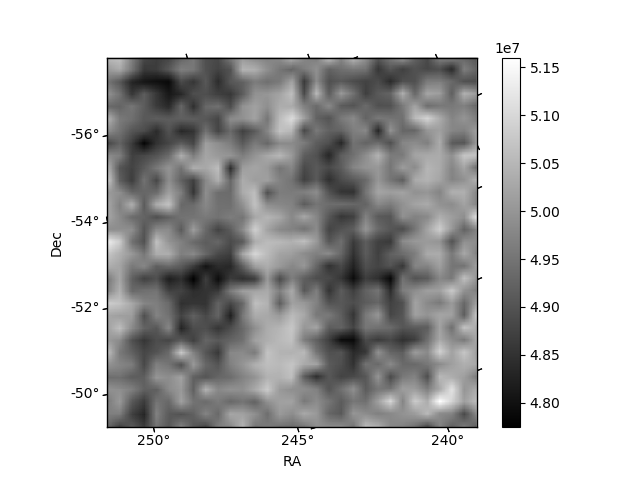
Histogram calculated using DETX and DETY for each event in the final _common_clean file
| Quadrant A | 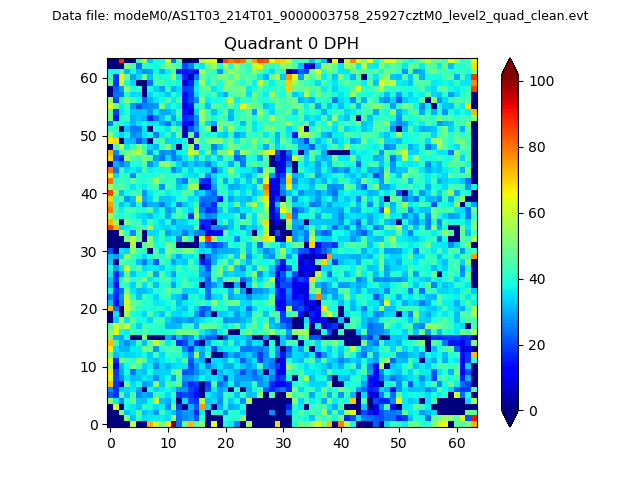 |
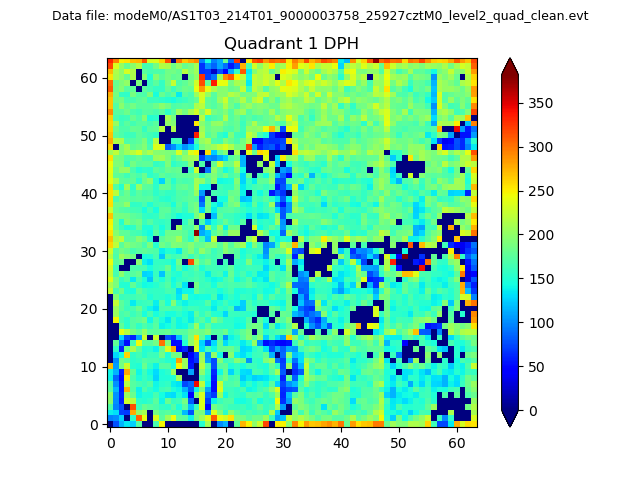 |
Quadrant B |
|---|---|---|---|
| Quadrant D | 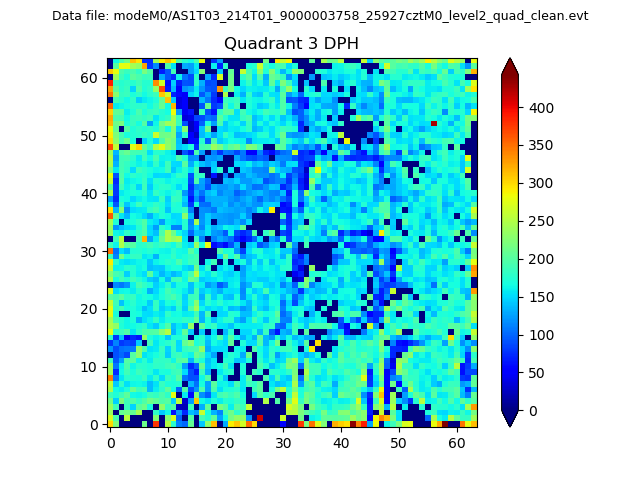 |
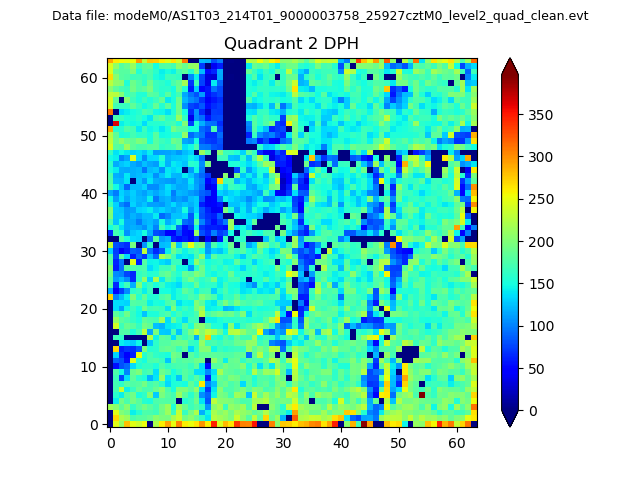 |
Quadrant C |
| Plot type | Count rate plots | Images |
|---|---|---|
| Comparison with Poisson distribution Blue bars denote a histogram of data divided into 1 sec bins. Red curve is a Poisson curve with rate = median count rate of data. |
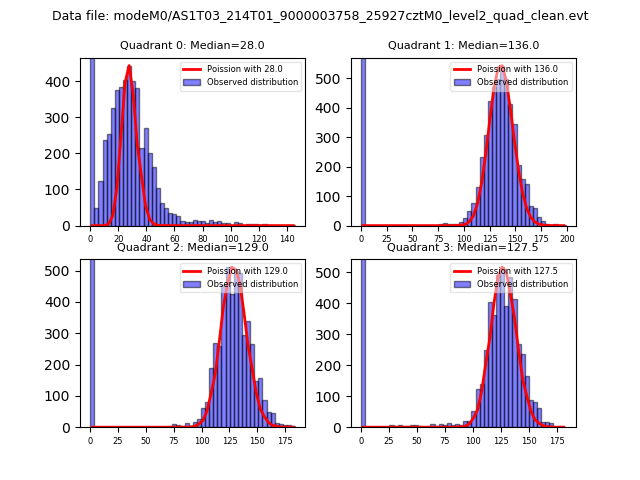 |
 |
| Quadrant-wise count rates Data is divided into 100 sec bins |
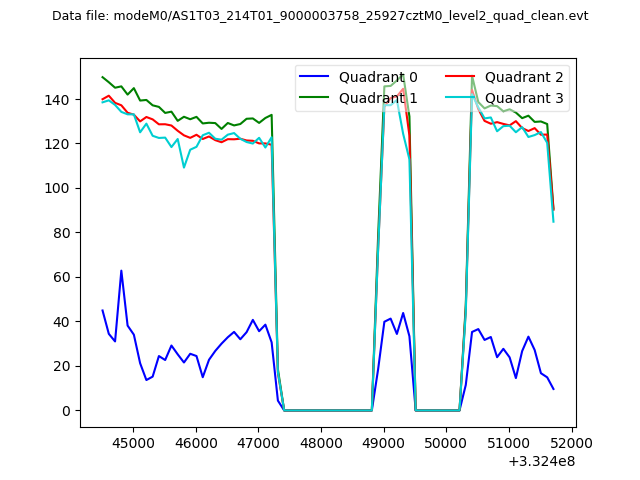 |
|
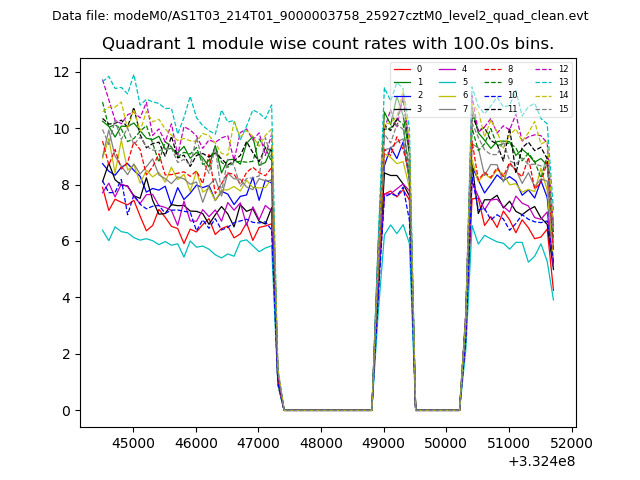
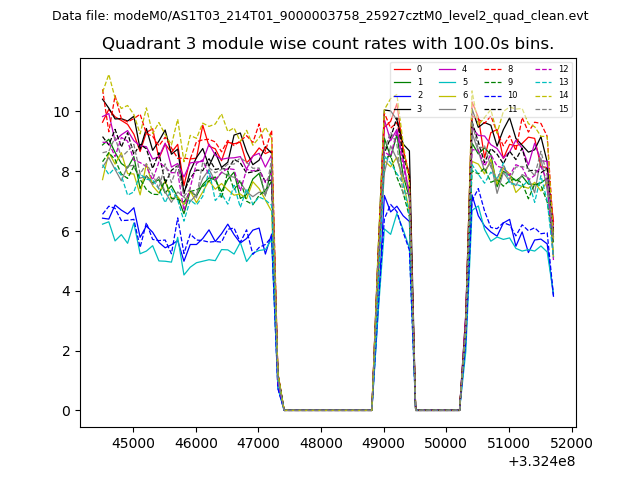
| Module-wise count rates for Quadrant A Data is divided into 100 sec bins |
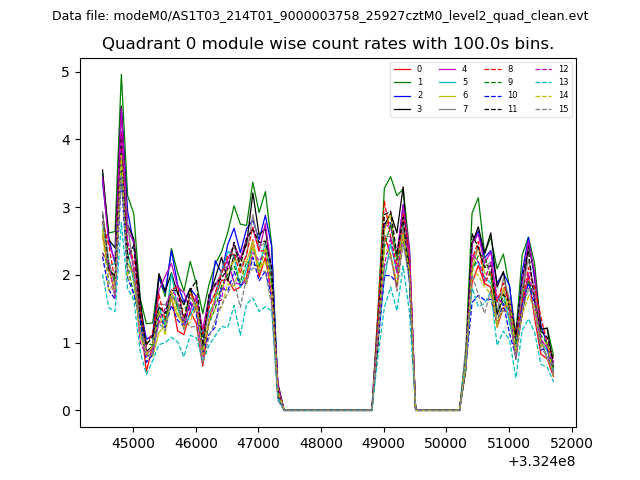 |
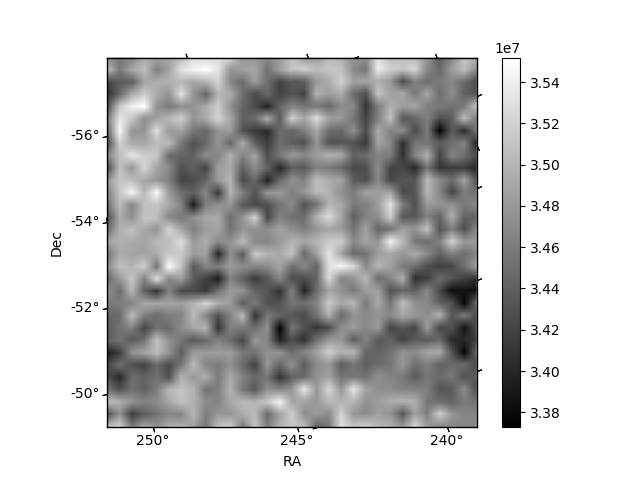 |
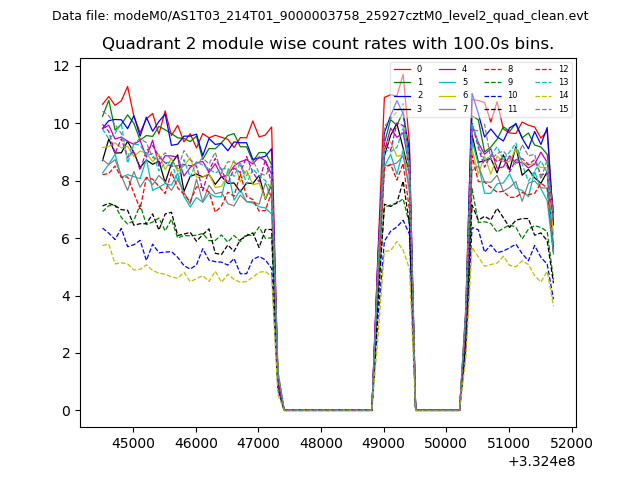
| Module-wise count rates for Quadrant B Data is divided into 100 sec bins |
 |
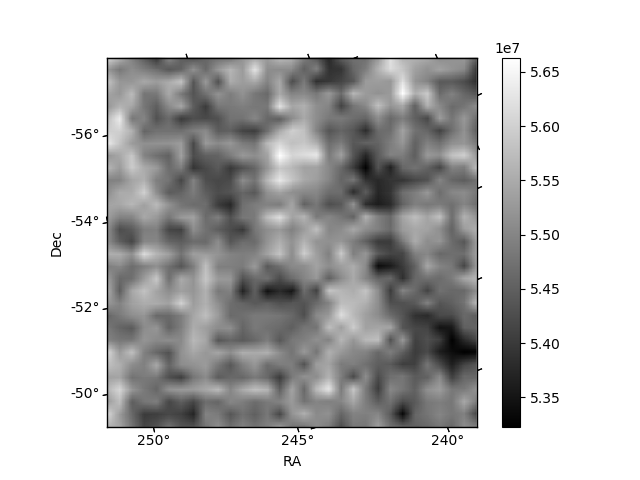 |
| Module-wise count rates for Quadrant C Data is divided into 100 sec bins |
 |
 |
| Module-wise count rates for Quadrant D Data is divided into 100 sec bins |
 |
 |
| Parameter | Plot |
|---|---|
| CZT HV Monitor | 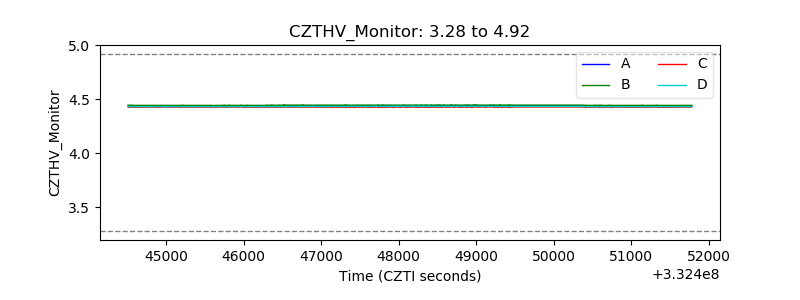 |
| D_VDD | 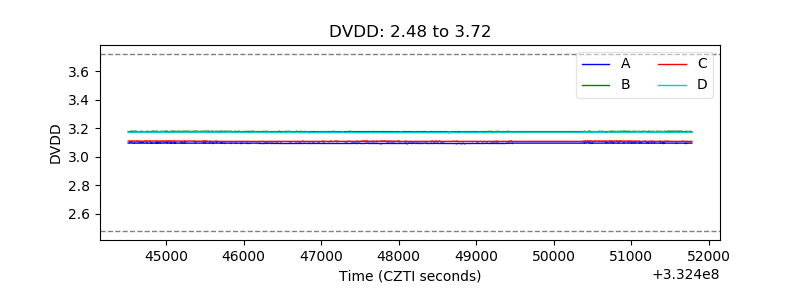 |
| Temperature 1 |  |
| Veto HV Monitor | 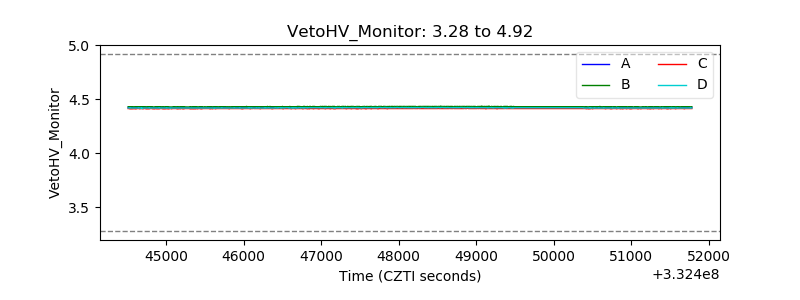 |
| Veto LLD | 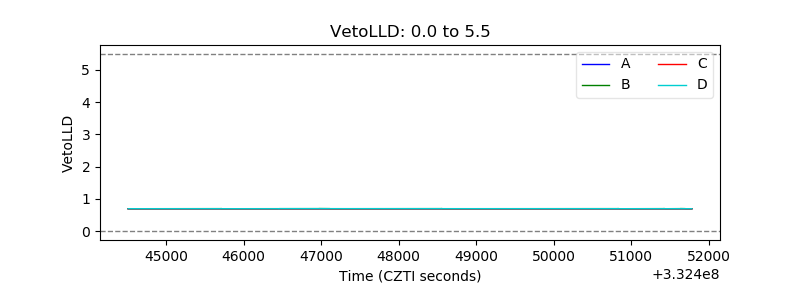 |
| Alpha Counter | 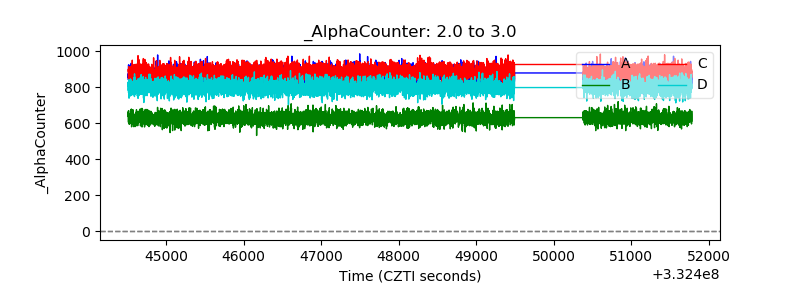 |
| _CPM_Rate | 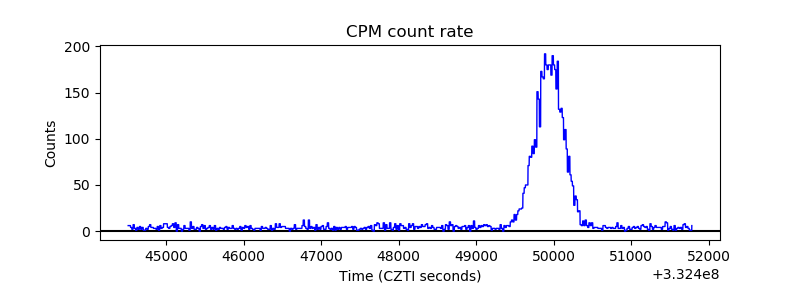 |
| CZT Counter | 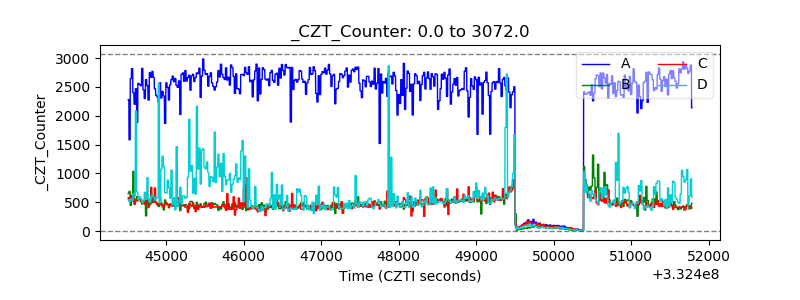 |
| +2.5 Volts monitor |  |
| +5 Volts monitor | 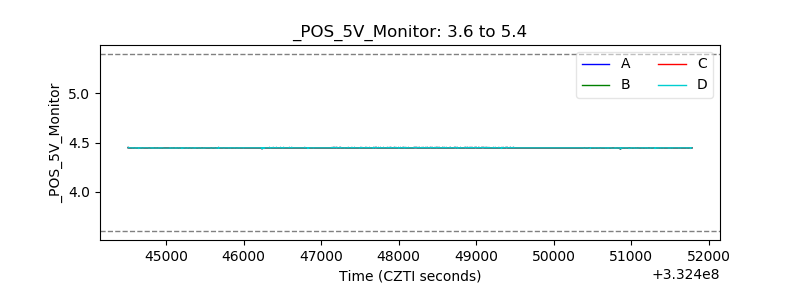 |
| _ROLL_ROT |  |
| _Roll_DEC | 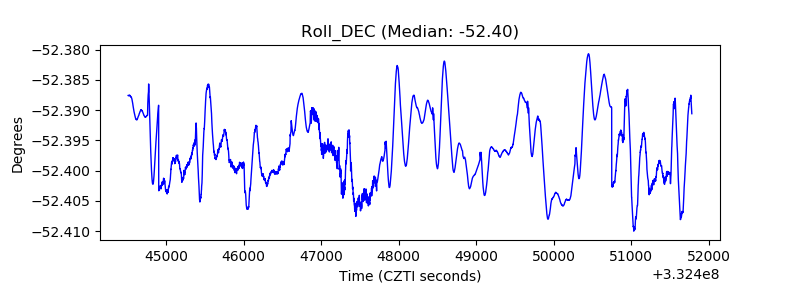 |
| _Roll_RA | 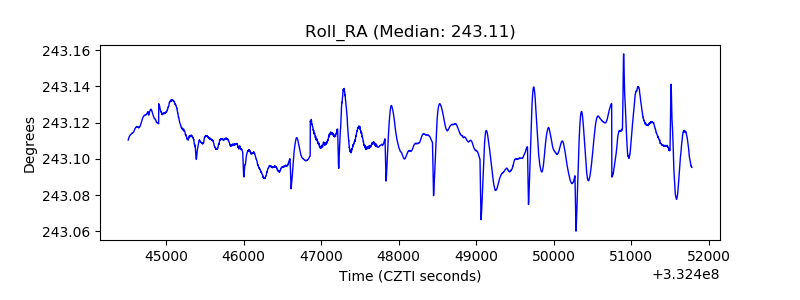 |
| Veto Counter | 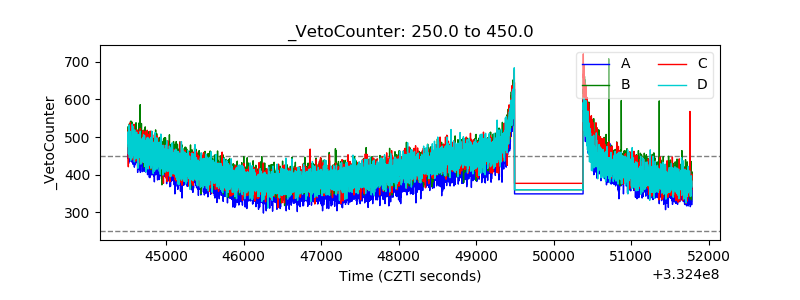 |