| Param | Original file | Final file |
|---|---|---|
| Filename | modeM0/AS1T03_214T01_9000003758_25929cztM0_level2.evt | modeM0/AS1T03_214T01_9000003758_25929cztM0_level2_quad_clean.evt |
| Size (bytes) | 1,655,893,440 | 145,935,360 |
| Size | 1.5 GB | 139.2 MB |
| Events in quadrant A | 31,660,884 | 205,502 |
| Events in quadrant B | 5,781,031 | 1,172,379 |
| Events in quadrant C | 5,690,187 | 1,120,456 |
| Events in quadrant D | 6,229,892 | 1,109,493 |
| Mode M0 | |||
|---|---|---|---|
| Quadrant | BADHDUFLAG | Total packets | Discarded packets |
| A | 0 | 102336 | 0 |
| B | 0 | 25293 | 0 |
| C | 0 | 25000 | 0 |
| D | 0 | 27187 | 0 |
| Mode M9 | |||
|---|---|---|---|
| Quadrant | BADHDUFLAG | Total packets | Discarded packets |
| A | 0 | 17 | 13 |
| B | 0 | 7 | 3 |
| C | 0 | 10 | 6 |
| D | 0 | 11 | 7 |
| Quadrant | Total seconds | Saturated seconds | Saturation percentage |
|---|---|---|---|
| A | 12136 | 12071 | 99.464403% |
| B | 12227 | 53 | 0.433467% |
| C | 12230 | 90 | 0.735895% |
| D | 12196 | 60 | 0.491965% |
Noise dominated data is calculated using 1-second bins in cleaned event files. If a bin has >2000 counts, and if more than 50% of those come from <1% of pixels, then it is considered to be noise-dominated and hence unusable.
| Quadrant | # 1 sec bins | Bins with >0 counts | Bins with >2000 counts | High rate bins dominated by noise | Noise dominated (total time) | Noise dominated (detector-on time) | Marked lightcurve |
|---|---|---|---|---|---|---|---|
| A | 13268 | 12141 | 11379 | 11379 | 85.76% | 93.72% | 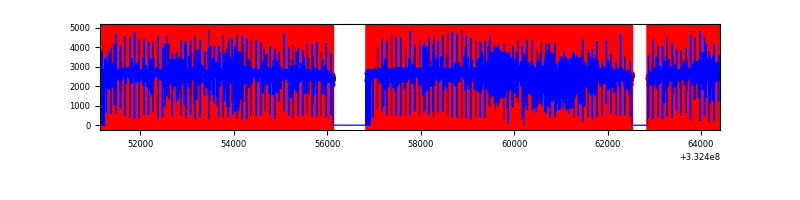 |
| B | 13267 | 12267 | 1 | 1 | 0.01% | 0.01% | 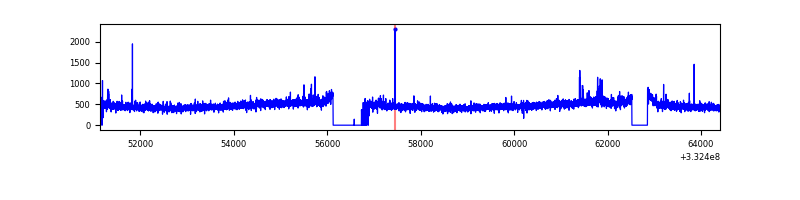 |
| C | 13267 | 12270 | 0 | 0 | 0.00% | 0.00% | 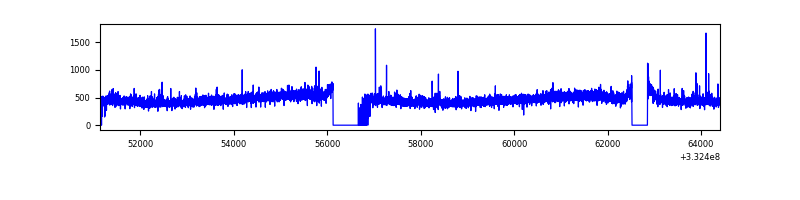 |
| D | 13269 | 12236 | 31 | 31 | 0.23% | 0.25% | 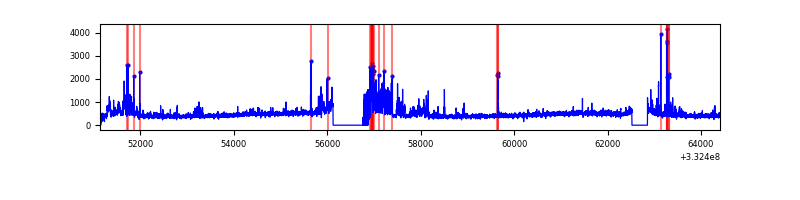 |
Top three noisy pixels from each quadrant. If the there are fewer than three noisy pixels in the level2.evt file, extra rows are filled as -1
| Pixel properties | Quadrant properties | ||||||
|---|---|---|---|---|---|---|---|
| Quadrant | DetID | PixID | Counts | Sigma | Mean | Median | Sigma |
| A | 0 | 13 | 30110876 | 375647.41 | 400 | 393 | 80.2 |
| A | 13 | 254 | 5914 | 68.88 | 400 | 393 | 80.2 |
| A | 3 | 137 | 3418 | 37.74 | 400 | 393 | 80.2 |
| B | 0 | 190 | 66589 | 239.15 | 1435 | 1399 | 272.6 |
| B | 0 | 219 | 62762 | 225.11 | 1435 | 1399 | 272.6 |
| B | 12 | 111 | 33486 | 117.71 | 1435 | 1399 | 272.6 |
| C | 14 | 238 | 218555 | 674.0 | 1374 | 1376 | 322.2 |
| C | 3 | 233 | 93221 | 285.03 | 1374 | 1376 | 322.2 |
| C | 2 | 16 | 27263 | 80.34 | 1374 | 1376 | 322.2 |
| D | 1 | 52 | 892486 | 2616.69 | 1382 | 1345 | 340.6 |
| D | 2 | 234 | 53810 | 154.06 | 1382 | 1345 | 340.6 |
| D | 7 | 80 | 47935 | 136.8 | 1382 | 1345 | 340.6 |
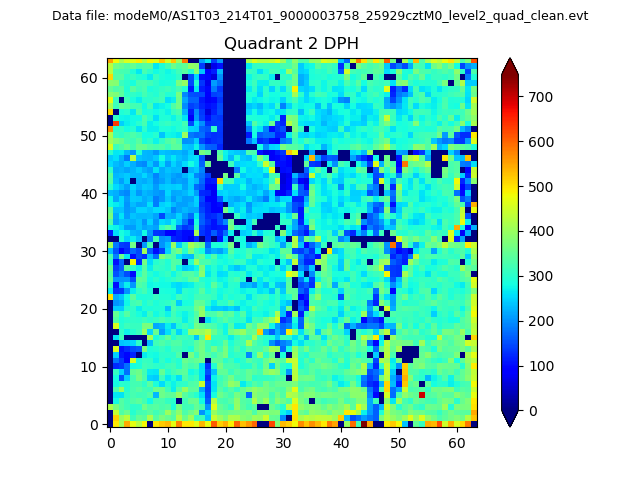
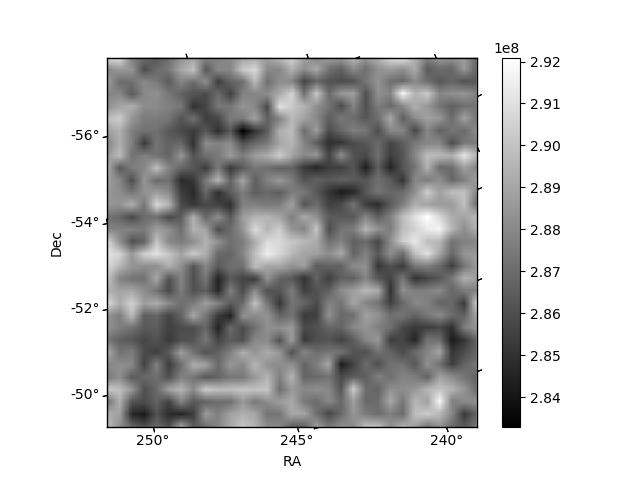
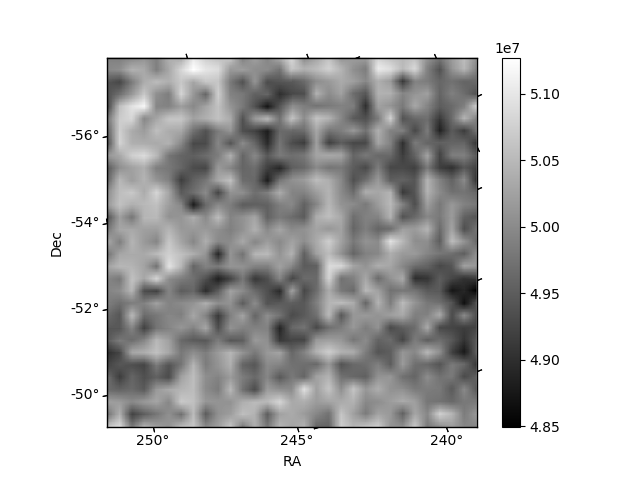
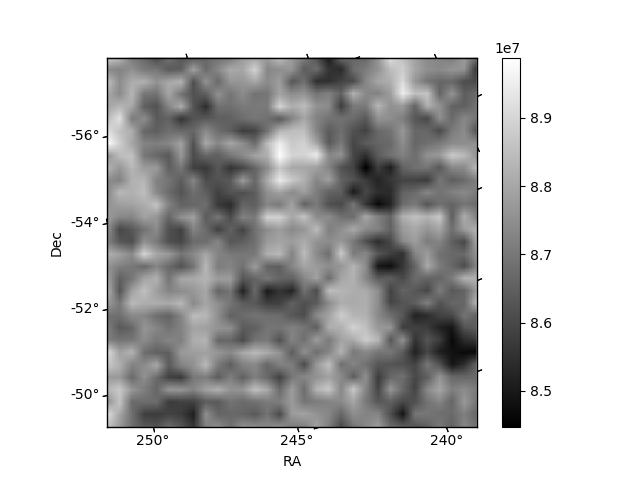
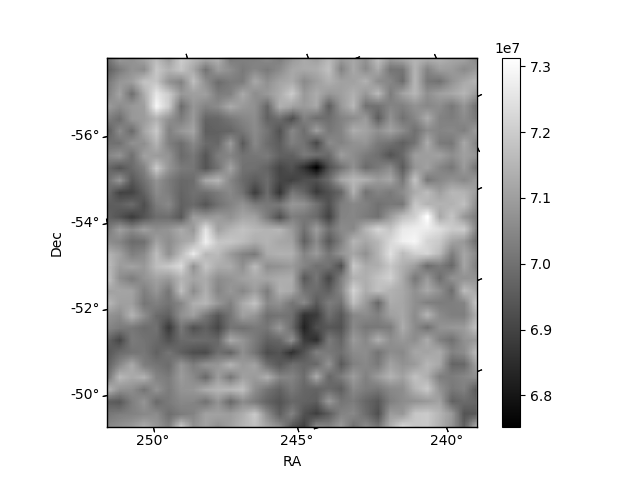
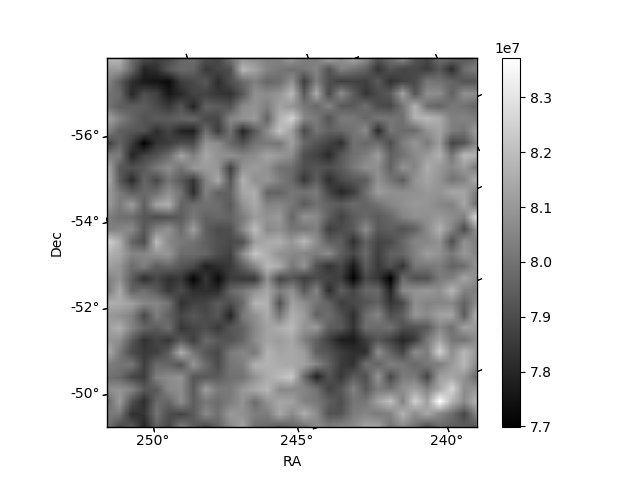
Histogram calculated using DETX and DETY for each event in the final _common_clean file
| Quadrant A | 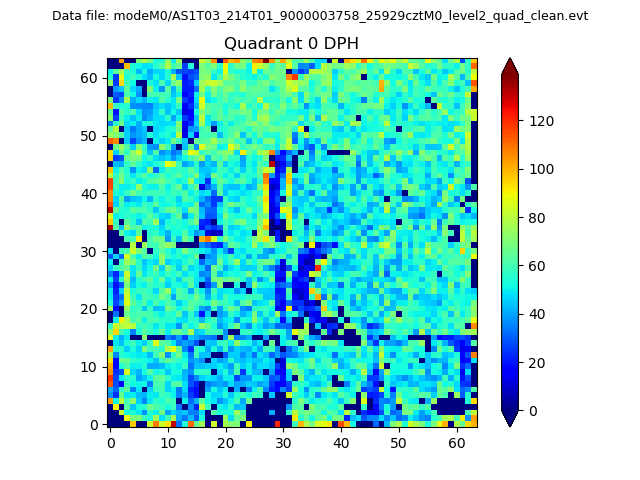 |
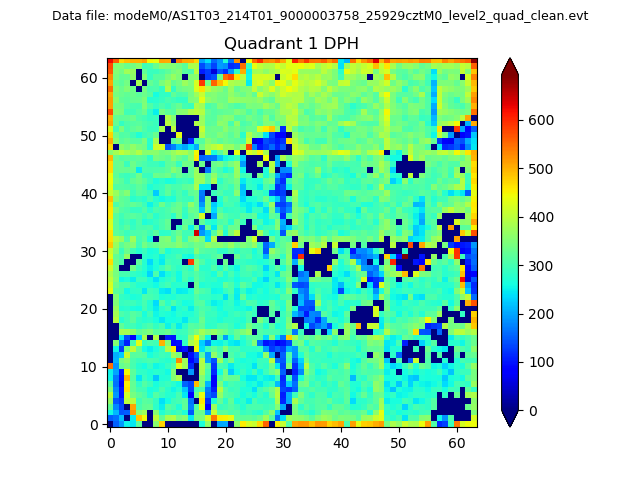 |
Quadrant B |
|---|---|---|---|
| Quadrant D | 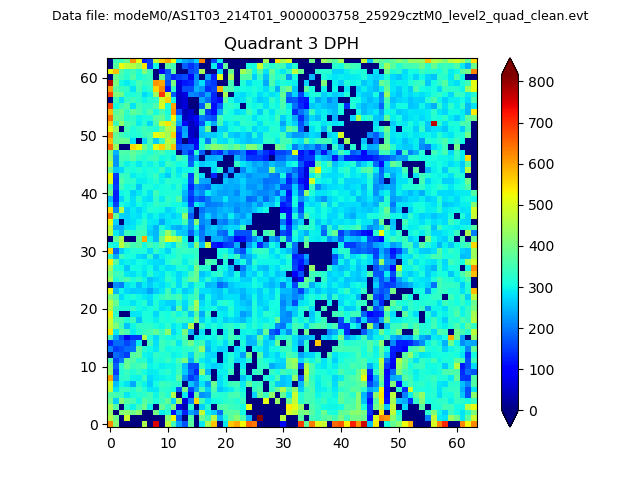 |
 |
Quadrant C |
| Plot type | Count rate plots | Images |
|---|---|---|
| Comparison with Poisson distribution Blue bars denote a histogram of data divided into 1 sec bins. Red curve is a Poisson curve with rate = median count rate of data. |
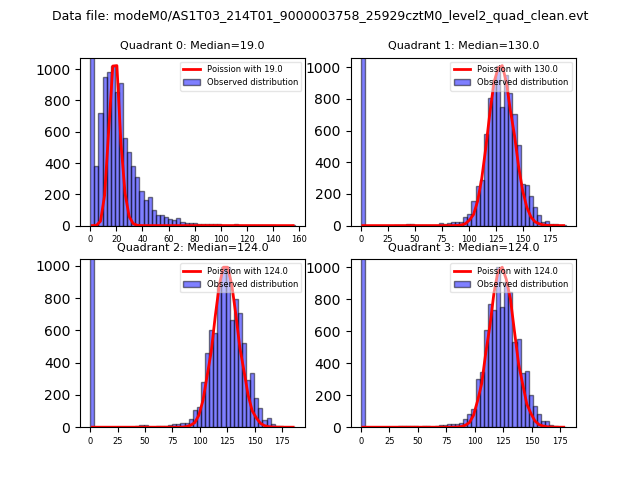 |
 |
| Quadrant-wise count rates Data is divided into 100 sec bins |
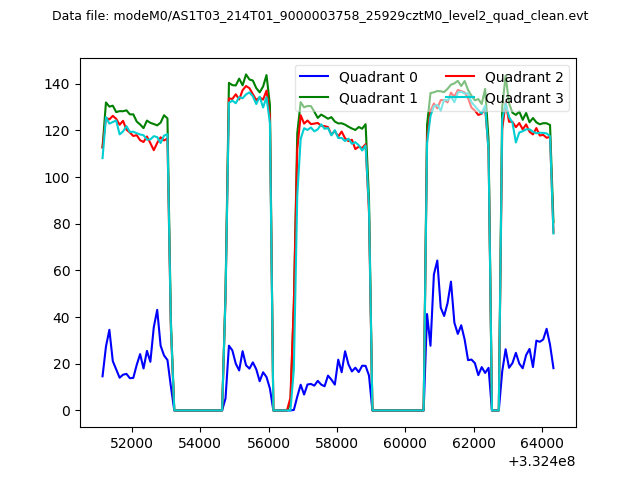 |
|
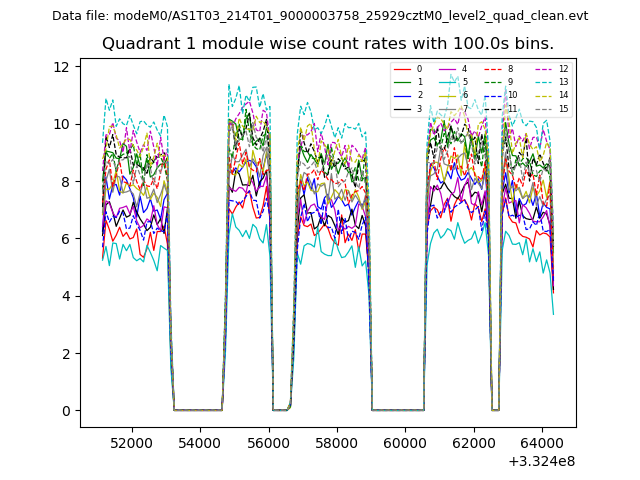
| Module-wise count rates for Quadrant A Data is divided into 100 sec bins |
 |
 |
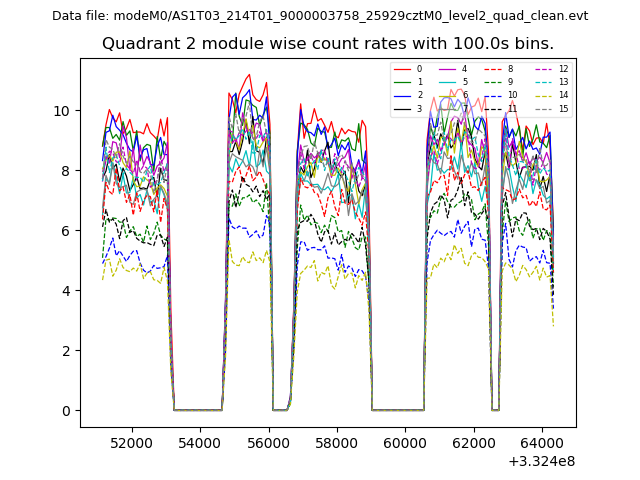
| Module-wise count rates for Quadrant B Data is divided into 100 sec bins |
 |
 |
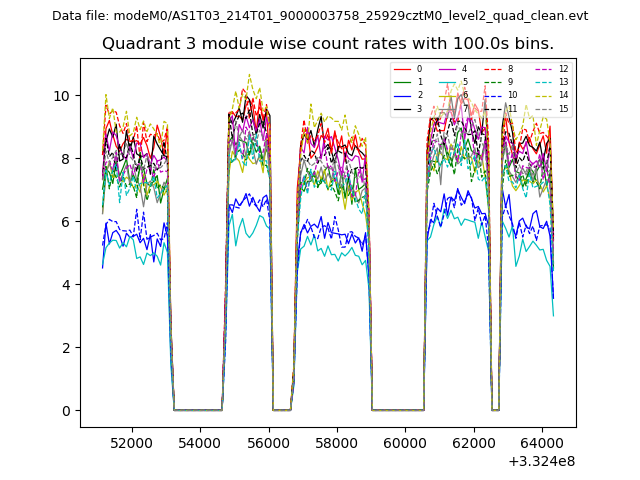
| Module-wise count rates for Quadrant C Data is divided into 100 sec bins |
 |
 |
| Module-wise count rates for Quadrant D Data is divided into 100 sec bins |
 |
 |
| Parameter | Plot |
|---|---|
| CZT HV Monitor | 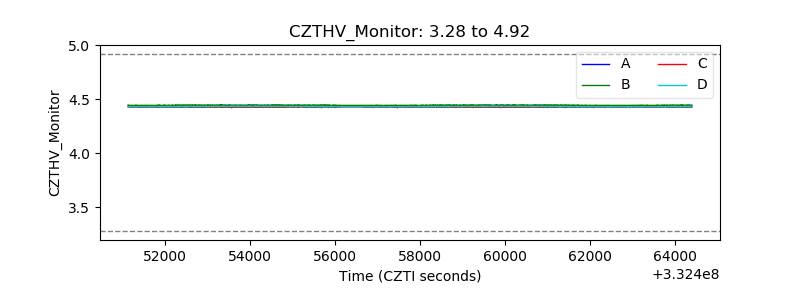 |
| D_VDD | 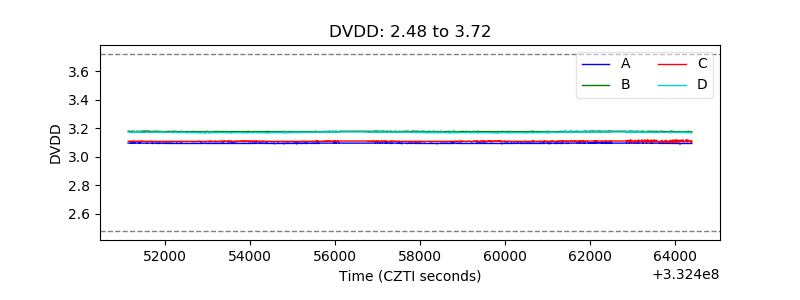 |
| Temperature 1 | 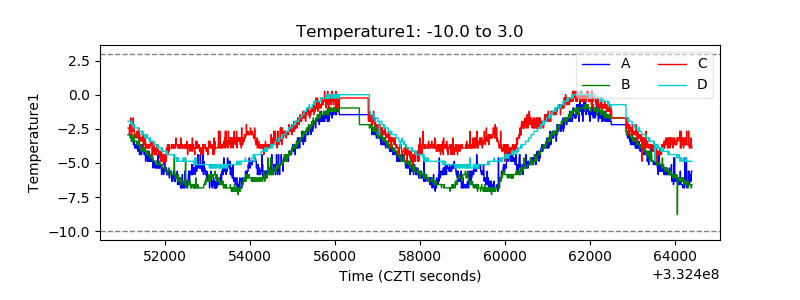 |
| Veto HV Monitor | 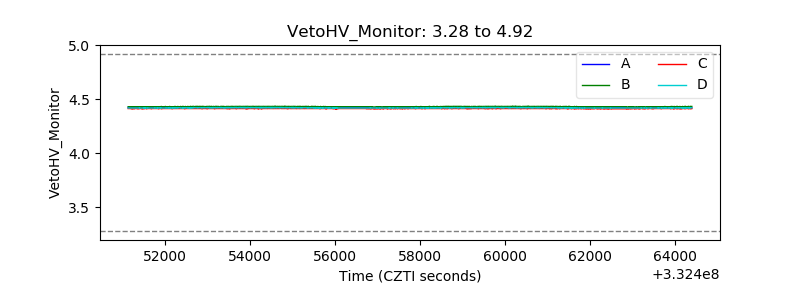 |
| Veto LLD |  |
| Alpha Counter | 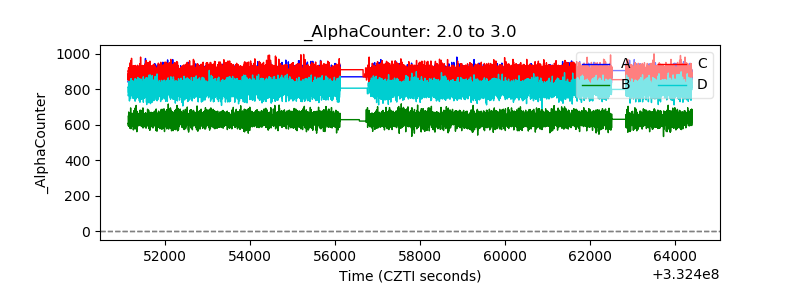 |
| _CPM_Rate | 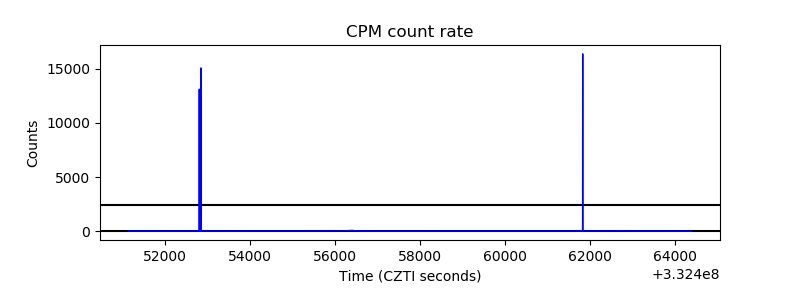 |
| CZT Counter | 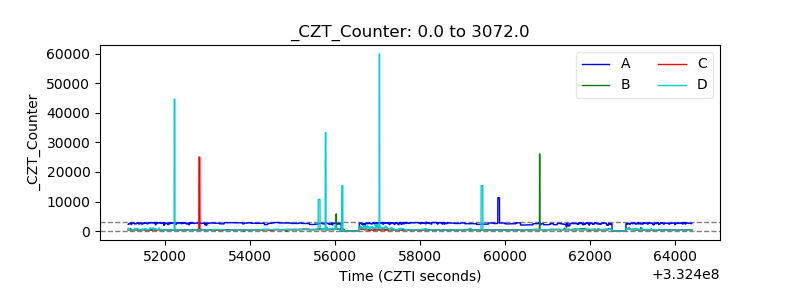 |
| +2.5 Volts monitor |  |
| +5 Volts monitor |  |
| _ROLL_ROT |  |
| _Roll_DEC | 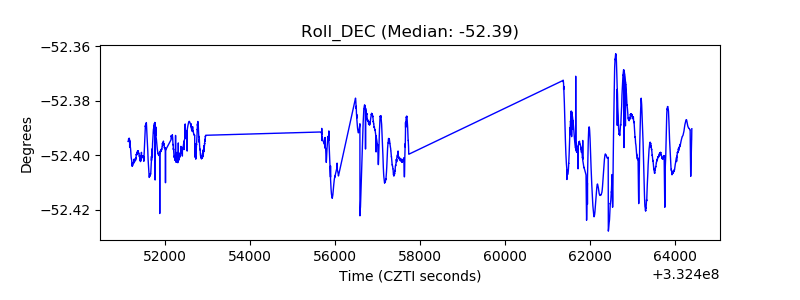 |
| _Roll_RA | 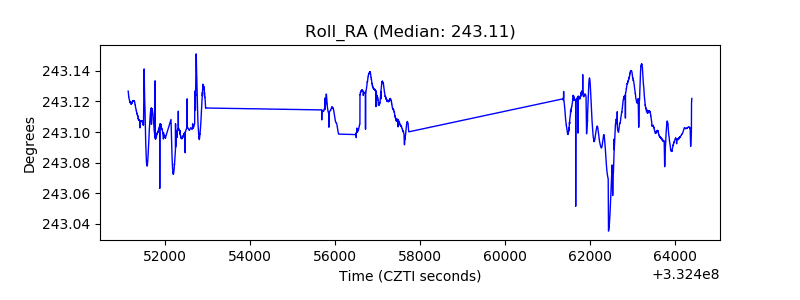 |
| Veto Counter |  |